國立台灣大學電機資訊學院資訊工程學系 碩士論文
Department of Computer Science and Information Engineering College of Electrical Engineering and Computer Science
National Taiwan University Master Thesis
基於程式相態特性的異質系統效能分析
Characterization of Program Phases for Heterogeneous Systems with Virtual Platforms
吳仁捷 Jen-Chieh Wu
指導教授: 洪士灝 博士 Advisor: Dr. Shih-Hao Hung
中華民國 105 年 7 月
Acknowledgments
首先感謝洪教授在研究過程中提供的建議、鼓勵、以及研究方法上的教導,讓我 得以踏實地完成這份研究。
其次感謝博士班的葉志威學長以及涂嘉恆博士,耐心地與我討論研究方向以及提 出各種盲點。
亦感謝PASLAB的同學們,互相討論的過程總是能激盪出研究的火花。
最後感謝我的家人與女友在這段期間對我的支持,因為有你們,使我能保持著正 向的態度面對研究的難題。
i
摘 摘 摘要 要 要
面對不熟悉的程式時,程式行為分析工具扮演著重要的角色。面對複雜的程式,
能夠針對程式各段不同的行為做出分析,也成為重要的課題。先前的研究聚焦在 分析程式的各個函式或是迴圈,然而這樣的分析忽略了在函式及迴圈的內部也存 在著不同的行為。
在這份研究中,我們使用程式相態判別(Program Phase Detection)的技術做為將
程式切分的依據,並建立了以此為基礎的分析工具。更進一步,我們藉由機器學
習預測每個程式相態的GPU友善度,驗證了程式相態在某些高階特徵上確實存在
群聚效果,其預測準確度為94%。最後我們藉由實際的例子,說明以程式相態為
基礎的分析工具確實可以偵測出函式及迴圈內部的不同行為。
關 關
關鍵鍵鍵字字字:::程式相態、程式分析、裝置友善度
Abstract
When we first met an unfamiliar program, the profiling tool plays an important role in understanding program behavior. As software applications become more and more complicated, to profile each section with different behavior in the program is crucial. Previous studies focus on profiling each function or loop in the program, however, which might ignore the fact that different behaviors happen inside a loop or a function.
In this study, we use program phase detection to partition the program and build up a profiling tool based on it. Furthermore, we verified the grouping effect of program phases on some high-level features by predicting GPU friendliness of each program phase with machine learning model. The accuracy of prediction comes to 94%. At last, we take real applications as test cases, showing that the profiling tool based on program phase detection is able to detect behavior changing inside a loop or a function.
Key Words:Program phases, Profiling tool, GPU friendliness
iii
Contents
Acknowledgments i
摘 摘
摘要要要 ii
Abstract iii
List of Figures vii
List of Tables ix
Chapter 1 Introduction 1
Chapter 2 Background and Related Work 4
2.1 Program Phase Detection . . . 4
2.2 QEMU . . . 5
2.2.1 Virtual Performance Monitoring Units (VPMU) . . . 5
2.3 Predicting GPU Performance Using Machine Learning . . . 6
2.4 PIR: PMaC’s Idiom Recognizer . . . 7 v
2.5 Related Works . . . 7
Chapter 3 Methodology 10 3.1 Framework Overview . . . 10
3.2 Program Phase Detection in VPMU . . . 11
3.3 Grouping Effect on High Level Features . . . 12
3.3.1 GPU Friendliness Prediction . . . 13
Chapter 4 Evaluation 15 4.1 Experimental Setup . . . 15
4.2 GPU Friendliness Prediction . . . 15
4.2.1 Results of Prediction Model . . . 16
4.3 Comparing with Function-Based Profiling . . . 17
4.4 Case Study: Backpropagation . . . 18
4.5 Case Study: MCML . . . 21
4.6 Case Study: KMP . . . 23
Chapter 5 Conclusion and Future Work 28 5.1 Future Work . . . 29
Bibliography 30
List of Figures
1.1 Deeper color represents higher execution frequency. Two loops with the same statistical result, but different behavior. Left hand side:
Only get into branch B in the 2nd half of loop execution. Right hand
side: Own the same behavior during the whole loop execution. . . . 2
2.1 An overview flow diagram of this work. . . 6
2.2 Generate context tree in (b) with program in (a). . . 8
3.1 Flow chart of this framework. . . 11
3.2 Phase-window graph using different window size. The number on the graph represents number of instructions per window. . . 12
3.3 Error rate of simulating multiple simpoint is low. [15] . . . 13
4.1 Two different code structure with the same program behavior. . . 18
4.2 Window-Phase graph running two program in Figure 4.1. . . 19
4.3 Add same color for the same program phase. . . 19
4.4 Program execution flow can viewed as 6 stages. . . 20 vii
4.5 Code file content of phase 30. . . 21
4.6 Profiling information of phase 30. . . 22
4.7 Window-Phase graph for MCML. . . 23
4.8 Window-Phase graph for MCML can view as 2 stages. . . 23
4.9 Running function HopDropSpin. . . 23
4.10 Inside function HopDropSpin for stage 1 of MCML program. . . 24
4.11 Stage 2 of MCML program. . . 24
4.12 Profile KMP program using Vtune. . . 25
4.13 Window-Phase graph running KMP with our tool, part b divide dif- ferent phases with colors. . . 26
4.14 Code files content of phase 37 and phase 38. . . 27
List of Tables
2.1 Comparison between our work and existing solution. . . 9
4.1 Two sets of device on running benchmarks. . . 16
ix
Chapter 1
Introduction
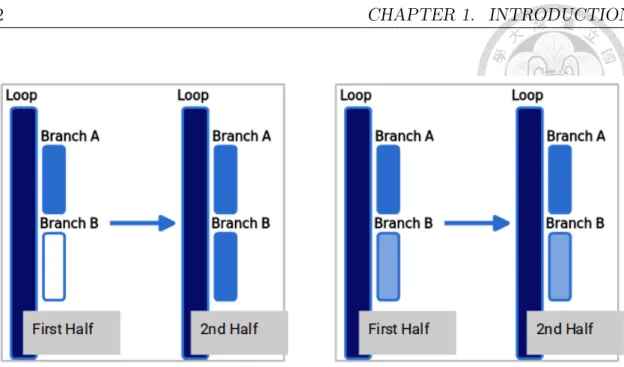
Profiling tools provide program designer a possible way to evaluate their software performance and find the potential bottleneck. Emulators or simulators further provides the environments for the users to run the program on the platform, and collect the performance-related hardware/software events on the system level, which makes less impact on program behavior. As software applications became more and more complicated, the demands of profiling not only focus on the result of the whole program but on each crucial segment of the program. The existing solution on par- titioning the program into segments use either function or loop of the program as a unit. However, multiple different behaviors may happen inside one loop or one function, each of different behavior may cause different performance issues. Figure 1.1 shows an example of different behavior inside a loop, and most existing solution may hard to reveal the difference.
2 CHAPTER 1. INTRODUCTION
Figure 1.1: Deeper color represents higher execution frequency. Two loops with the same statistical result, but different behavior.
Left hand side: Only get into branch B in the 2nd half of loop execution.
Right hand side: Own the same behavior during the whole loop execution.
In this work, we use program phase detection, a technique used to accelerate sim- ulation progress of HPC program, to solve the problem. Program phase detection divides program based on its dynamic program behavior, which is less restricted by code structure. With previous works on program phase detection showing phases owns great properties on grouping of most hardware events, we further verify this property on one of the higher level features, which we choose GPU friendliness as a target. Overall, we show that using program phase as a unit of profiling brings unique and crucial information to the user, helping them get into the program be- havior in a fast way.
The rest of this thesis is organized as follows. Chapter 2 introduces the background
3
of this study and related works. Chapter 3 describes our framework and method- ology. Chapter 4 presents the experimental results and 3 case studies. Chapter 5 summarizes our work and points out potential future works.
Chapter 2
Background and Related Work
2.1 Program Phase Detection
Program phase detection is a hardware independent method which can analyze pro- gram behavior over large sections of execution. A program phase is defined as a period of program execution with stable behavior [14], which means each phase may be different from others while owning homogeneous behavior within a phase. The behavior here can be shown on several hardware events or counters, such as cache miss rate, CPI, branch miss rate or so on [14]. With the great properties of pro- gram phases, there are several usages of this techniques. The initial purpose of this technique is to accelerate simulation of large-scale program [10, 13, 14, 15], with detailed simulating a small period inside each phase, the total simulation time of the program can be tremendously decreased while not sacrificing accuracy. Program phase detection also used on optimizing runtime decisions or resources utilization
4
2.2. QEMU 5
[8, 16].
One of the main algorithms of implementing program phase detection is using clus- tering of Basic Block Vector (BBV). For each non-overlapped interval with fixed number of executed instructions, which we defined as a window, owns its basic block vector. A Basic Block Vector (BBV) is a one-dimensional array, each element in which represents execution count of each basic block. Windows with similar Basic Block Vectors, are considered as same program phases. There are other program structures besides BBV are able to capture program phases. However, BBV is still one of the best and stable structure on doing program phase detection [6].
2.2 QEMU
QEMU [3] is a fast functional emulator using dynamic binary translation. Providing both user mode emulation and system emulation, the former enables the user to run a single program on machines with the different instruction set, the latter emulates unmodified guest operating systems. To add some flexibility to dynamic translate, QEMU provides helper function, which enables user creating a function be called during translating target code. With this feature, monitoring events of the guest system can be more convenient.
2.2.1 Virtual Performance Monitoring Units (VPMU)
Virtual Performance Monitoring Units (VPMU) [17] is a system-wide profiling tool based on QEMU. The framework collects performance related events with helper
6 CHAPTER 2. BACKGROUND AND RELATED WORK
functions, then passing the information to backend simulators. Including cache simulator, branch simulator, timing models and so on.
2.3 Predicting GPU Performance Using Machine Learning
Graphics processing units are widely used on accelerating general-purpose programs nowadays. However, porting serial program or some parallel program to GPU, more- over tuning the program to get better performance still needs much effort. Therefore, estimating the performance gain before working on it becomes crucial.
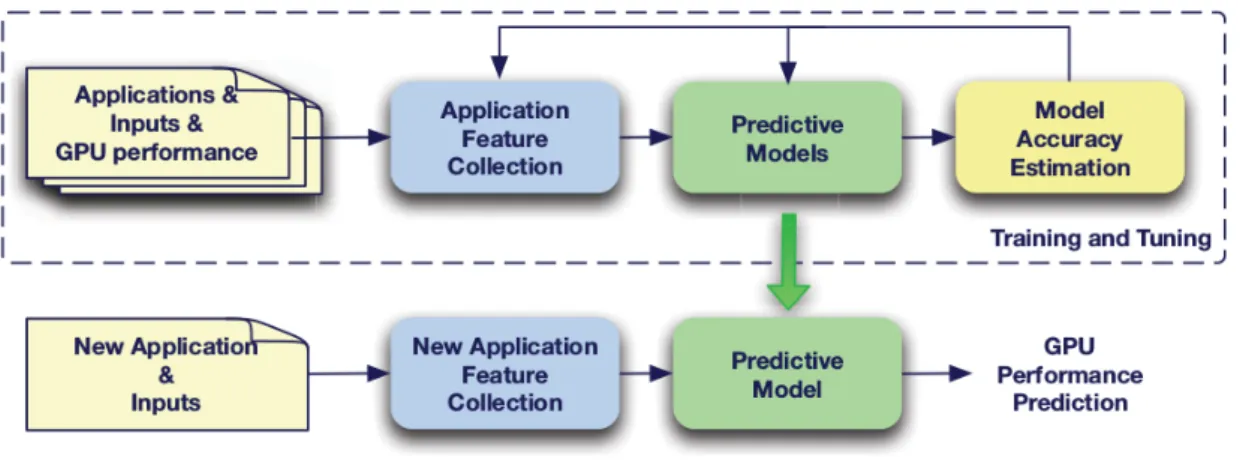
Figure 2.1: An overview flow diagram of this work.
One of the latest work [2] in this area shows the possibility of predicting GPU performance using machine learning algorithm with hardware independent features.
Figure 2.1 shows the concept flow of this work. The model uses several types of
2.4. PIR: PMAC’’’S IDIOM RECOGNIZER 7
instruction counts as input features, including ALU, load, branch, and total instruc- tion counts, where these features are collected during CPU execution using pin [7].
After running program on GPU, the speedup comparing with running serial version program on CPU sets as the label of input. Using benchmarks from Rodinia suite [4], the result accuracy of this model is around 80%.
2.4 PIR: PMaC ’ ’ ’s Idiom Recognizer
This work [9] found seven idioms that are commonly found on HPC applications, which are considered potentially fit for GPU. Including stream, transpose, gather, scatter, reduction, and stencil. Each of them can be described as a pattern of code.
2.5 Related Works
The main purpose of our work is to find a proper way partitioning the program into several sections and delivers its profiling result with suggestions. So we need to look at some existing solutions.
Gprof [5] shows basic profiling results for each function, the results including total execution time, the number of calls, the average time in the single call. Grof also provides function call graph of the program. However, the user is not able to know the behavior inside a function. Vtune [1] is a strong profiling tool. In hotspot mode of Vtune, CPU time and some other profiling information of each function are delivered. Inside a function, the user can know CPU execution time and CPI of
8 CHAPTER 2. BACKGROUND AND RELATED WORK
each line of code, which helps the user find out performance bottleneck in a function.
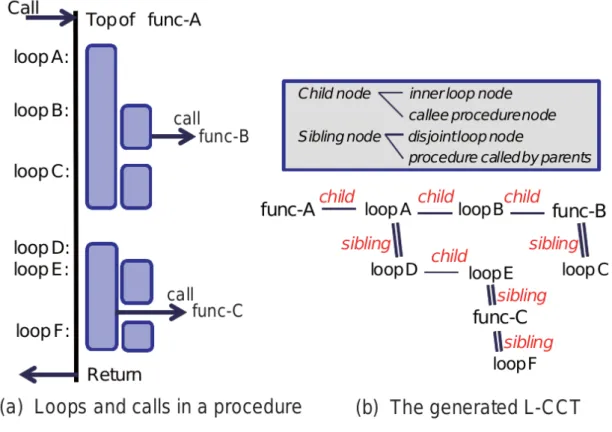
L-CCT graph [12] is able to extract all the loops and functions in a program, then generate the loop-call context tree. An example is shown in figure 2.2. With this work, each function and loop in the program can be a unit of profiling.
Figure 2.2: Generate context tree in (b) with program in (a).
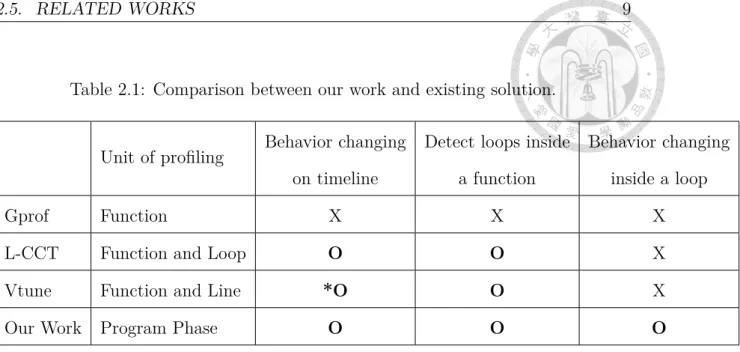
From table 2.1, we can discover that the pure function based profiling tool is not able to reveal behavior changing inside a function. The execution order of each function or loop is also not shown on Gprof, while Vtune allowed the user to specified a range of time, showing execution part of code in that time range. However, the user can not easily find out the timing where behavior changes. At last, behavior changing
2.5. RELATED WORKS 9
Table 2.1: Comparison between our work and existing solution.
Unit of profiling Behavior changing on timeline
Detect loops inside a function
Behavior changing inside a loop
Gprof Function X X X
L-CCT Function and Loop O O X
Vtune Function and Line *O O X
Our Work Program Phase O O O
inside a loop can be a crucial problem, for example, a two-staged loop behavior might indicate that user further optimizes the loop for each stage. Nevertheless, three profiling tools mentioned in the table are not able to detect this.
Chapter 3
Methodology
This chapter presents the detailed framework and implementation. We proposed a profiling tool based on VPMU and featuring program phase detection. With this tool, the user can receive profiling information for each program phase. Also, to verify that program phase owns grouping effect on high-level features, we implement a GPU friendliness prediction model with machine learning technique, which helps the user quickly find out potential part of the program that fit for GPU.
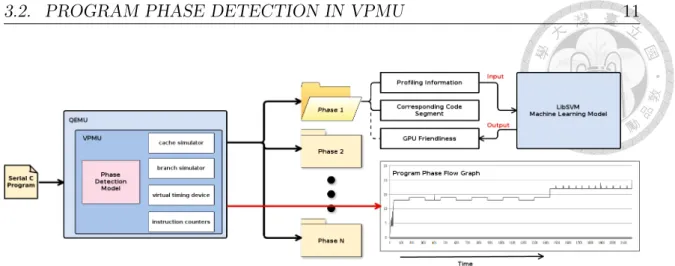
3.1 Framework Overview
Figure 3.1 is the framework overview of this work. The input of our work is a compiled serial C program. Running the program on QEMU with VPMU, which a program phase detection model is built inside. The output result for each phase including profiling information collected from VPMU, part of code executed, and
10
3.2. PROGRAM PHASE DETECTION IN VPMU 11
Figure 3.1: Flow chart of this framework.
predicted GPU friendliness from machine learning model. A phase-window graph is generated at the end of program execution, which shows the phase number of each window in a timely order.
3.2 Program Phase Detection in VPMU
Previous work [6] shows that Basic Block Vector (BBV) is one of the best algorithms on program phase detection, so in this work, we implement BBV as a fingerprint on phase classification.
As the windows in the same program phase owns nearly the same BBV, and each basic block matches one line or few lines of program code. Each BBV actually matches a larger subset of program code, with different execution counts in each line of the program. Therefore, windows in the same program phase are considered repeatedly executing the same subset of program, which could be meaningful if we reveal the subset of program to the user.
Although using the same algorithm on implementing program phase detection, the
12 CHAPTER 3. METHODOLOGY
purpose and the way of using it is different. Our work focuses on revealing behavior of each phase, while previous works [15, 13] focus on finding representative simulation points, which don’t really cares about the small-scale behavior of the program.
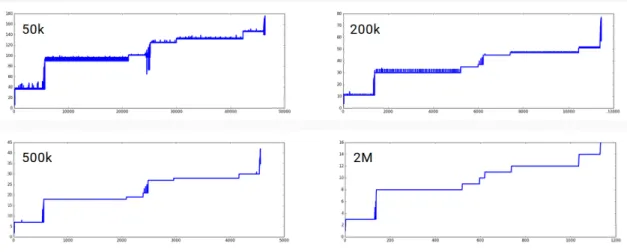
Figure 3.2: Phase-window graph using different window size. The number on the graph represents number of instructions per window.
In order to increase the sensitivity of detecting small scale program behavior, we reduced the size of a window from 100M instructions [13] to 200k instructions.
Figure 3.2 shows window-phase graph using different window size, window size 200k has less noise then window size 50k with revealing more detail then larger windows.
3.3 Grouping Effect on High Level Features
Program phases have great property on grouping of low-level features, such as branch miss rate, IPC, data cache miss rate and so on. Figure 3.3 shows this property, find-
3.3. GROUPING EFFECT ON HIGH LEVEL FEATURES 13
Figure 3.3: Error rate of simulating multiple simpoint is low. [15]
ing simulation points in each program phase (Multiple in graph) results in low error rate.
With the property mentioned above, we wondered whether the grouping effect still exists on program phases when it comes to higher level, and more abstract features.
Such as memory footstep, device friendliness or so on. In this work, we choose GPU friendliness to verify the assumption.
3.3.1 GPU Friendliness Prediction
We already know that using machine learning technique[2] to predict GPU acceler- ation of program achieves around 80% accuracy. We use the same algorithm, same input features, same testing benchmarks, the only modification is we use program phases, instead of the whole program, as a unit of data. If program phases are ac- tually independent of the GPU friendliness, under our experiment design, the result
14 CHAPTER 3. METHODOLOGY
should also be around 80% or even worse.
Each program phase matches different part of code. Some of the phases match kernel part of OpenCL version benchmark, while the other phases match non-kernel part of the benchmark. Since that, We define GPU friendliness in two different ways:
• If the phases map to kernel part of OpenCL version program, we run the program on real machines. If GPU runs the kernel 2 times faster than CPU, we define it GPU friendly. Noted that the speedup of two is originally used on previous work [2].
• If the phases map to the other part of the program, we checked if it matches the idioms [9] that considered fit for GPU.
Chapter 4
Evaluation
4.1 Experimental Setup
Our system runs on a virtual platform with following configuration:
• Virtual platform: QEMU emulator version 0.15.1
• Guest operating system: Linux Vexpress-ARM version 4.4.0+
• Guest CPU model: ARMv7 processor (Cortex-A9)
4.2 GPU Friendliness Prediction
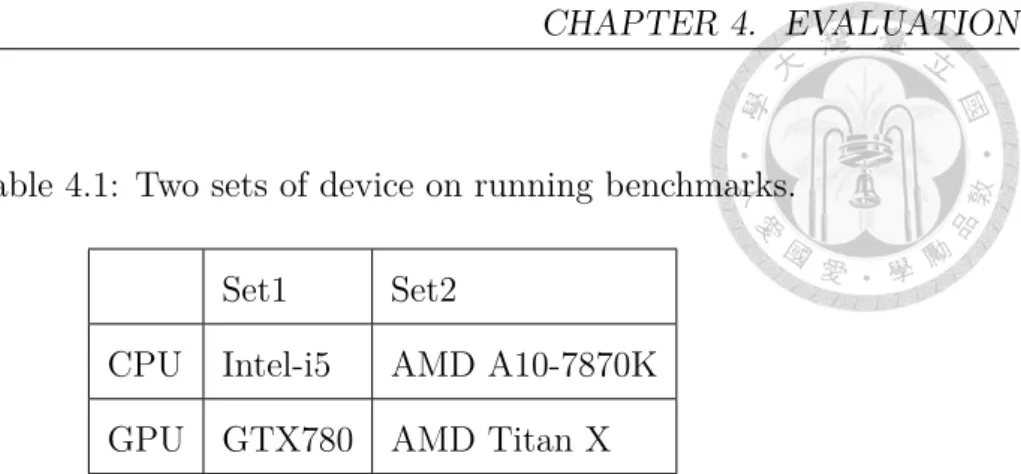
For labeling the GPU friendliness of the phases running kernel part of program, we measure the running time of these kernel on two sets of machine in table 4.1.
For testing the accuracy of the GPU friendliness prediction, we take 17 programs
16 CHAPTER 4. EVALUATION
Table 4.1: Two sets of device on running benchmarks.
Set1 Set2
CPU Intel-i5 AMD A10-7870K GPU GTX780 AMD Titan X
in Rodinia as benchmarks. All of these programs are writing in both OpenMP and OpenCL version.
The input features for the machine learning model are: ALU instruction counts, load instruction counts, branch instruction counts, total instruction counts. We normalize the input before sending into machine learning model. Noticed that these features are exactly as same as previous work [2].
4.2.1 Results of Prediction Model
17 benchmarks produce a total of 371 training data, each of which represents a pro- gram phase containing more than 3 windows. We use cross-validation to verify our results.
2 sets of machine have the same results:
• Accuracy: 94.1% (349/371)
• Recall: 89.2% (124/139)
• Precision: 94.7% (124/131)
4.3. COMPARING WITH FUNCTION-BASED PROFILING 17
The reason why 2 sets of the machine have the same results is that kernel part in all benchmarks either runs much faster on GPU, or get even slower on GPU. So speedup between 2 sets of machine might be different, but if one set of machine has speedup more than 2, the other set also does ,and vice versa.
Although 94 percent accuracy is still room for improvement, it shows that the pro- gram phase can be a better unit of profiling than the whole program.
4.3 Comparing with Function-Based Profiling
In this section, we want to show that comparing with pure function based profiling tools like Gprof, our tool is less affected by code structure of the program.
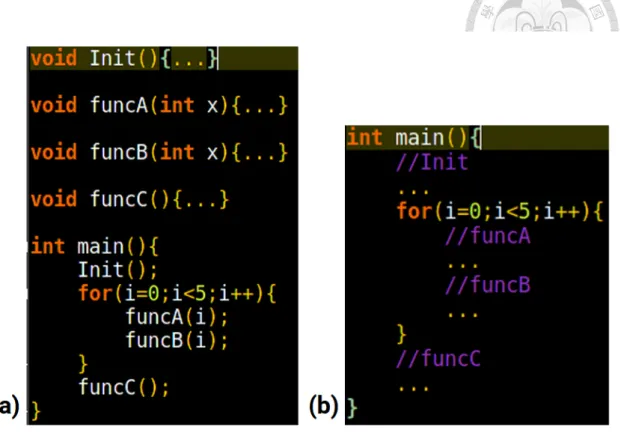
Figure 4.1 shows two pseudo code file with different structures. Part (a) is a well- refactored program, each behavior was allocated into the different function, while part (b) have the exact same behavior as part (a), but stuffed all codes into the main function. This is a common scenario that we have a fat function like (b), and doing code refactoring finally turns into (a).
In a user point of view, we expect the profiling tool is able to tell behavior A, B and C apart, even though they are all stuffed in one function. However, with function based profiling like GProf, we get result of each function in part (a), while only get profiling results for the main function in part (b).
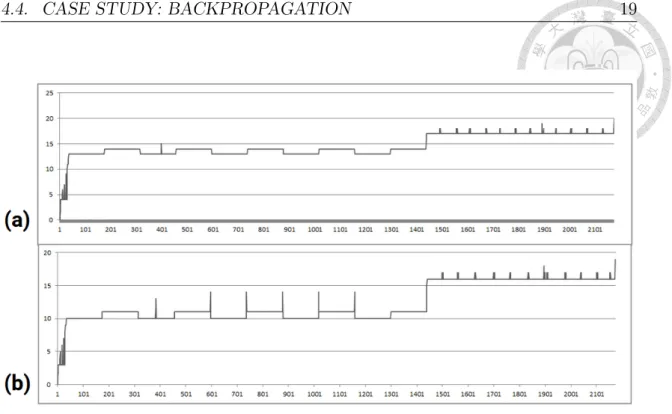
Window-Phase graph after running these two programs on out tool are in figure 4.2. There are slight differences between (a) and (b), but overall they have the same pattern. After we put some color on these two graphs, we have figure 4.3. We can
18 CHAPTER 4. EVALUATION
Figure 4.1: Two different code structure with the same program behavior.
conclude that although two programs have different code structure, our tool is not affected by the differences and still able to tell behavior A, B and C apart.
4.4 Case Study: Backpropagation
Backpropagation (backward propagation of errors) is a common method of training artificial neural networks used in conjunction with an optimization method such as gradient descent. [19]
Backpropagation is one of the Rodinia benchmarks, we take this program as an ex- ample showing how this tool helps the user understand its behavior. First of all, we
4.4. CASE STUDY: BACKPROPAGATION 19
Figure 4.2: Window-Phase graph running two program in Figure 4.1.
Figure 4.3: Add same color for the same program phase.
20 CHAPTER 4. EVALUATION
take a look at the Window-Phase graph of this program in figure 4.4, the program execution can view as 6 stages, each of which maps to different phases. Take stage 2 for example, phase 30 and 33 are repeated around 4000 times. For each phase, we can check its correspond code file, and profiling results are written in the log file.
Figure 4.5 shows contents of code file of phase 30, the number shown before each line of code means average execution count per window in this program phase. Also, we can check its profiling results and GPU friendliness of phase 30 in figure 4.6.
Figure 4.4: Program execution flow can viewed as 6 stages.
4.5. CASE STUDY: MCML 21
Figure 4.5: Code file content of phase 30.
4.5 Case Study: MCML
Monte Carlo modeling of light transport in multi-layered tissues (MCML) [18] simu- lates radiation therapy based on simulating behavior of each photon passing through multi-layered tissues. The program contains over 2500 lines of code, which is con- sidered hard to trace line by line.
Figure 4.7 shows window-phase graph of MCML program, we can view the graph as 2 stages (figure 4.8). The first stage contains around 12310 windows, and we found that all these phases are running codes in figure 4.9, which helps us quickly look into function HopDropSpin.
The function HopDropSpin, from figure 4.10, mainly calls function HopDropSpin-
22 CHAPTER 4. EVALUATION
Figure 4.6: Profiling information of phase 30.
InTissue, in which we discover 11 out of 145 photons hit boundary. That means an average of 7.5% photons probabilistic hit boundary, not all photons go to else first then hit boundary at the same time. Figure 4.11 shows stage 2 of this program mostly running code in file mcmlio.c, which dumps the execution result of program.
With our tool, the user can quickly find out core functions of the program, and their
4.6. CASE STUDY: KMP 23
execution order.
Figure 4.7: Window-Phase graph for MCML.
Figure 4.8: Window-Phase graph for MCML can view as 2 stages.
Figure 4.9: Running function HopDropSpin.
4.6 Case Study: KMP
In this last case study, we want to demonstrate that our tool is able to detect behav- ior changing inside a loop. KMP (Knuth-Morris-Pratt String Matching Algorithm)
24 CHAPTER 4. EVALUATION
Figure 4.10: Inside function HopDropSpin for stage 1 of MCML program.
Figure 4.11: Stage 2 of MCML program.
[20] searches for occurrences of a word within a main text string by employing the ob- servation that when a mismatch occurs, the word itself embodies sufficient informa- tion to determine where the next match could begin, thus bypassing re-examination of previously matched characters. We use this program from MachSuite benchmark [11].
Figure 4.12 shows profiling results of running KMP on Vtune. The user is able to know which function or which line of code runs the most CPU time, however, the importance of statement n matches[0] is not shown on this graph. Executing that
4.6. CASE STUDY: KMP 25
statement represents a substring is found in the main text string.
Then we run the same program with our tool, the results are shown in figure 4.13.
Figure 4.12: Profile KMP program using Vtune.
Although keep running the same loops inside the main body of KMP, two phases (37 and 38) are detected. So we checked the code file for these two phases (figure 4.14) and discover that phase 38 has a lot of successful matches, while phase 37 has
26 CHAPTER 4. EVALUATION
none. This case study shows that even for the same loop, behavior and performance can change during a program, and our phase-based tool can detect these changes.
Figure 4.13: Window-Phase graph running KMP with our tool, part b divide dif- ferent phases with colors.
4.6. CASE STUDY: KMP 27
Figure 4.14: Code files content of phase 37 and phase 38.
Chapter 5
Conclusion and Future Work
In this thesis, we show that program phases detection can not only be used on accelerating simulation of HPC programs, but also help user understand more about their program. Advantages of using program phase can be listed below:
• No preprocessing to the program.
• No static analysis on the program.
• Less affected by code structure of program.
• An hardware independent method on partitioning program.
We build up a phase-based profiling tool based on VPMU system, in which profil- ing information and corresponding code segment are provided for each phase. We reduce the size of window to improve the sensibility of phases. Window-phase in our work provides a new way for user understanding the execution flow of program.
28
5.1. FUTURE WORK 29
To verify the grouping effect of program phase detection on high level features, we implement a system using machine learning to predict GPU friendliness. The result of 94% accuracy shows that the program phase performs well on grouping of some high level features. Finally we demonstrate that phase-based profiling tool is less affected by code structure, and is able to detect different behaviors inside a loop structure.
5.1 Future Work
In the future, there are several perspectives to further improve this work:
• More high-level features or suggestions: Such as memory footstep, or some warning or suggestion based on the profiling information such as abnormal high CPI, CPU idle or so on.
• Support other program languages: Current version of our tool supports C and C++ language. Program in other languages are also able to run on our tool, but cannot map each phase back to code segment.
• More user friendly interface: Make the user easier to use this tool.
Bibliography
[1] Intel vtune performance analyzer. https://software.intel.com/en-us/
intel-vtune-amplifier-xe.
[2] I. Baldini, S. J. Fink, and E. Altman. Predicting gpu performance from cpu runs using machine learning. In Computer Architecture and High Performance Computing (SBAC-PAD), 2014 IEEE 26th International Symposium on, pages 254–261. IEEE, 2014.
[3] F. Bellard. Qemu, a fast and portable dynamic translator. In USENIX Annual Technical Conference, FREENIX Track, pages 41–46, 2005.
[4] S. Che, M. Boyer, J. Meng, D. Tarjan, J. W. Sheaffer, S.-H. Lee, and K. Skadron.
Rodinia: A benchmark suite for heterogeneous computing. In Workload Characteri- zation, 2009. IISWC 2009. IEEE International Symposium on, pages 44–54. IEEE, 2009.
[5] S. L. Graham, P. B. Kessler, and M. K. Mckusick. Gprof: A call graph execution profiler. In ACM Sigplan Notices, volume 17, pages 120–126. ACM, 1982.
[6] J. Lau, S. Schoemackers, and B. Calder. Structures for phase classification. In Performance Analysis of Systems and Software, 2004 IEEE International Symposium on-ISPASS, pages 57–67. IEEE, 2004.
[7] C.-K. Luk, R. Cohn, R. Muth, H. Patil, A. Klauser, G. Lowney, S. Wallace, V. J.
30
BIBLIOGRAPHY 31
Reddi, and K. Hazelwood. Pin: building customized program analysis tools with dynamic instrumentation. In ACM Sigplan Notices, volume 40, pages 190–200. ACM, 2005.
[8] Y. Luo, V. Packirisamy, W.-C. Hsu, A. Zhai, N. Mungre, and A. Tarkas. Dynamic performance tuning for speculative threads. In ACM SIGARCH Computer Architec- ture News, volume 37, pages 462–473. ACM, 2009.
[9] C. Olschanowsky, A. Snavely, M. R. Meswani, and L. Carrington. Pir: Pmac’s idiom recognizer. In 2010 39th International Conference on Parallel Processing Workshops, pages 189–196. IEEE, 2010.
[10] E. Perelman, G. Hamerly, and B. Calder. Picking statistically valid and early sim- ulation points. In Parallel Architectures and Compilation Techniques, 2003. PACT 2003. Proceedings. 12th International Conference on, pages 244–255. IEEE, 2003.
[11] B. Reagen, R. Adolf, Y. S. Shao, G.-Y. Wei, and D. Brooks. Machsuite: Benchmarks for accelerator design and customized architectures. In Workload Characterization (IISWC), 2014 IEEE International Symposium on, pages 110–119. IEEE, 2014.
[12] Y. Sato, Y. Inoguchi, and T. Nakamura. On-the-fly detection of precise loop nests across procedures on a dynamic binary translation system. In Proceedings of the 8th ACM International Conference on Computing Frontiers, page 25. ACM, 2011.
[13] A. Sembrant, D. Eklov, and E. Hagersten. Efficient software-based online phase clas- sification. In Workload Characterization (IISWC), 2011 IEEE International Sympo- sium on, pages 104–115. IEEE, 2011.
[14] T. Sherwood, E. Perelman, G. Hamerly, and B. Calder. Automatically characterizing large scale program behavior. In ACM SIGARCH Computer Architecture News, volume 30, pages 45–57. ACM, 2002.
[15] T. Sherwood, S. Sair, and B. Calder. Phase tracking and prediction. In ACM SIGARCH Computer Architecture News, volume 31, pages 336–349. ACM, 2003.
[16] T. Sondag and H. Rajan. Phase-guided thread-to-core assignment for improved uti- lization of performance-asymmetric multi-core processors. In Proceedings of the 2009 ICSE Workshop on Multicore Software Engineering, pages 73–80. IEEE Computer Society, 2009.
[17] C.-H. Tu, H.-H. Hsu, J.-H. Chen, C.-H. Chen, and S.-H. Hung. Performance and power profiling for emulated android systems. ACM Transactions on Design Au- tomation of Electronic Systems (TODAES), 19(2):10, 2014.
[18] L. Wang, S. L. Jacques, and L. Zheng. Mcml—monte carlo modeling of light transport in multi-layered tissues. Computer methods and programs in biomedicine, 47(2):131–
146, 1995.
[19] Wikipedia. Backpropagation — wikipedia, the free encyclopedia, 2016. [Online;
accessed 2-August-2016].
[20] Wikipedia. Knuth–morris–pratt algorithm — wikipedia, the free encyclopedia, 2016. [Online; accessed 3-August-2016].
32
![Figure 3.3: Error rate of simulating multiple simpoint is low. [15]](https://thumb-ap.123doks.com/thumbv2/9libinfo/9605402.631467/23.892.120.785.106.438/figure-error-rate-simulating-multiple-simpoint-low.webp)