Human Sensing Using Visible Light Communication
Tianxing Li, Chuankai An, Zhao Tian, Andrew T. Campbell, and Xia Zhou
Department of Computer Science, Dartmouth College, Hanover, NH {tianxing, chuankai, tianzhao, campbell, xia}@cs.dartmouth.edu
ABSTRACT
We present LiSense, the first-of-its-kindsystem that enables both data communication andfine-grained, real-time humanskeleton re- constructionusing Visible Light Communication (VLC). LiSense uses shadows created by the human body from blocked light and reconstructs 3D human skeleton postures in real time. We over- come two key challenges to realize shadow-based human sensing.
First, multiple lights on the ceiling lead to diminished and complex shadow patterns on the floor. We design light beacons enabled by VLC to separate light rays from different light sources and recover the shadow pattern cast by each individual light. Second, we design an efficient inference algorithm to reconstruct user postures using 2D shadow information with a limited resolution collected by pho- todiodes embedded in the floor. We build a 3 m × 3 m LiSense testbed using off-the-shelf LEDs and photodiodes. Experiments show that LiSensereconstructsthe 3D user skeleton at 60 Hz in real time with10◦mean angular errorfor five body joints.
Categories and Subject Descriptors
C.2.1 [Network Architecture and Design]: Wireless communica- tion
Keywords
Visible light communication; sensing; skeleton reconstruction
1. INTRODUCTION
Light plays a multifaceted role (e.g., illumination, energy source) in our life. Advances on Visible Light Communication (VLC) [30, 59] add a new dimension to the list: data communication. VLC encodes data into light intensity changes at a high frequency im- perceptible to human eyes. Unlike conventional RF radio systems that require complex signal processing, VLC uses low-cost, energy- efficient Light Emitting Diodes (LEDs) to transmit data. Any de- vices equipped with light sensors (photodiodes) can recover data by monitoring light changes. VLC has a number of appealing proper- ties. It reuses existing lighting infrastructure, operates on an un- regulated spectrum band with bandwidth 10K times greater than
Permission to make digital or hard copies of all or part of this work for personal or classroom use is granted without fee provided that copies are not made or distributed for profit or commercial advantage and that copies bear this notice and the full cita- tion on the first page. Copyrights for components of this work owned by others than ACM must be honored. Abstracting with credit is permitted. To copy otherwise, or re- publish, to post on servers or to redistribute to lists, requires prior specific permission and/or a fee. Request permissions from [email protected].
MobiCom’15,September 7–11, 2015, Paris, France.
c 2015 ACM. ISBN 978-1-4503-3619-2/15/09 ...$15.00.
DOI: http://dx.doi.org/10.1145/2789168.2790110.
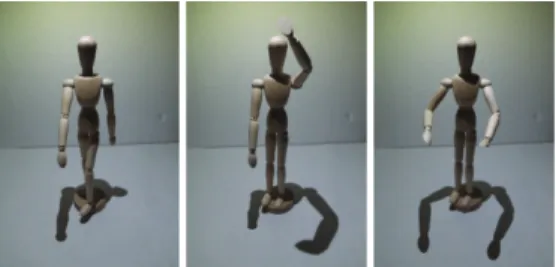
Figure 1: Shadow cast by varying manikin postures under an LED light (CREE XM-L). In this scaled-down table-top testbed, the manikin is 33 cm in height, and the LED light is 22 cm above the manikin.
the RF spectrum, and importantly, is secure (i.e., does not pene- trate walls, resisting eavesdropping), energy-efficient, and free of electromagnetic interference.
In this paper, we push the envelope further and ask: Can light turn into a ubiquitous sensing medium that tracks what we do and senses how we behave?Envision a smart space (e.g., home, office, gym) that takes the advantage of the ubiquity of light as a medium that integrates data communication and human sensing [71]. Smart devices (e.g., smart glasses, smart watches, smartphones) equipped with photodiodes communicate using VLC. More importantly, light also serves as a passive sensing medium. Users can continuously gesture and interact with appliances and objects in a room (e.g., a wall mounted display, computers, doors, windows, coffee ma- chine), similar to using the Kinect [57] or Wii in front of a TV, but there are no cameras (high-fidelity sensors with privacy concerns) monitoring users, neither any on-body devices or sensors that users have to constantly wear or carry [27, 62], just LED lights on the ceiling and photodiodes on the floor.
The key idea driving light sensing is strikingly simple: shadows.
Any opaque object (e.g., human body) obstructs a light beam, re- sulting in a silhouette behind the object. Because the wavelength of visible light is measured in nanometers, any macroscopic object can completely block the light beam, much more significant than the radio frequencies [16, 50, 65, 70]. The shadow cast on the floor is essentially a two-dimensional projection of the 3D object. As the object moves and changes its shape, different light beams are blocked and the projected shadow changes at light speed – the same principle as the shadow puppet. Thus, by analyzing a continuous stream of shadows cast on the floor, we can infer a user’s posture and track her behavior. As a simple illustration, Figure 1 shows the shadow shapes for varying manikin postures under a single light.
We present LiSense, the first-of-its-kind system that enables fine- grained, real-time userskeleton reconstruction1 at a high frame rate (60 Hz)using visible light communication. LiSense consists
1We define skeleton reconstruction as calculating the vectors of the skeleton body segments in the 3D space.
of VLC-enabled LED lights on the ceiling and low-cost photodi- odes on the floor.2 LiSense aggregates the light intensity data from photodiodes, recovers the shadow cast by individual LED light, and continuouslyreconstructs a user’s skeleton posturein real time.
LiSense’s ability of performing 3D skeleton reconstruction in real time puts little constraints on the range of gestures and behaviors that LiSense can sense, which sets a key departure from existing work that either targets a limited set of gestures [3, 17, 46] or only tracks user’s 2D movements [2, 4, 10]. More importantly, by inte- grating both data communication and human sensing into the ubiq- uitous light, LiSense also fundamentally differs from vision-based skeleton tracking systems (e.g., Kinect) that are built solely for the sensing purpose. In addition, these systems rely on cameras to cap- ture high-resolution video frames, which bring privacy concerns as the raw camera data can be leaked to the adversary [52, 64]. While prior vision methods [55, 56] have leveraged shadow to infer hu- man gestures, they work strictly under a single light source and do not apply in a natural indoor setting with multiple light sources.
LiSense overcomes two key challenges to realize shadow-based light sensing: 1) Shadow Acquisition: Acquiring shadows using low-cost photodiodes is challenging in practice. In the presence of multiple light sources, light rays from different directions cast a di- luted composite shadow, which is more complex than a shadow cast by a single light source. A shadow can also be greatly influenced by ambient light (e.g., sunlight). Both factors limit the ability of photodiodes detecting the light intensity drop inside a shadow. To address this challenge, LiSense leverages the fact that each light is an active transmitter using VLC and designs light beacons to sepa- rate light rays from individual LEDs and ambient light. Each LED emits light beacons by transmitting (i.e., flashing) at a unique fre- quency. LiSense transforms the light intensity perceived by each photodiode over time to the frequency domain. By monitoring fre- quency power changes, LiSense detects whether the photodiode is suddenly blocked from an LED and aggregates the detection results from all photodiodes to recover the shadow map cast by each light.
2) Shadow-basedSkeleton Reconstruction: Shadow maps mea- sured by photodiodes are 2D projections with a limited resolution (constrained by the photodiode density). Such low-resolution, im- perfect shadow images pose significant challenges toreconstruct a user’s 3D skeleton. Existing computer vision algorithms [11, 19, 21, 24, 42, 66, 51] cannot be directly applied to this problem be- cause they all deal with video frames in a higher resolution and are often augmented with the depth information. LiSense overcomes this challenge by combining shadows cast by light sources in dif- ferent directions and infers the 3D vectors of key body segments that best match shadow maps. LiSense fine-tunes the inferences using a Kalman filter to take into account movement continuity and to further reducethe skeleton reconstructionerrors.
LiSense Testbed. We build a 3 m × 3 m LiSense testbed (Fig- ure 9), using five commercial LED lights, 324 low-cost, off-the- shelf photodiodes, 29 micro-controllers, and a server. We imple- ment light beacons by programming the micro-controllers that mod- ulate LEDs. We implement blockage detection and 3Dskeleton reconstructionalgorithms on the server, which generates a stream of shadow maps and continuously tracks user gestures. Therecon- structionresults are visualized in real time using an animated user skeleton(Figure 11). We test our system with 20 gesturesand seven users in diverse settings. Our key findings are as follows:
• LiSense reconstructs a user’s 3D skeleton with the average an- gular error of10◦for five key body joints;
2Engineering photodiodes on the floor sounds labor-intensive to- day, but it can be eased by smart fabric [1, 45] (see more in § 7).
• LiSense generates shadow maps in real time. It is able to produce shadow maps of all LEDs every 11.8 ms, reaching the same level of capturing video frames yet without using cameras;
• LiSense tracks user gestures in real time. It reconstructs the user skeleton within 16 ms based on five shadow maps, thus generat- ing 60 reconstructed postures, each of which consists of the 3D vectors of five key body segments. The reconstructed skeleton is displayed in real time (60 FPS), similar to playing a video at a high frame rate;
• LiSense is robust in diverse ambient light settings (morning, noon, and night) and users with different body sizes and shapes.
Contributions. We make the following contributions:
• We propose for the first time the concept of continuous user skeleton reconstructionbased on visible light communication, which enables light to be a medium for both communication and passive human sensing;
• We design algorithms to extract the shadow of each individual light source and reconstruct 3D human skeleton posture continu- ously using only a stream of low-resolution shadow information;
• We build the first testbed implementing real-time, human skele- ton reconstruction based on VLC, using off-the-shelf, low-cost LEDs, photodiodes, and micro-controllers in an indoor environ- ment;
• Using our testbed, we test our system with diverse gestures and demonstrate that it can reconstruct a user skeleton continuously in real time with small reconstruction angular errors.
Our work takes the first step to go beyond conventional radio spectrum and demonstrates the potential of using visible light spec- trum for both communication and fine-grained human sensing. We believe that with its unbounded bandwidth, light holds great poten- tial to mitigate the spectrum crunch crisis. By expanding the ap- plications VLC can enable, we hope that our work can trigger new radical thinkings on VLC applications. Our work examines the in- terplay between wireless networking, computer vision, and HCI, opening the gate to new paradigms of user interaction designs.
2. LIGHT SHADOW EFFECT
Shadow is a common phenomenon we observe everyday. It is easily recognizable under a single light source by unaided human eyes. Our goal is to understand whether off-the-shelf, low-cost pho- todiodes can reliably detect the light intensity drop in the shadow. If so, we can deploy them on the floor and aggregate their light inten- sity data to obtain the shadow cast by a human body. In this section, we first study the impact of a blocking object on light propagation using low-cost photodiodes. We then examine the challenges of shadow-based analysis in the presence of multiple lights.
2.1 Experiments on Blocking the Light
Consider a single photodiode on the floor, we hypothesize that if any opaque object stands in the direct path between the point light source and the photodiode, the photodiode will not be able to perceive any light coming from this point light source. Thus, the photodiode observes a light intensity drop compared to the case when there is no object blocking its direct path to the light source.
To confirm our hypothesis, we build a scaled-down table-top testbed (Figure 2) using commercial LED lights (CREE XM-L) and low-cost photodiodes (Honeywell SD3410-001). We set up a sin- gle LED chipset as the point light source at 55 cm height and place the photodiode directly below the light. By default we calibrate the photodiode’s location using a plumb bob to ensure 0◦of light’s in- cidence angle. The photodiode has 90◦field of vision (FoV), i.e., it
reflector
PD
(a) Default setup (left) and setup w/ reflector (right)
LED
PD
resistor
(b) LED and photodiode (PD) w/
Arduino boards
Figure 2:Experiment setup with an LED and a photodiode (a), both at- tached to micro-controllers (b).
0 200 400 600 800
0 50 100 150 200 250
Arduino readings
Light intensity(lux)
(a) Light intensity vs Arduino reading
0 100 200 300 400 500
20 40 60 80
Arduino readings
LED duty cycle (%) w/o blocking
w/ blocking Ambient light
(b) Light source light intensity
0 100 200 300 400 500
0.1 0.2 0.3 0.4 0.5
Arduino readings
Distance between blocking object and PD (m) w/o blocking
w/ blocking Ambient light
(c) Blocking object distance
0 100 200 300 400 500
0 10 20 30 40 50
Arduino readings
Light incident angle (degree) w/o blocking
w/ blocking Ambient light
(d) Incident angle
0 100 200 300 400 500
Morning Noon Night
Arduino readings
Ambient light (lux) w/o blocking
w/ blocking Ambient light
(e) Ambient light
0 100 200 300 400 500
None Clothes Paper Plastic Foam Tin
Arduino readings
Reflector material w/o blocking
w/ blocking Ambient light
(f) Multi-path
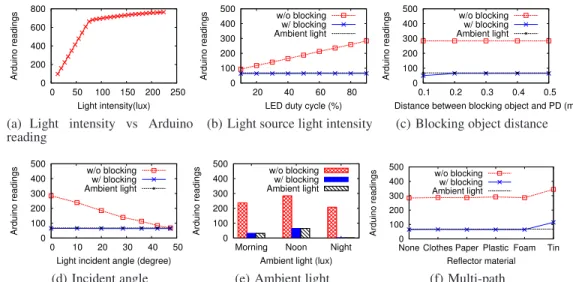
Figure 3:Experiments on blocking the light using our scaled-down table-top testbed. (a) shows that the mea- sured Arduino reading is directly proportional to the perceived light intensity, where the slope decreases after the photodiode enters its saturation range. (b)-(f) show the impact of blockage on the measured Arduino reading under varying settings.
can sense incoming light with incidence angle within 45◦. To fetch signal continuously from the photodiode, we cascade the photodi- ode and a resistor (10 KΩ) and measure the resistor voltage using a micro-controller (Arduino DUE in Figure 2(b)). It maps the mea- sured voltage to an integer between 0 and 1023. Since the photodi- ode’s output current is directly proportional to the perceived light intensity, resistor voltage (thus the Arduino reading) reflects the perceived light intensity. Using a light meter (EXTECH 401036) we have verified that the Arduino reading is directly proportional to the perceived light intensity (Figure 3(a)). To understand the im- pact of blockage, we place a 10 cm × 10 cm × 2 cm wood plate between the photodiode and the LED, and compare the Arduino readings before and after placing the wood plate3. We aim to an- swer the following key questions:
Q1: Is the shadow dependent on the light intensity of the light source? We first examine how the light source brightness affects the photodiode’s sensing data upon blockage. We connect the LED to an Arduino UNO board to vary the LED’s duty cycle from 10%
to 90% (Figure 2(b)), resulting in light intensities from 5 to 30 lux perceived by the photodiode. For a given duty cycle, we record the average Arduino reading before and after blocking the LED and plot the results in Figure 3(b). We observe that upon blockage, the Arduino’s reading reports only the ambient light in all duty cycle settings, meaning that an opaque object completely blocks the light rays regardless of the brightness of the light source.
Q2: Does the distance between the blocking object and the light source matter?Next, we test whether the relative distance between the blocking object and the light source affects the photodiode’s sensed light intensity. To do so, we fix the LED’s duty cycle to 90%, move the wood plate along the line between the LED and the photodiode, and record the Arduino data at each distance. Fig- ure 3(c) shows that as long as the object stays in the direct path between the LED and the photodiode, the light beam is completely blocked regardless of the relative distance of the blocking object.
Q3: How does the light incidence angle come into play? Be- cause a photodiode has a limited viewing angle and can perceive
3We also measured the blockage impact using different body parts (e.g., arms, hands) of a manikin and observed similar results.
incoming light only within its FoV, we further examine whether it can detect blockage under varying light incidence angles. We move the photodiode horizontally with 10-cm intervals and record the Arduino’s reading before and after blockage. As expected, the perceived light intensity gradually drops as the photodiode moves further away from the LED (Figure 3(d)). More importantly, at all locations (incidence angles), the light beam blockage result in a sig- nificant drop in the Arduino’s reading. The drop is less significant when the incidence angle approaches half of the photodiode’s FoV.
This is because the photodiode can barely sense any light coming at its FoV and thus blocking the light beam has a negligible impact.
Q4: What is the impact of ambient light? We also perform our measurements during different time of a day as the ambient light varies. In Figure 3(e), we plot the Arduino reading before and af- ter blockage as the ambient light intensity increases from 2 to100 lux. In all conditions, we observe a significant drop in the Arduino reading. Because the photodiode senses a combination of the am- bient light and the light from the LED, its perceived light intensity increases as the ambient light intensity increases.
Q5: How significant is the light multi-path effect? Would it di- minish the shadow? Visible light is diffusive in nature. While a object blocks the direct path between the photodiode and the LED, light rays can bounce off surrounding objects and reach the pho- todiode from multiple directions. Since the photodiode perceives a combination of light rays coming in all directions, this multi- path effect can potentially reduce the light intensity drop caused by blocking the direct path. To examine the impact of the multi- path effect, we place a flat board vertically close to the LED to increase the reflected light rays (Figure 2(a), right) and record the Arduino’s reading with and without blocking the direct path to the LED. Among all types of material we have tested, the significant drop in the Arduino’s reading is consistent (Figure 3(f)). Thus, light in the direct path dominates the perceived light intensity. The tin has the highest light intensity because of its minimal energy loss during reflection.
Overall, our experiment results confirm that opaque objects can effectively block light in diverse settings and the blockage can be detected by low-cost photodiodes under a single point light source.
(a) 2 LEDs (b) 3 LEDs (c) 4 LEDs (d) 5 LEDs (e) Setup w/ PD
0 200 400 600 800 1000
1 LED 2 LEDs 3 LEDs 4 LEDs 5 LEDs
Arduino readings
w/o blocking w/ blocking
(f) Sensed light intensity
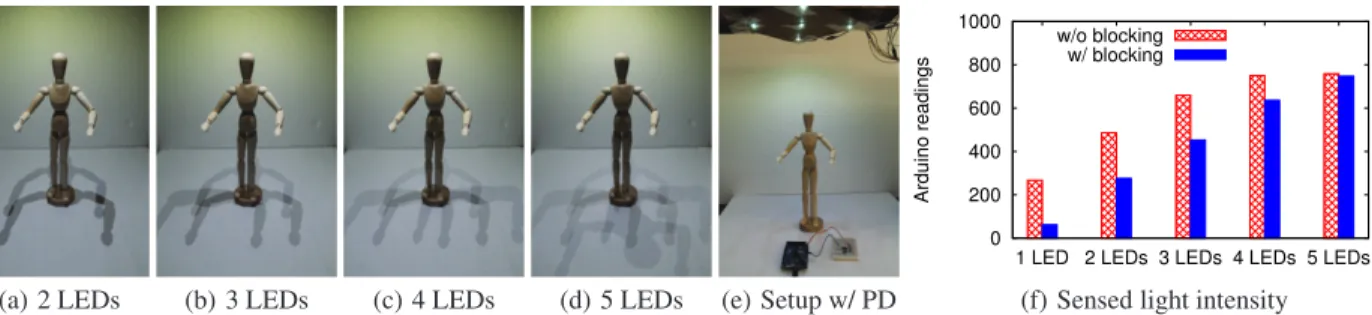
Figure 4:Shadow cast by multiple LEDs on the table-top testbed (a)-(d). We further measure the light intensity change caused by blockage using off-the-shelf photodiode (e). Light intensity drop caused by blockage is less significant under more LEDs (f).
2.2 Where is My Shadow?
Detecting a shadow is relatively straightforward under a single point light source. However, when there are multiple light sources present, shadow detection becomes much more challenging. This is because light rays from different sources result in a composite shadow, which comprises shadow components created and fused by multiple light sources. Figure 4 illustrates the resulting shadow of the manikin as we switch on more LED lights in our table-top testbed. We make two key observations. First, the shadow is grad- ually diluted as more LEDs are switched on. This is because there are more light rays coming from different directions, and hence blocking a beam from one LED does not necessarily block the light beams from other LEDs, leaving a fading shadow. Second, the shadow shape becomes more complex under more LEDs as a result of superimposing different shadows cast by individual LEDs.
As a result, it becomes harder to infer the manikin’s posture based upon the resulting tangled shape pattern.
While visually less noticeable, a shadow is also much harder to detect under these conditions using off-the-shelf photodiodes.
In our experiments, we place the photodiode in a shadow region caused by the manikin’s posture, gradually switch on more LEDs, and compare the Arduino’s reading with and without the manikin’s blockage (Figure 4(e)). We observe that as more LEDs are switched on, more light rays coming in different directions hit the shadow re- gion and thus the perceived light intensity level rises. Furthermore, once three or more LED lights are switched on, the photodiode enters the saturation region (Figure 3(a)), thus blocking light rays from a single LED has a negligible impact on the Arduino reading.
As a result, detecting shadow using these low-cost photodiodes is very challenging in practice under multiple lights.
In the next two sections, we introduce LiSense, which disam- biguates composite shadows using VLC and continuously tracks user posture in real time.
3. DISAMBIGUATING SHADOWS
To disambiguate composite shadows created by multiple lights, LiSense recovers the shadow shape, referred to as the shadow map, resulting from each individual light source. Specifically, the shadow map associated with light source Lk is the shadow if only light source Lkis present. We describe this as disambiguating a com- posite shadow. The key challenge is that each photodiode perceives a combination of light rays coming from different light sources and cannot separate light rays purely based on the perceived light inten- sity (Figure 5(a)(b)).
To overcome this technical barrier, we leverage the fact that each LED light is an active transmitter using VLC. We instrument each light source to emit a unique light beacon, implemented by modu- lating the light intensity changes at a given frequency. By assigning a different frequency to each light source, we enable photodiodes
to differentiate lights from different sources. This allows LiSense to recover the shadow cast by each individual light.
In this section, we first describe our design of light beacons, fol- lowed by the mechanism to detect blockage (shadow) and infer shadow maps.
3.1 Separating Light Using Light Beacons
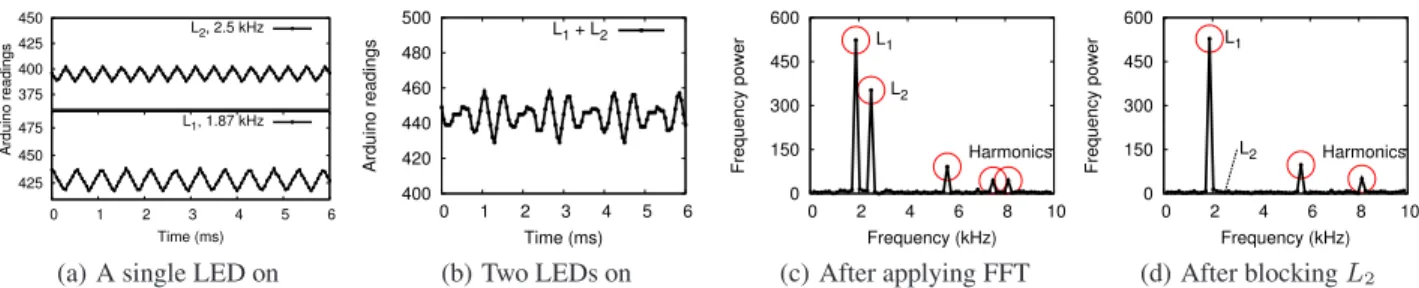
The design of light beacons is driven by the observation that while the perceived light intensity represents the sum of all incom- ing light rays, these light rays can be separated in the frequency do- main if they flash at different frequencies. That is, if we transform a time series of perceived light intensity to the frequency domain us- ing Fast Fourier Transform (FFT), we can observe frequency power peaks at the frequencies at which these light rays flash. Figure 5 shows an example with two LED lights flashing at 2.5 kHz and 1.87 kHz, respectively, in an unsynchronized manner. The light in- tensity perceived by the photodiode is a combination of these two light pulse waves, and yet FFT can decompose the light mixture and generate peaks at the two flashing frequencies. Thus, a light beacon can be implemented by programming each light source to flash at a unique frequency.
Benefits. Light beacons bring three key benefits when consid- ering blockage detection. First, by examining the resulting fre- quency power peaks after applying FFT, we can separate light rays from different light sources. The frequency power at frequency fi
is approximately directly proportional to the intensity of light rays flashing at fi. Thus, the changes in power peaks allow the photo- diode to determine which lights are blocked. Second, light beacons also allow us to avoid interference from ambient light sources by applying a high pass filter (HPF). This is because the change of am- bient light is random and generates frequency components close to zero in the frequency domain. Third, by separating light rays from different sources, we observe a much more significant drop in the frequency power caused by blocking a light, which is the key to achieving robust detection of blockage, especially when the photo- diode perceives a weak light intensity because of a long distance or a large incidence angle.
Light Beacon Frequency Selection. Designing robust light bea- cons, however, is nontrivial, mainly because selecting the flashing frequency for each light source is challenging. Specifically, assume an LED flashes as a pulse wave with a duty cycle of D and flashing frequency of f, the Fourier series expansion of this pulse wave is:
f (t) = D +
∞
X
n=1
2
nπsin(πnD) cos(2πnf t). (1) It indicates that the power emitted by the pulse wave is decomposed into the main frequency power, which is the first AC component when n = 1, and an infinite number of harmonics (components
425 450 475
0 1 2 3 4 5 6
Time (ms)
Arduino readings
L1, 1.87 kHz 375
400 425
450 L2, 2.5 kHz
(a) A single LED on
400 420 440 460 480 500
0 1 2 3 4 5 6
Arduino readings
Time (ms) L1 + L2
(b) Two LEDs on
0 150 300 450 600
0 2 4 6 8 10
Frequency power
Frequency (kHz) L1
L2
Harmonics
(c) After applying FFT
0 150 300 450 600
0 2 4 6 8 10
Frequency power
Frequency (kHz) L1
L2 Harmonics
(d) After blocking L2 Figure 5:Experiments with a photodiode (PD) and two LEDs (L1andL2, 50% duty cycle) that flash at different frequencies. (a)-(b) show the PD’s readings when only one LED is on and when both are on. PD perceives a combination of light rays, which however can be separated in the frequency domain after applying FFT (c). The frequency power of the flashing frequencyfireflects the perceived intensity of light rays flashing atfi. Thus the power peak at 2.5 kHz disappears afterL2is blocked (d).
Algorithm 1:Selecting the candidates of flashing frequency for light beacons.
input : 1) R, signal sampling rate; 2) A, the number of FFT points; 3) ff licker, the threshold to avoid flickering; 4) finterval, the minimal interval between adjacent flashing frequencies output: fcandidate, flashing frequency candidates for all LEDs fcandidate= {RA× ⌈ff lickerR ×A⌉}
fork← ⌈ff lickerR ×A⌉ + 1 toA2 do fk=RA× k
valid= true forfs∈ fcandidatedo
if(fs mod fk) == 0) OR (|fs− fk| ≤ finterval) then valid= false
break end
ifvalid then fcandidate← fk∪ fcandidate
end
with n > 1). Hence, an LED light Li flashing at frequency fi
leads to not only a global power peak (main frequency power) at frequency fi, but also small local power peaks at all the harmon- ics frequencies (Figure 5(c)). In other words, if the perceived light intensity from light Lichanges, it will affect not only the main fre- quency power at f, but also the power peaks at harmonics. To sepa- rate out the light rays and avoid interference across lights, we need to ensure that the harmonics do not overlap with the main frequen- cies of other lights. Tracking all harmonics is infeasible. In our design, we focus on the top-ten harmonics frequency components.
This is because the harmonics frequency power drops significantly as n increases. We observe it becomes negligible once n > 10.
Furthermore, the flashing frequencies need to satisfy three addi- tional constraints. First, since lights are also used for illumination, the flashing frequencies need to be above a threshold ff licker(1 kHz in our implementation) to avoid the flickering problem [32, 36, 48]. Second, the highest flashing frequency is limited by the sampling rate of the micro-controller fetching data from photodi- odes. The Nyquist Shannon sampling theorem [25] says that it has to be no larger than R/2, where R is sampling rate. Finally, the adjacent frequencies have to be at least fintervalaway to ensure robust detection of frequency power peaks. We set finterval = 200 Hz based on a prior study [32]. Algorithm 1 details the pro- cedure to select all candidate flashing frequencies satisfying all the above constraints.
We then assign the candidate flashing frequencies to all LED lights, such that the lights within each photodiode’s viewing an- gle (FoV) flash at different frequencies. Since photodiodes have a limited FoV (90 degrees for Honeywell SD3410-001), each photo-
diode perceives only a small subset of all lights. Thus we do not need a large number of candidate frequencies to cover all lights and the system can easily scale up to more lights. Supporting denser lights requires more candidate flashing frequencies, which can be achieved by increasing the signal sampling rate R.
Light Beacon Overhead. Light beacons can be seamlessly inte- grated into existing VLC systems, enabling light to fulfill a dual role of data communication and human sensing. For VLC sys- tems [5, 14, 36, 48] that use Frequency Shift Keying (FSK) to modulate data, all the data packets serve as light beacons, as long as LED lights within the FoV of a photodiode use different flash- ing frequencies to modulate data. For VLC systems that use other modulation schemes [34, 35], we can instrument each LED light to emit light beacons periodically, in the same way that Wi-Fi access points periodically transmit beacons. For an ADC sampling rate of 20 kHz and modulation window of 128 points, a light beacon lasting for 6.4 ms is sufficient for the photodiode to separate light rays. Thus, the overhead of transmitting light beacons is negligible given that a data packet typically lasts for hundreds of ms based on the IEEE 802.15.7 standard [8].
3.2 Blockage Detection
We detect blockage by transforming the time series of light in- tensity values of light beacons to the frequency domain and ex- amining the frequency power changes. Specifically, the intensity of light rays from light Liflashing at frequency fiis represented by the frequency power of fi. If an opaque object blocks the di- rect path from light Lito a photodiode, the frequency power of fi
changes (Figure 5(d)).
To examine the impact of blockage on the frequency power, we mount five commercial LED lights (Cree CXA25) on an office ceil- ing (2.65 m in height), attach them to an Arduino UNO board, which modulates the Pulse Width Modulation (PWM) of each light to allow each LED to emit light beacons at a given frequency (Ta- ble 1 by running Algorithm 1).We place photodiodes (Figure 2(b)) at 324 locations in a 3 m x 3 m area on the floor. Each photodiode can perceive light rays from all LED lights. We then measure the readings of the Ardunio controllers connected to the photodiodes for 6.4 ms before and after blocking each LED light.
Figure 6 shows the CDF of relative frequency power change.
Assume the Pij(t) is the frequency power of fi(the flashing fre- quency of the light beacons from light Li) at time t perceived by the photodiode at location pj, its relative frequency power change
∆Pij(t) is defined as:
∆Pij(t) = |PijnonBlock− Pij(t)
PijnonBlock |, (2)
0 0.2 0.4 0.6 0.8 1
0 4 8 12 16 20
CDF
Frequency power change (%) L3 L2 L4 L1 L5
(a) w/o blocking
0 0.2 0.4 0.6 0.8 1
70 75 80 85 90 95 100
CDF
Frequency power change (%) L1
L5 L4 L2 L3
(b) w/ blocking Figure 6: Relative frequency power changes in the non-blocking (a) and blocking state (b).
where PijnonBlock is the average of non-blocking frequency power from light Liat location pj. Clearly the frequency power change caused by blockage is much more significant (>70%) than that caused by the normal light intensity fluctuation4 (<20%) in non- blocking state. Therefore, using a threshold τ (60% in our imple- mentation) on the relative frequency power change can effectively detect the occurrence of blockage.
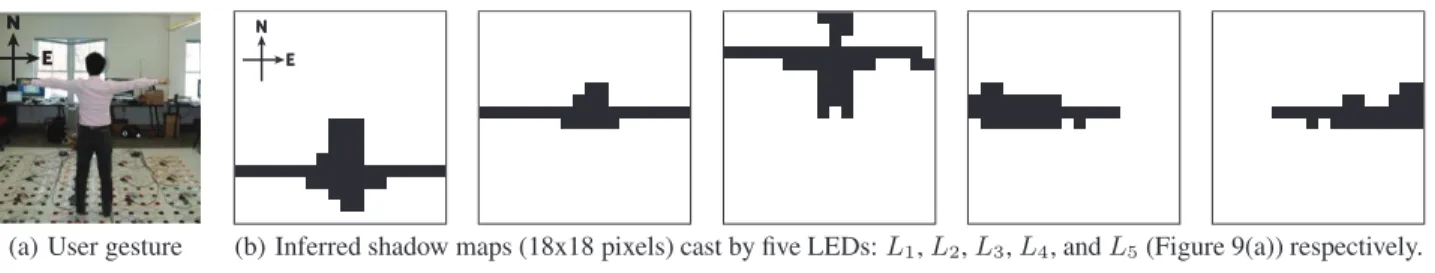
Shadow Map. By aggregating the blockage detection result from all photodiodes, we can recover the shadow map cast by each light Li. Specifically, assuming N photodiodes on the floor, which can sense K LED lights within their FoVs, we define the shadow map Si(t) cast by LED light Liat time t as: Si(t) = {sij(t)|0 < j ≤ N }, where sij(t) indicates whether the direct path from location pjto light Liis blocked at time t, i.e., sij(t) = 1 if ∆Pij(t) ≥ τ , and sij(t) = 0 otherwise. Figure 8 shows five example shadow maps obtained from our testbed (§ 5) for a given user posture (Fig- ure 8(a)). Since each shadow map is generated by blocking light rays from a different angle, the combination of the 2D shadow maps can be used to reconstruct the human skeleton in the 3D space.
4. FROM SHADOW MAPS TO POSTURE
Given the set of inferred shadow maps at time t, LiSense next reconstructs the user’s 3D skeletonat t, referred to as the user’s posture at time t. By continuously inferring the user’s posture over time, LiSense recovers the user’s gesture, which consists of a se- quence of postures. While computer vision literature has studied similar problems on 3D human motion reconstruction, we face two new challenges here. First, constrained by the limited photodiode density, shadow maps have limited resolution (18 × 18 pixels in our testbed), far below the resolution of video frames (at least 640
× 480 pixels [40]) used by existing vision techniques [11, 21, 24, 66]. Also shadow maps are imperfect and a small portion of pixels can suffer from blockage detection errors. Second, a shadow map is only a two-dimensional projection of the 3D object and lacks the depth information. As shown in our prior experiment (Figure 3(c)), the blockage at a single photodiode is independent of its relative distance to the blocking object. Existing vision techniques [24, 19, 51], however, are typically augmented by the depth input.
To address these challenges, we combine shadow maps cast by LEDs from different perspectives toreconstruct the user’s 3D skele- ton. Inspired by existing methods on skeleton-based motion cap- ture [20, 41, 58, 67], we design a shadow-based inference algo- rithm to compute the 3D vectors of the key user body segments. We also take into account the continuity of human movement and apply Kalman filter to iteratively fine-tune the current inference based on the prior inferred posture. Next we first describe the posture infer- ence algorithm, followed by the fine-tuning using Kalman filter.
4The light intensity fluctuation in the non-blocking state is at- tributed to the ADC errors at the Arduino board, the imperfect pulse waves generated by the LED, and the photodiode noise.
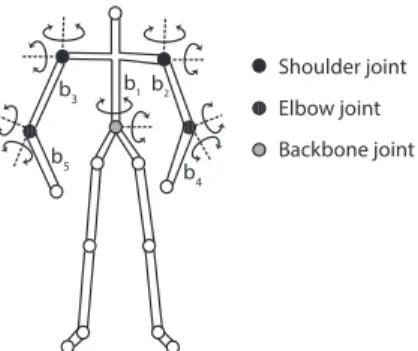
Shoulder joint Elbow joint Backbone joint b1
b5
b3 b2
b4
Figure 7: User skeleton model. We track key body segmentsbiby rotating the key body joints. Each joint has two degrees of freedom because of human body’s physical limit.
4.1 Inferring Posture based on Shadow
Our inference algorithm takes four inputs: 1) inferred shadow maps for all K LEDs (S1(t), ..., SK(t)) at time t, 2) 3D locations of all LED lights, 3) 3D locations of all N photodiodes, and 4) user’s body parameters (e.g., body height, body part size).The al- gorithm does not require any training to reconstruct the user skele- ton. It needs only initial calibration on user’s body parameters.
User Skeleton Model. We model the user using a standard hu- man skeleton model [20, 41, 58, 67] shown in Figure 7.We do not target specific pre-defined gestures and each body part can freely rotate under the physical constraints of the human body.We aim to reconstructthe set of 3D vectors B to represent M body segments, denoted by B = {bi|0 < i ≤ M }. In our implementation, we consider five body segments (M = 5): backbone, left and right upper arms, and left and right lower arms. We focus on upper-body segments because of the current testbed setting (see more in § 7).
The inference algorithm, however, is applicable for all body seg- ments. The movements of these body segments are controlled by the rotation of five key body joints: backbone joint, left and right shoulder joints, and left and right elbow joints, respectively. We assume that each key body joint has two degrees of freedom for its rotation (Figure 7) because of human body’s physical limit. Then the rotation of each body joint can be represented by the actual rota- tion angles in both degrees. We use coordinate conversion, denoted by gm(·), to transform a set of body joint rotation angles to the 3D vector of each body segment bm.
Shadow-based Inference. At the core, our inference algorithm aims to seek the optimal 3D vectors for body segments, so that the resulting human skeleton best matches the shadow map cast by each LED. Leveraging the shadow information, our inference is based on a simple fact: If a photodiode at location pjis blocked from LED Liat time t, i.e., sij(t) = 1 in shadow map Si(t), then the light ray lijfrom Lito pjis blocked by at least one user body segment, meaning that the minimal perpendicular distance between light ray lijto all body segments should be smaller than the radius riof the body part that the corresponding body segment birepre- sents. Therefore, we aggregate the blockage information from all shadow maps. We infer the optimal set of body segments B⋆as the body segments that lead to the minimal summation of perpendicu- lar distances between all blocked light rays and their closest body segments. In the meantime, the body segments should not block any light ray lixif photodiode pxis not blocked from LED Li, i.e., six(t) = 0. Thus we represent the optimization problem as below:
B⋆= argmin
B∈B′
X
sij (t)=1 i∈[1,K],j∈[1,N ]
bminm∈B(dist(lij, bm) − rm), (3)
N E
(a) User gesture
N E
(b) Inferred shadow maps (18x18 pixels) cast by five LEDs: L1, L2, L3, L4, and L5(Figure 9(a)) respectively.
Figure 8:Shadow maps obtained from LiSense testbed.
where dist(l1, l2) calculates the perpendicular distance between two line segments l1 and l2, and B′ contains the candidate 3D- vector set B satisfying the below constraint:
dist(lix, bm) > rm, ∀bm∈ B, if six(t) = 0, x ∈ [1, N ].
We iteratively optimize the objective function (Eq. (3)) for each body segment. The maximum number of iterations is 6 in our cur- rent implementation. Given the number of possible movements a body segment can make, the search space for the optimal B⋆is daunting. We speed up the search in two ways. First, instead of ex- amining all blocked photodiodes (shadow pixels), we check only the blocked photodiodes on the shadow boundary to reduce the number of blocked light rays needed to process. Second, we ap- ply a greedy algorithm to prioritize the search order based on the body part size. We first consider the movement of the largest body part, which is the backbone. To do so, we rotate the backbone joint and search the optimal rotation angles of this joint to match the shadow maps. We then move on to the upper arms by rotating the shoulder joints, and finally the lower arms by rotating the elbow joints. At each step, we apply a greedy algorithm to identify the optimal rotation angles of each joint. In the end, we aggregate the optimal rotation angles of each joint, and apply gm(·) to convert them to the optimal 3D vectors B⋆of body segments.
4.2 Fine-Tuning Posture Inference
We further fine-tune the inferred vectors of body segments B⋆, which can be affected by blockage detection errors (wrong shadow pixels) and the lack of information on body occlusion due to shadow map’s low resolution and photodiode’s limited viewing angle. The key idea is to leverage the prior inferred posture and smooth the inference result over time. A simple method is to average the rota- tion angle of each joint within a time window. However, determin- ing the time window size is non-trivial. We observe that the final performance suffers from non-Gaussian noise and occlusion from other body parts.
To overcome the above problems, we apply a Kalman filter to smooth body part movements over time given the movement conti- nuity. We model each body part movement as a stochastic process – it moves at a constant velocity with random perturbations in its trajectory. Let (xt, yt, zt) denote the 3D position of a body seg- ment’s end point at time t and dxt, dyt, dztis the velocity in each dimension respectively, we represent the process as:
xt
yt
zt
dxt
dyt
dzt
=
1 0 0 1 0 0
0 1 0 0 1 0
0 0 1 0 0 1
0 0 0 1 0 0
0 0 0 0 1 0
0 0 0 0 0 1
Physical constrain matrix
xt−1
yt−1
zt−1
dxt−1
dyt−1
dzt−1
+
nx
ny
nz
ndx
ndy
ndz
,
where nx, ny, nz are statistic variables representing the random perturbation in each dimension. Here the physical constraint ma- trix captures human body movement contiguity. The initial values
N E
L
1L
2L
3L
4L
5(a) LiSense overview
MOSFET
Arduino UNO
(b) LED control unit
PD Mini breadboard Arduino DUE
(c) 12 photodiodes + Arduino Figure 9:LiSense testbed.
Arduino UNO R1
R2 S
D G
37 V
(a) LED control circuit
R PDs
R 3.3V 3.3V
R 3.3V Arduino DUE
Control
Boards Arduino DUE
Server Data
Collector
(b) Circuit for photodiodes Figure 10:The circuit designs for the LED control unit and for con- necting photodiodes to micro-controllers.
of (xt, yt, zt) and dxt, dyt, dztare known, and nx, ny, nzare ini- tialized to zeros. The Kalman filter then iteratively fine-tunes the body part position (xt, yt, zt) and updates the statistic noise. We repeat the fine-tuning for each body segment. In the end, the fine- tuned body segments are visualized on the screen. By estimating the stochastic noise, Kalman filter further reduces the skeleton re- construction errors and smooths the visualization.
5. LiSense TESTBED
We build LiSense using five off-the-shelf LED lights (CREE CXA25), 324 low-cost (<$2 in wholesale) photodiodes (Honey- well SD3410-001) in a 3 m × 3 m area, 29 micro-controllers (Ar- duino UNO and DUE), and a server (DELL M4600) in a research lab setting (Figure 9), where the ceiling height is 2.65 m. Each LED chipset is equipped with a commercial LED lampshade (CREE T67) and adjacent LED lights are 0.8 m away.
LED Lights. We mount five LED lights on the ceiling. We con- nect all five LED lights to two Arduino UNO boards using five out-
Table 1:LED flashing frequency.
LED light L1 L2 L3 L4 L5
PWM frequency (kHz) 2.5 1.9 2.2 3.4 1.6
Figure 11: The visualized 3D skeleton reconstructed by LiSense for two example postures.
put pins and each output pin connects to a MOSFET driver module (Figure 10(a)). We fix the LED’s duty cycle to 50%. We imple- ment light beacons by programming the Arduino boards to mod- ulate the PWM frequency of each light. We run Algorithm 1 to select the flashing frequencies used by light beacons, assuming the ADC sampling rate of 20 kHz and 128-point FFT. Table 1 lists the frequency of each LED light’s light beacons. To support different PWM frequency for each light, we drive the LED lights using five independent 37 V DC power adapters.
Photodiodes. We select SD3410-001 photodiodes for two rea- sons. First, with the FoV of 90◦, all photodiodes in the 3 m × 3 m area can sense light rays from all LED lights that are 2.65 m in height. Second, with the rise time of 75 µs, they support the max- imal flashing frequency (3.4 kHz) of the LED lights. We cascade a photodiode and a resistor (10 KΩ) on a mini-breadboard (1.4" × 0.4" × 1.8" in size). Figure 10(b) shows the circuit design. The photodiodes are placed with a uniform interval of 16.7 cm. The resulting photodiode density is sufficient for the posture inference algorithm to track common gestures (e.g., hugging, pointing) with a good accuracy. Capturing finer-grained movements (e.g., finger movements) requires denser photodiodes. We will discuss it in § 7.
Micro-controllers. Each Arduino DUE micro-controller is con- nected to 12 photodiodes (mini-breadboards). It samples analog voltage numbers of the cascaded resistors on the mini-breadboards (Figure 10(b)) and maps the voltage numbers to integers within 0 and 1023. The Arduino DUE supports 300 kHz ADC sampling rate, sufficient for supporting 20 kHz sampling rate per photodi- ode. We implement Split-radix Real FFT algorithm [13] on the Ar- duino board, which processes the Arduino readings for each pho- todiode using 128 FFT points and computes the frequency power of the PWM frequencies used by the LED lights (Table 1). We se- lect Split-radix Real FFT algorithm because of its efficiency. Run- ning complex FFT subroutine on Arduino boards entails prohibitive overhead – it leads to 2x memory redundancy and wastes half of the processing power on the imaginary part of a complex number, which our input data does not contain.
The Arduino DUE board computes five frequency power num- bers (Table 1) for each photodiode, aggregates these numbers for 12 connected photodiodes, and sends them to the server. Each fre- quency power number is rescaled below 128 and represented by a byte. Thus an Arduino DUE sends 60 bytes to the server each time. We connect the 27 Arduino DUE boards to the server using extended USB cables via series 232 ports (115.2 Kbps data rate).
Server. To aggregate data from all Arduino boards, the server considers the first data packet from each Arduino board within a time window (16.7 ms). We implement the blockage detection mechanism (§ 3.2) and posture inference algorithm (§ 4) in C++ on
the server. These two algorithms are run in two separate threads in parallel so that a stream of shadow maps are produced continuously while theskeleton reconstructionthread infers the user posture for each set of concurrent (five) shadow maps. A separate visualiza- tion thread thendisplays the reconstruction results in real time by updating an animated user skeleton(Figure 11).
6. LiSense EXPERIMENTS
We conduct experiments using LiSense testbed, focusing on its skeleton reconstruction accuracy and latency for a wide range of gestures. We also seek to understand the inferred shadow maps ac- curacy and the impact ofpractical factors including ambient light, user diversity and clothing, as well as LiSense’s energy overhead.
Experimental Setup. We initialize LiSense system in two steps.
First, we measure the frequency power corresponding to the PWM frequency of each LED Li(Table 1) at each photodiode pjwhen no user stands in the testbed, i.e., PijnonBlockin Eq. (2). Second, we calibrate system parameters by instrumenting the user to stand in the middle of the testbed with arms drooping naturally. When the experiment starts, the user performs a free-form gesture for2–10 seconds. The server continuously fetches data from all Arduino DUE boards, generates shadow maps, infers user posture for each shadow map, records the 3D vector for each of the five key joints on a user body (backbone joint, left shoulder joint, right should joint, left elbow joint, and right elbow joint), and displays the re- sults as an animated user skeleton. As shadow maps come on the fly, the system continuously tracks user posture overtime and is able to generate 60 inference results per second. By default, all experi- ments are conducted at night in a typical indoor environment.
To obtain the ground truth of user postures, we set up three high- end SLR cameras (Cannon 60D) on tripods (1.2 m in height), lo- cated in the front and on the left and right sides of the user. While a user is performing a gesture, the three cameras capture video at 30 FPS from three perspectives. We then manually label the five key joints every five video frames5and calculate the 3D vector of each key point by combining concurrent video frames taken by three cameras. To identify concurrent video frames across cameras, we play a background music during the experiment and later seek the identical audio signal pattern across the video frames from differ- ent cameras. We cover a photodiode in the testbed corner before the experiment and remove the cover once each experiment begins. We mark the moment when the corner photodiode becomes unblocked as the starting point for both the video clips and testbed inference results. Human labeling has been the standard technique to seek ground truth in computer vision [26, 41]. In the future, we plan to use VICON to gain finer-grained accuracy.
6.1 Skeleton Reconstruction Accuracy
We first examine LiSense’s 3D skeleton reconstruction accuracy with a single user (1.73 m body height, 65 kg body weight, right- handed) performing 20 free-form gestures6. These gestures span from single-hand movements (e.g., pushing, pointing, circling, wav- ing), to two-hand movements (e.g., driving, hugging, boxing), to more sophisticated movements involving both user’s upper torso and hands (e.g., Combo1: raising and flipping arms, Combo2: point- ing and then circling). To examine the skeleton reconstruction ac- curacy, we represent each key joint as a 3D vector and calculate the
5To minimize human labeling errors, we attach flashy, bright strips to the user’s key joints during experiments so that they are easily recognizable in video frames.
6Current test gestures involve only upper-body movements to avoid accidentally damaging photodiodes on the floor. See more in § 7.
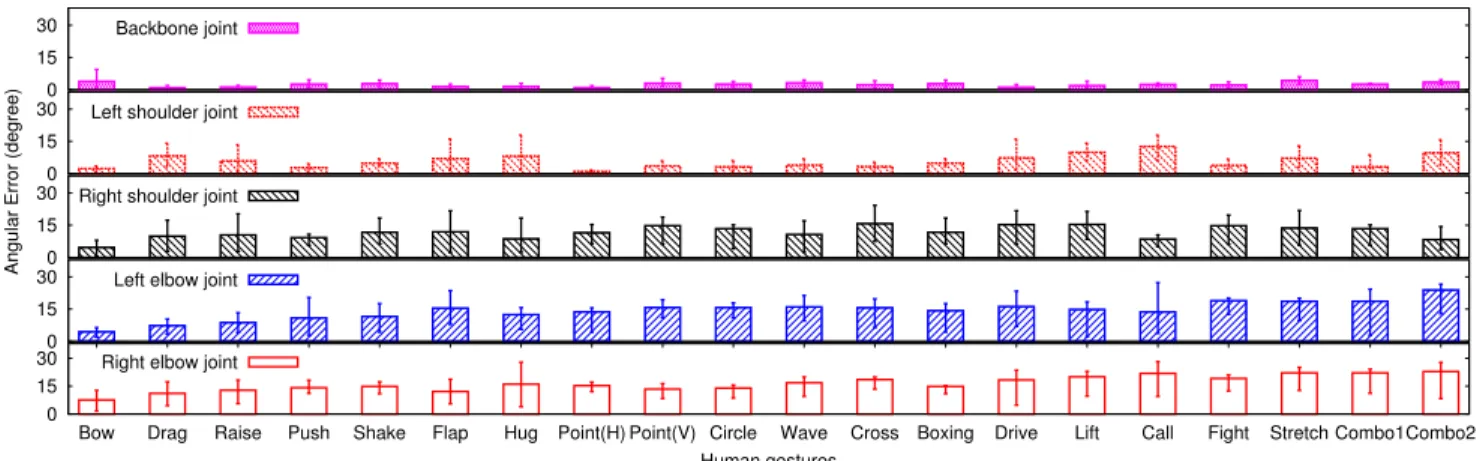
0 15 30
Bow Drag Raise Push Shake Flap Hug Point(H) Point(V) Circle Wave Cross Boxing Drive Lift Call Fight Stretch Combo1Combo2 Human gestures
Angular Error (degree)
Right elbow joint 0
15
30 Left elbow joint 0
15
30 Right shoulder joint 0
15
30 Left shoulder joint 0
15
30 Backbone joint
Figure 12:LiSense’s skeleton reconstruction accuracy of five key joints on a user body while the user is performing one of the 20 gestures.
0 0.2 0.4 0.6 0.8 1
0 5 10 15 20 25 30
CDF
Angular error (degree) Backbone Shoulder(L) Shoulder(R) Elbow(L) Elbow(R)
Figure 13: LiSense’s skeleton reconstruction accuracy of five key joints on a user body, by aggregating 9292 posture inference results over continuous stream of shadow maps generated by 20 user gestures.
absolute angular difference between the inferred and actual vectors for each key joint, referred to as the 3D angular error of a key joint.
This metric has also been widely used by prior work on human mo- tion tracking and skeleton reconstruction [2, 9, 31, 43].
Overall Accuracy. In Figure 12, we plot the mean angular er- ror of each key joint under each test gesture. We also include the error bars covering the 90% confidence interval. Figure 13 further compares the angular errors of the key body joints. Overall, for all gestures, LiSense achieves10◦mean angular error,similar to that of prior gesture tracking systems using RF signals [2, 3]. However, these systems only track a limited set of gestures (e.g., pointing) with a single body part (e.g., arm), while LiSense is capable of reconstructing arbitrary skeleton postures. We recognize that exist- ing vision-based skeleton tracking systems such as Kinect (6.8◦– 13.2◦angular errors reported in [15]) outperform LiSense in terms of the tracking accuracy. Built upon cameras and depth sensors, these systems are dedicated to skeleton reconstruction and track- ing, while LiSense integrates communication and sensing. We will discuss our plan to improve LiSense’s accuracy in § 7.
In particular, we observe three key factors that affect LiSense’s skeleton reconstruction accuracy under a given photodiode density:
1) Body part size: LiSense better tracks larger body parts (e.g., backbone joint that corresponds to the user’s main body). Because they generate larger shadow than other body parts, their move- ments lead to more significant differences in shadow maps, allow- ing our skeleton reconstruction algorithm to infer the 3D vectors more accurately(2◦mean angular error). In contrast, reconstruct- ing smaller body parts (e.g., forearms) is more challenging given the limited photodiode density(16◦mean angular error). For ges- tures such as calling, our collected shadow maps do not reflect the shadow change resulted from the forearm movement, because the width of forearm shadow is smaller than the interval between adja-
0 10 20 30 40
Backbone Shoulder(L) Shoulder(R) Elbow(L) Elbow(R)
Angular error (degree) 2.5°
3.7°
4.8° 6.4° 7.0°
w/ Kalman Filter w/o Kalman Filter
Figure 14: The contribution of the Kalman filter on improving LiSense’s reconstruction accuracy. The error bars cover the 90% con- fidence interval.
cent photodiodes. Therefore the resulting angular errors of shoul- der/elbow joints are slightly higher.
2) Movement magnitude: Gestures involving movements at a larger magnitude have smaller angular errors of all key joints, be- cause they lead to more significant change in the shadow maps and are less vulnerable to the occlusion problem. Example gestures include bowing, raising arms, pointing, and dragging. This find- ing is also exemplified by the results of single-hand gestures (e.g., pushing, pointing, circling). Certain gestures (e.g., stretching) with large movement magnitude have higher angular errors because the shadow exceeds the testbed boundary.
3) Movement speed: High-speed movement can lead to higher angular errors, because LiSense examines the change of the fre- quency power perceived by each photodiode in a modulation win- dow (6.4 ms). High-speed movement can result into a mixture of blocking and non-blocking states for a single photodiode within a modulation window, which leads to errors in inferred shadow maps and thus larger angular errors. For the same reason, the angular errors of left-side joints are smaller than the right joints for some two-hand gestures (e.g., boxing, fighting), since the right-handed user moves the left hand slightly more slowly. To track faster move- ments, we can improve the ADC sampling rate and reduce the mod- ulation window size.
Contribution of the Kalman Filter. We further examine the contribution of the Kalman filter (§ 4.2) on reducing the recon- struction error. We analyze all the shadow maps in the experiments and calculate the reconstruction angular error offline without using the Kalman filter for fine-tuning. Figure 14 shows that the fine- tuning reduces the angular error by up to 7 degrees, especially for body parts (e.g., right elbow) with relatively faster movements. The reason is that faster movements lead to more drastic change in the adjacent shadow maps in the time domain. As a result, the raw re- construction result of LiSense is more vulnerable to bursty errors.