行政院國家科學委員會專題研究計畫 成果報告
基於模糊理論之電子化公車停等策略於捷運轉乘系統之研 究
研究成果報告(精簡版)
計 畫 類 別 : 個別型
計 畫 編 號 : NSC 98-2410-H-011-025-
執 行 期 間 : 98 年 08 月 01 日至 99 年 07 月 31 日 執 行 單 位 : 國立臺灣科技大學工業管理系
計 畫 主 持 人 : 羅士哲
計畫參與人員: 碩士班研究生-兼任助理人員:何書瑋 碩士班研究生-兼任助理人員:賴諺霆 碩士班研究生-兼任助理人員:黃峻威 碩士班研究生-兼任助理人員:王朝慶
報 告 附 件 : 出席國際會議研究心得報告及發表論文
處 理 方 式 : 本計畫涉及專利或其他智慧財產權,2 年後可公開查詢
中 華 民 國 99 年 09 月 26 日
行政院國家科學委員會專題研究計畫 成果報告
具月台限制條件之電子化公車停等策略於捷運轉乘系統之研究 研究成果報告(精簡版)
計畫類別: 個別型
計畫編號: NSC98-2410-H-011-025
執行期間: 98 年 08 月 01 日至 99 年 07 月 31 日 執行單位: 國立臺灣科技大學工業管理系(所)
計畫主持人: 羅士哲
計畫參與人員:
碩士班兼任研究助理:何書瑋、賴諺霆、王朝慶、黃峻威
處理方式: 本計畫可公開查詢
中 華 民 國 99 年 9 月 26 日
行政院國家科學委員會補助專題研究計畫 ■ 成果報告
□ 期中進度報告
基於模糊理論之電子化公車停等策略於捷運轉乘系統之研究 Design of MRT Transfer System Based on Fuzzy Bus Holding Strategies
with Platform Constraints
計畫類別:■ 個別型計畫
計畫編號:NSC98-2410-H-011-025
執行期間: 98 年 8 月 1 日至 99 年 7 月 31 日 計畫主持人:羅士哲
成果報告類型(依經費核定清單規定繳交):■ 精簡報告
本成果報告包括以下應繳交之附件:
□赴國外出差或研習心得報告一份
□赴大陸地區出差或研習心得報告一份
■出席國際學術會議心得報告及發表之論文各一份
□國際合作研究計畫國外研究報告書一份
處理方式:本計畫可公開查詢
執行單位:國立臺灣科技大學工業管理系(所)
中 華 民 國 99 年 9 月 26 日
Design of Real-time Fuzzy Bus Holding System for the Mass Rapid Transit Transfer System*
Shih-Che Lo, Wei-Jie Chang Department of Industrial Management
National Taiwan University of Science and Technology
Abstract: In this research, we aim to design real-time fuzzy bus holding system (FBHS) for the Mass Rapid Transit (MRT) transfer system with real-time information for a terminal station with in a metropolitan area. We employ fuzzy logic to develop a model for the MRT-bus system to achieve the following goals pertaining to bus holding strategies used: to reduce the bus waiting time, to reduce the passenger waiting time, and to reduce passenger traveling time. In order to enhance the performance of the MRT-bus transfer system, we develop several fuzzy rules in the transfer models that are different functions of the travel time taken by buses during different time periods, such as rush hours and off-peak hours. Real-time traffic information acquired by the Intelligent Transportation Systems through Global Positioning Systems is used as input data for the FBHS. A performance index function is derived and served as the performance measure to compare our system with real data. The experimental results show that the FBHS significantly reduces the overall passenger waiting time and improves the performance of the MRT-bus transfer system.
Keywords: Transfer system; Bus holding system; Fuzzy logic; Intelligent transportation systems;
本研究將以大都會區域最重要之交通運輸體系,捷運系統與公車結合之大眾 運輸轉乘系統為研究目標。為了提高大眾運輸轉乘系統的效益,本研究將建構模 糊理論以考慮捷運與公車不同的進站時間間隔、不同車輛尖峰、離峰時刻的行駛 時間函數、以及公車月台等候線容量限制數等因素,提出模糊公車停等系統,研 究目的在於減少公車等待時間、轉乘乘客等候公車的時間、以及轉乘乘客的旅程 時間。本研究將建構模糊推論引擎作為主要研究工具,發展並評估捷運轉乘系統 的模型,在此轉乘模擬架構中,將利用智慧型運輸系統科技,以全球定位系統收 集公車即時動態資訊,作為模擬系統的輸入並加以分析,再針對現實環境所遭遇 到的問題,設計一完整之模糊公車停等系統,並根據效能指標,衡量轉乘系統中 模糊公車停等系統的效益。
關鍵詞:轉乘系統;公車停等策略;模糊邏輯;智慧型運輸系統。
* Paper submitted to the “Expert Systems with Application” journal on August, 2010.
1. INTRODUCTION
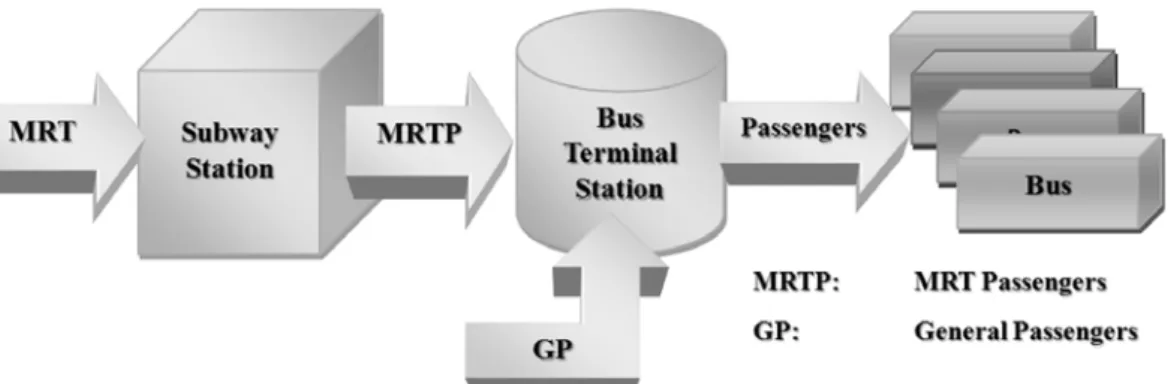
The Mass Rapid Transit (MRT) system is the most important transportation-related invention for use in modern metropolitan areas. This system usually relies on the subway system to provide a fast and convenient service to travelers in the downtown area. One of the supporting components of the MRT system is the bus system connecting end terminals that expands the service to the surrounding areas as shown in Fig. 1. In the United States of America and other continental countries, buses follow the existing schedule from station to station in order to cover the entire operation area and provide timely services. However, in most Asian countries, buses depart immediately after completing a passenger pick-up and drop-off at a bus stop. That is, there is no waiting time or time-table for the buses when they are at the stops. The same bus principle applies to all the bus terminals in the MRT system.
Fig. 1. The MRT-bus transfer system.
One of the key performance indicators for the service quality of the MRT system is reliability. The system needs continuous attention and endless improvement to maintain a proper service level for travelers; this involves tackling the issues related to control strategies for improving the reliability of transit services (Turnquist, 1978).
These control strategies are categorized as being either of the planning control, or of the real time control. Planning control strategies are long-term strategies and involve the restructuring of bus routes and schedules. Real-time control strategies are short-term control strategies and involve strategies for adding extra buses or short-turning (Turnquist & Blume, 1980).
Efficient real-time station control strategies can help maintain a smooth operation of the entire bus transport system and help reduce the impact of disturbances, such as accidents and vehicular break downs. Station control strategies includes holding
strategies, stop-skipping strategies, and short-turn strategies; they are the most popular strategies and are frequently used by public transit operators to reduce the passenger waiting time and prevent the clustering of vehicles along the route.
Holding strategies are used to delay bus movements deliberately when buses are ahead of their schedule. Stop-skipping strategies reduce the travel time of the vehicle of interest. They can also reduce the passenger waiting times on-board a vehicle for downstream stops. The short-turning strategy involves turning a vehicle around before it reaches the route terminals. This strategy is usually adopted when either the headway variance or the passenger waiting time for the route in the direction opposite to that of the bus needs to be reduced (Eberlein et al., 1998; Eberlein, Wilson &
Bernstein, 1999).
From the strategies discussed above, we mainly focus on holding strategies in this study because of their popularity among researchers working with public transit systems. Holding control strategies can be classified into two types. One type uses threshold-based control models to hold a bus at control stops for correction of the headways between consecutive buses. The other type uses mathematical programming models in which the holding times are used as decision variables and the passenger waiting time is used as a cost function that needs to be minimized.
Several studies have modeled threshold-based control strategies. One of the earliest studies was conducted by Osuna and Newell (1972), who presented an analytic method that determined the optimal holding strategy for a hypothetical route consisting of one stop with either one or two dvehicles and a uniform passenger arrival rate; this method was aimed at minimizing the average waiting time for passengers. Barnett (1974) developed a two-point, discrete, and approximate distribution of vehicle delay, with the intention of reducing the complexity of the problem of the minimization of passenger waiting time. Koffman (1978) developed a simulation model to analyze a one-way bus route. He tested several control strategies for buses in real-time. Abkowitz et al. (1984, 1986) developed an empirical headway deviation function aiming to minimize passenger waiting time along a route; the waiting times were estimated using a Monte Carlo simulation.
The design of computer-based real-time decision support system for public transit has been facilitated by the emergence of Intelligent Transportation Systems (ITSs), such as automatic vehicle location and Global Positioning Systems (GPSs), Mobile Data Terminals, and Electronic Fare boxes (Khattak et al., 1993; Hansen, Qureshi &
Rydzewski, 1994; Hickman & Day, 1996). GPSs are particularly useful for vehicle tracking and mobile data terminals may be used to count the number of passengers.
Eberlein et al. (1999) counted the first study on real-time routine control problems.
O’Dell and Wilson (1999) presented formulations for disruption control problems in
rail transit systems having more than one rail branch. Dessouky et al. (1999, 2003) compared control strategies that use information communicated by buses, tracking and passenger count, with those that use only locally available information. A bus arrival time prediction model that was more accurate for lines with long headways was developed. The simulation results showed that these methods were advantageous when the schedule slack was close to zero, the headway was large, and when there were several connecting buses. Zhao, Bukkapatnam and Dessouky (2003) presented a distributed control approach based on multi-agent negotiation, wherein stops and buses act as agents that communicate in real-time to achieve dynamic coordination for bus dispatching at various stops. Lo et al. (2009) also designed bus holding strategies for the MRT transfer system by using computer simulation to select optimal strategies.
It is undesirable rely solely on either objective knowledge (formulae and equations) or subjective knowledge (linguistic information) when solving real-life traffic and transportation problems. We must take into account the existence of linguistic information, i.e., subjective knowledge. Fuzzy logic is the most suitable approach for combining subjective knowledge with objective knowledge (TeodorovicÂ, 1999).
Fuzzy theory, which was first developed by Professor Zadeh (1965), introduces the concept of a fuzzy set. Researchers such as Zadeh (1973), and Mamdani and Assilian (1975) obtained the basic results linked to the development of fuzzy logic.
By introducing a concept he called “Approximate Reasoning,” Zadeh successfully showed that vague logical statements enable the formation of algorithms that can use vague data to derive vague inferences. Zadeh assumed that his approach would be especially beneficial in the study of complex humanistic systems. Upon realizing that Zadeh’s approach could be successfully applied to industrial plant controllers, Mamdani and Assilian (1975) applied it to control a pilot-scale steam engine. They used fuzzy logic to express linguistic rules. The fuzzy logic system is currently used in various areas, such as classifications (Chatterjee & Siarry, 2007; Chen & Tsai, 2008;
Li, Guo & Cheng, 2008; Chen & Shie, 2009; Fernandez, Jesus & Herrera, 2009 ), decision support systems (Kuo & Chen, 2004; Efendigil, Onut, & Kahraman, 2009), forecasting (Wang & Chen, 2008; Atsalakis & Valavanis, 2009), and risk analysis (Lee & Chen 2008; Chen & Wang, 2009; Chen & Chen, 2009a, 2009b).
Pappis and Mamdani (1977) published the first paper in which a practical traffic and transportation problem was solved using fuzzy logic. In the mid-1980s and late 1980s, a group of Japanese authors made a significant contribution to the fuzzy set theory used in applications involving traffic and transportation. Complex traffic and transportation problems were solved by Nakatsuyama, et al. (1983), Sugeno and
Nishida (1985) and particularly Sasaki and Akiyama (1986, 1987, 1988), indicating the great potential of the fuzzy set theory techniques in such applications. At the end of the 1980s and in the beginning of the 1990s, the fuzzy set theory for traffic and transportation started become used extensively at American universities. The pioneering work of the research team headed by Professor Shinya Kikuchi (Chakroborthy, 1990; Chakroborthy and Kikuchi, 1990; Perincherry, 1990;
Perincherry and Kikuchi, 1990; Teodorovic and Kikuchi, 1990, 1991; Kikuchi et al., 1991, 1993; Kikuchi, 1992) of the University of Delaware deserves special attention in this regard.
Different traffic and transportation problems that were successfully solved using fuzzy set theory techniques were presented in the studies conducted by Chen et al.
(1990), Tzeng and Teng (1993), Lotan and Koutsopoulos (1993a, 1993b), Xu and Chan (1993a, 1993b), Teodorovic and Babic (1993), Akiyama and Shao (1993), Chang and Shyu (1993), Akiyama amd Yamanishi (1993), Deb (1993), Nanda and Kikuchi (1993), Perkinson (1994), Hsiao et al. (1994), Vukadinovic and Teodorovic (1994), Teodorovic et al. (1994), Teodorovic (1994), Teodorovic and Kalic (1995), Milosavljevic et al. (1996), Teodorovic and Pavkovic (1996) and Tzeng et al. (1996), Song et al. (1997), Subbu, Sanderson, and Bonissone (1998) King, Radha, and Rughooputh (2004), Lotfi and Kashani (2004), and Lau et al.
(2009) .
This paper presents real-time fuzzy bus holding system (FBHSs) for the MRT transfer system with real-time information for a terminal station. We used the GPS data collected by the Taipei e-bus system to perform a statistical analysis, and utilized fuzzy logic to build a real-world MRT transfer model. We added functions with various fuzzy rules to the models; we also used different traveling time functions for the buses at different time periods in the transfer models to construct the proposed transfer models with holding strategies. Finally, we evaluated the performance of the holding system for transfer models by comparing the obtained passenger waiting time with real data.
The remainder of the paper is organized as follows. Section 2 outlines fuzzy rules and membership functions of the MRT-bus transfer system. Section 3 provides real-time fuzzy bus holding system with the experimental results obtained from fuzzy models. Section 4 offers conclusions.
2. DESIGN OF THE FHBS FOR THE MRTTRANSFER SYSTEM
This research focuses on a bus route of Kunyang Station, which is one of the most important transfer terminals of the MRT system in Taipei, Taiwan. The Blue 36 bus route was selected to provide a transferring service for travelers commuting from Taipei City to Taipei County. This bus route was covered by the Taipei e-bus system, which provided GPS signals from every bus operating along that route. Location data, such as longitude, latitude, and time of day, etc., were sent to the traffic management center (TMC) continuously and stored in a Microsoft SQL Server database. The database was acquired from the Department of Transportation, Taipei City Government.
The data to be input to the fuzzy models was obtained from the e-bus database and then analyzed and organized over a two-month time period. The database contained several data tables, such as BSTOP, BSTOP_XY, BUS, BUSLOG, BUS_ROUTE, and ROUTE, acquired from the Taipei e-bus system. The table BSTOP contained information about bus stations, such as the bus station IDs and the station names. The table BSTOP_XY contained information about bus routes, such as the operating company, the serviced area, and the longitude and latitude of the stations.
The table BUS stored the bus IDs, the license plate information, and route information.
The table BUSLOG was used to store the arrival and departure times for every stop.
The BUS_ROUTE table contained the order of the operation of the buses along every route. Finally, the ROUTE table stored route IDs and company IDs of privately owned buses.
Using the Query Analyzer of the Microsoft SQL Server, we first acquired all the information about the bus routes along the Blue 36 bus route, including the names of the bus station, the bus IDs, the orders of operation of buses along the route, the arrival and departure times, and the number of people boarding on the bus. We also collected the timetable for the MRT routes. We then fed the data into Excel
spreadsheets and used these data to perform further statistical analysis; this included the travel times between stops, the elapse times between two buses arrivals, and the elapse times between the bus and the MRT arrival times. After following these steps, we had to map these crisp data into fuzzy sets.
The objective of our FBHS model is to minimize the overall passenger waiting time.
The mathematical formulations for the FBHS are as follows:
Minimize overall passenger waiting time Z:
[
( )]
,1 1
∑∑
= =+ + +
= I
i J
j
ij ij ij ij
ij W BH TP M
P
Z (1)
subject to
, , , 3 2 for ), (
(0,1) a a 1 i , ...I rand
Wij = ∗ ij− i−,j = (C1)
⎩⎨
⎧
≠
=
= + −
, 0 if
0,
, 0 if
1 ,
ij ij ij
,j i
ij BH
BH a
M Fa (C2)
ij,
ij TP
P
C≥ + (C3)
,
TNOW+Hij ≤Fai+1,j (C4)
0.
variables
all ≥ (C5)
Constraint (C1) requires that the passenger waiting time (waiting time common to a set of passengers at a stop) must be less than or equal to the time interval between two runs. However, it is impossible to acquire the actual time of arrival of these passengers at the stop. Therefore, we use a random number in (0, 1) to estimate the common passenger waiting time (Wij). Constraint (C2) requires that the transfer passengers (passengers that need to change from the MRT to buses) must remain at a stop until the next bus arrives (Fai+1,j−aij) if the bus at that stop does not wait for them. If the bus waits until the transfer passengers arrive, the passengers do not have to wait for the next bus. However, this causes an increase in the waiting time for the non-transfer passengers (Hij). Constraint (C3) requires that the total passengers for bus i at stop j must be equal to or less than the bus capacity C. Constraint (C4) requires that the departure time of the ith bus must be earlier than the arrival time of the (i+1)th bus. In other word, the current time (TNOW) plus holding time must be less than or equal to the estimated arrival time of next bus. Constraint (C5) requires that the number of people and the passenger waiting time must be greater than or equal to zero.
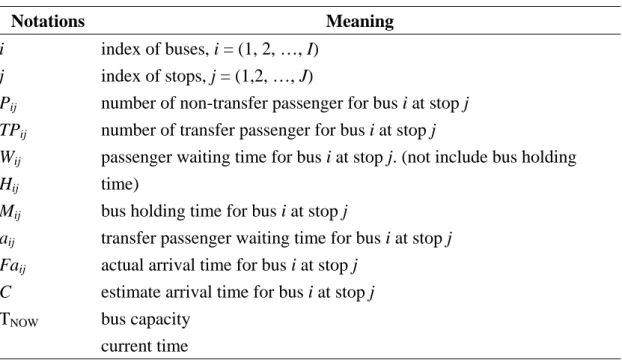
Table 1
List of notations.
Notations Meaning i
j Pij TPij Wij Hij Mij aij Faij C TNOW
index of buses, i = (1, 2, …, I) index of stops, j = (1,2, …, J)
number of non-transfer passenger for bus i at stop j number of transfer passenger for bus i at stop j
passenger waiting time for bus i at stop j. (not include bus holding time)
bus holding time for bus i at stop j
transfer passenger waiting time for bus i at stop j actual arrival time for bus i at stop j
estimate arrival time for bus i at stop j bus capacity
current time
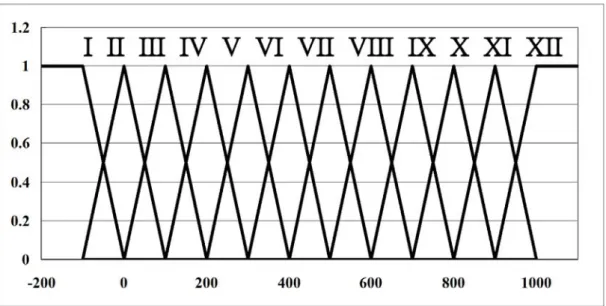
We use a fuzzy approach to determine the optimal bus holding time (Hij). In the transfer model, we defined two time interval sets, RUSH and OFF, which representing the rush hour and the off-peak hour, respectively; we also defined twelve elapse times that exist between the arrivals of buses from two bus arrival sets (I, II, …, XII), and ten elapse times that exists between the bus and the MRT arrival time sets (MR1, MR2, …, MR10). The inputs are converted to fuzzy variables as defined by fuzzy membership functions. These inputs are used to design the FBHS for our MRT-bus transfer model. All the classes of these inputs and their respective membership functions are shown in Figs. 2 – 4.
Fig. 2. The fuzzy membership functions for time of day.
Fig. 3. The fuzzy membership functions for twelve elapse times between two bus arrivals.
Fig. 4. The fuzzy membership functions for ten elapse times between bus and MRT arrivals.
The proposed FBHS rules were formulated from the statistical data analysis. These rules are listed in Table 2 and Table 3.
Table 2
Off-peak hour fuzzy rules.
OFF MR1 MR2 MR3 MR4 MR5 MR6 MR7 MR8 MR9 MR10
I N N N N N N N N N N
II N N N N N N N N N N
III VS VS N N N N N N N N
IV VS VS VS VS VS N N N N N
V VS VS VS VS VS VS VS VS N N
VI VS VS VS VS S S S S S S
VII VS VS VS S S S S S S S
VIII VS VS VS S S S M M M M
IX VS S S S M M M M M L
X VS S S S M M L L L L
XI VS S S M M L L L VL VL
XII S S S M M L L VL VL VL
Table 3
Rush hour fuzzy rules.
R MR1 MR2 MR3 MR4 MR5 MR6 MR7 MR8 MR9 MR10
I N N N N N N N N N N
II N N N N N N N N N N
III VS VS N N N N N N N N
IV VS VS VS VS VS N N N N N
V VS VS VS VS VS VS VS VS VS N
VI VS VS VS VS S S S S S S
VII VS VS S S S S S S S S
VIII VS S S S S S M M M M
IX VS S S S M M M M L L
X S S S M M M L L L VL
XI S S M M M L L VL VL VL
XII S S M M L L VL VL VL VL
where
N denotes do not stop;
VS denotes holding time is very short;
S denotes holding time is short;
M denotes holding time is medium;
L denotes holding time is long;
VL denotes holding time is very long.
These tables consist of a large number of rules in the following format:
IF TNOW is RUSH and ETBB is I and ETBM is MR1 THEN BH is N,
IF TNOW is OFF and ETBB is III and ETBM is MR2 THEN BH is VS,
IF TNOW is RUSH and ETBB is VI and ETBM is MR5 THEN BH is S,
IF TNOW is OFF and ETBB is VIII and ETBM is MR7 THEN BH is M,
IF TNOW is RUSH and ETBB is IX and ETBM is MR9 THEN BH is L,
IF TNOW is OFF and ETBB is XI and ETBM is MR10 THEN BH is VL.
where:
TNOW denotes current time;
ETBB denotes elapse times between two bus arrivals;
ETBM denotes elapse times between the bus and the MRT arrivals;
BH denotes bus holding time.
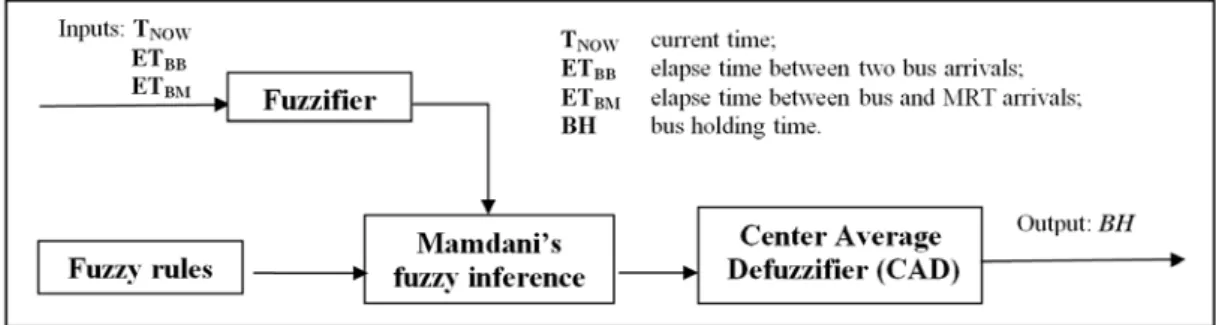
The computation of the numerical output values is based on Mamdani’s fuzzy inference method and the Center Average Defuzzifier (CAD) method. Mamdani’s method is the most commonly used method in engineering applications, because of its simple “min-max” operations. The CAD is the most commonly used defuzzifier in fuzzy systems. It is computationally simple and intuitively plausible. The detailed procedure for Mamdani’s method and the CAD method provided below.
Step 1. Evaluate the antecedent for each rule
We obtain the membership values for the given input values (crisp values). This process is called “input fuzzification.” If the antecedent of the rule has more than one part, a fuzzy operator (t-norm or s-norm) is used to obtain a single membership value.
In this study, we use a maximum/minimum approach to do the fuzzy operator (t-norm/s-norm). As shown in Equations (2) and (3).
s(ua, ub) = max[ua, ub]. (2)
t(ua, ub) = min[ua, ub]. (3)
where ua, ub are the membership values of a and b.
Step 2. Obtain the conclusion for each rule
Given the results of each rule (a fuzzy set) and the antecedent value obtained in step 1, we use a fuzzy implication operator to obtain a new fuzzy set. As shown in Equation (4).
( )
a,b u (l)(a,b)u = Ru , for l = 1, 2, …, M, (4)
where Ru1 stands for rule 1, Ru2 stands for rule 2, and uRu(l)(a,b)is the membership function for rule 1.
Step 3. Aggregate conclusions
In this step, we combine the conculsion obtained for each rule in step 2 (i.e., new fuzzy sets) into a single fuzzy set using a fuzzy aggregation operator. As shown in Equations (5) and (6).
.
U
lM1 (l)M Ru
Q
=
= (5)
).
( )
( )
(a,b,y u 1 a,b,y ... u a,b,y
u M
M Ru Ru
Q = ⊕ ⊕ (6)
where
Ru is the fuzzy rule, and all of the rules are interpreted as a single fuzzy relation QM. )
(a,b,y
uQM is the membership function; a and b are the inputs variables and y is the output variable of the fuzzy system. Also, “⊕” represents the s-norm operator.
Step 4. Defuzzification
To solve a decision problem, we need the output to be a number (crisp value) and not a fuzzy set. Therrefore, we need to transform the fuzzy set obtained in step 3 into a single numerical value. One of the most popular defuzzification methods is the CAD method. As shown in Equation (7).
,
1 1
∑
∑
=
= =M l
l l M
l l
*
w w y
y (7)
where y is the center of the lth fuzzy set and wl l is its height.
The procedure for the FBHSs is illustrated in Fig. 5.
Fig. 5. Procedure of the fuzzy bus holding system.
3. EXPERIMENTAL RESULTS
The bus holding time is the outputs obtained from the proposed FBHSs. We acquired real-time information from the Taipei e-bus system and MRT system. We then mapped these data into fuzzy sets according to the membership function designed by us. Next, we used fuzzy variables and rules for the fuzzy inference. Using the results of the inference, we mapped the output sets into crisp values (bus holding times).
Finally, using the output of the fuzzy inference engine, we converted the output fuzzy set back to a crisp value, i.e., the bus holding time. This marked the completion of the FBHS procedure.
The experimental results are shown in Table 4. Because the actual data table of the experimental results is too large to be included in this paper, only the results obtained for the first seven buses are presented in this section.
Table 4
Bus holding time. (Unit: second) ID
Day 1001 1002 1003 1004 1005 1006 1007
1 20.34 85.61 44.89 22.76 78.84 173.12 0.00
2 68.42 0.00 0.00 138.42 72.02 84.28 0.00
3 91.30 122.51 240.33 147.66 72.07 47.97 6.14 4 71.94 42.58 24.92 255.95 117.72 115.51 116.47 5 109.16 104.58 175.86 3.82 50.23 30.38 47.88 6 47.67 114.88 102.71 267.66 113.10 72.32 264.11 7 244.55 28.59 71.01 41.88 20.81 202.26 10.55 8 122.63 0.00 206.18 120.27 163.92 148.05 148.17 9 69.59 0.00 144.50 134.70 96.90 0.00 10.66 10 49.23 278.98 185.79 106.26 5.42 94.87 53.07
11 262.29 3.38 89.04 86.29 65.57 44.18 6.32
12 0.00 96.95 46.17 130.89 34.99 101.15 0.00 13 195.32 63.17 114.18 24.31 90.74 73.27 11.53 14 15.12 0.00 224.59 241.87 9.36 48.13 146.07 15 289.41 4.34 274.11 167.89 36.43 0.00 109.95 16 59.98 100.67 146.42 210.07 57.03 8.02 137.88 17 112.62 294.97 252.55 160.08 64.32 0.00 200.37 18 48.06 17.57 120.71 266.47 0.00 42.09 204.29 19 66.27 79.44 15.16 10.66 116.05 5.62 148.86 20 295.22 42.16 271.96 15.36 209.90 0.00 10.13
21 0.00 91.99 60.62 0.00 0.00 0.00 9.46
22 28.25 46.47 17.00 34.21 90.25 122.95 111.05 23 6.67 65.79 12.21 118.18 56.71 249.99 143.02 24 146.59 216.17 38.16 194.64 0.00 112.60 91.86
25 106.98 22.98 62.89 0.00 0.00 0.00 0.00
26 2.33 61.20 239.92 63.53 193.72 271.40 62.46
27 61.13 59.85 0.00 0.00 78.28 56.99 3.14
28 141.63 134.89 68.43 99.47 0.00 8.63 28.93 29 65.30 85.66 111.19 181.97 30.69 192.09 3.35 30 0.00 110.11 30.64 114.93 120.50 178.93 30.38
As shown in Table 4, we list the bus holding times for the duration of a month. A zero value implies that, as per the FBHS inference, the bus did not have to stop at that time.
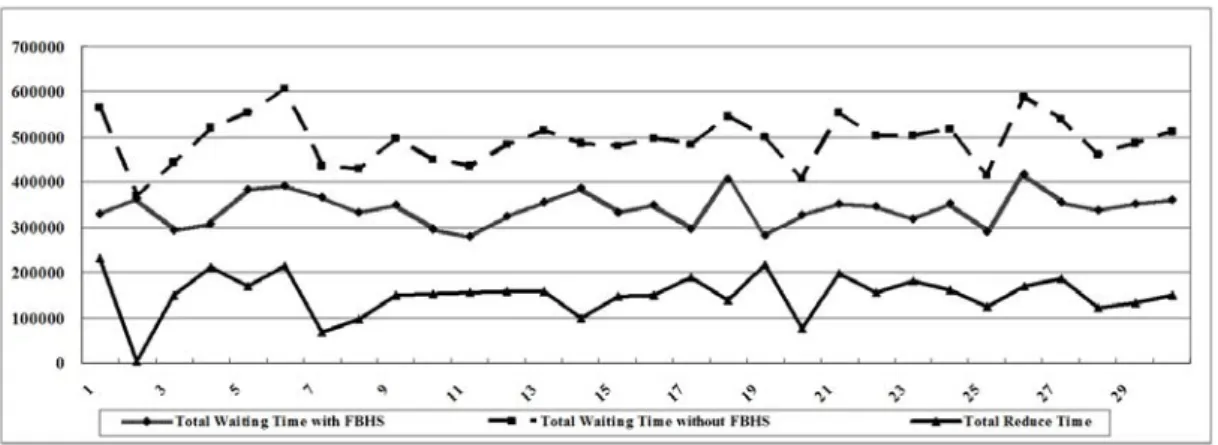
In the case that a bus was kept waiting at that time, the transfer passenger waiting time certainly must have reduced. However, at the same time, the original passenger waiting time must also have increased. In order to verify the results obtained from the FBHSs, we computed the total waiting time and compared it with real data. The results of this comparison are shown in Table 5 and Fig. 6.
Table 5
Bus holding time. (Unit: second) Total Waiting Time (with holding system)
Total Waiting Time (without holding system)
Total Reduce Time
Reduce Rate
1 331613.22 564453.80 232840.57 41.25%
2 365071.49 369242.17 4170.69 1.13%
3 293378.75 443111.16 149732.41 33.79%
4 307725.69 520127.60 212401.91 40.84%
5 383017.90 552009.79 168991.88 30.61%
6 391756.84 605994.89 214238.05 35.35%
7 366748.59 434760.57 68011.98 15.64%
8 333445.74 428119.13 94673.40 22.11%
9 349106.87 497779.14 148672.27 29.87%
10 296704.59 448611.20 151906.62 33.86%
11 280563.67 435189.07 154625.41 35.53%
12 323389.87 481816.54 158426.67 32.88%
13 354347.76 512762.87 158415.11 30.89%
14 385650.15 485434.07 99783.92 20.56%
15 332079.06 479441.02 147361.96 30.74%
16 349578.26 498050.28 148472.02 29.81%
17 295507.19 483664.75 188157.56 38.90%
18 406720.42 543749.61 137029.19 25.20%
19 281606.87 499666.72 218059.85 43.64%
20 328789.16 406096.27 77307.10 19.04%
21 353483.29 552272.64 198789.35 35.99%
22 347056.48 502958.84 155902.36 31.00%
23 319807.68 501841.14 182033.45 36.27%
24 353411.93 515251.38 161839.44 31.41%
25 290023.52 413550.96 123527.44 29.87%
26 418622.26 588042.17 169419.91 28.81%
27 354912.88 540409.60 185496.72 34.33%
28 338898.62 460132.80 121234.17 26.35%
29 351512.35 484789.29 133276.94 27.49%
30 361556.98 512209.19 150652.21 29.41%
Fig. 6. Result comparisons for the total waiting times with total reduce time.
The experiment results show that the overall passenger waiting time can be reduced by increasing original passenger waiting time by a small amount, to achieve acceptable overall system performance using ITS technologies.
4. CONCLUSIONS
In this paper, we have presented fuzzy bus holding system (FBHSs) for the Mass Rapid Transit (MRT) transfer system with real-time information in a terminal station in a metropolitan area. We employ fuzzy logic to develop a model for the MRT-bus system to achieve three goals: to reduce the bus waiting time, to reduce the passenger waiting time, and to reduce passenger traveling time. To design a fuzzy bus transfer model, we used the data obtained by the Taipei e-bus system via a global positioning system (GPS) to construct the MRT terminal operation for a bus route (Blue 36). The experimental results show that the FBHS significantly reduces the overall passenger waiting time and improves the performance of the MRT-bus transfer system.
Acknowledgment
This work was partially supported by the National Science Council (NSC), Taiwan, R.O.C. under Grant no. NSC98-2410-H-011-025. The authors thank Departmental of Transportation, Taipei City Government, for providing e-bus GPS database for study.
References
Abkowitz, M. D., & Engelstein, I. (1984). Methods for maintaining transit service regularity. Transportation Research Record, 961, 1–8.
Abkowitz, M. D., Eiger, A., & Engelstein, I. (1986). Optimal headway variation on transit routes. Journal of Advanced Transportation, 20(1), 73–88.
Akiyama, T., & Shao, C.-F. (1993). Fuzzy mathematical programming for traffic safety planning on an urban expressway. Transportation Planning and Technology, 17, 179–190.
Akiyama, T., & Yamanishi, H. (1993). Travel time information service device based on fuzzy sets theory. In: Ayyub, B.M. (Ed.). The proceedings of the second international symposium on uncertainty modeling and analysis. IEEE Computer Press (pp. 238–245). College Park, Maryland.
Atsalakis, G. S., Valavanis, K. P. (2009), Forecasting stock market short-term trends using a neuro-fuzzy based methodology. Expert Systems with Applications, 36, 10696–10707.
Barnett, A. I. (1978). On controlling randomness in transit operations. Transportation Science, 8(2), 101–116.
Chakroborthy, P., (1990). Application of fuzzy set theory to the analysis of capacity and level of service of highways. MSc. thesis, University of Delaware, Newark, DE.
Chakroborthy, P., & Kikuchi, S., (1990). Application of fuzzy set theory to the analysis of capacity and level of service of highways. In: Ayyub, B.M. (Ed.). The proceedings of the first international symposium on uncertainty modeling and analysis. IEEE Computer Press (pp. 146-150). College Park, Maryland.
Chang, Y.-H., & Shyu, T.-H., (1993). Traffic signal installation by the expert system using fuzzy set theory for inexactreasoning. Transportation Planning and Technology, 17, 191-202.
Chatterjee A., & Siarry, P. (2007). A PSO-aided neuro-fuzzy classifier employing linguistic hedge concepts. Expert Systems with Applications, 33, 1097–1109
Chen, L., May, A., & Auslander, D. (1990). Freeway ramp control using fuzzy set theory for inexact reasoning. Transportation Research, 24A, 15-25.
Chen, S.-M., & Tsai, F.-M. (2008). Generating fuzzy rules from training instances for fuzzy classification systems. Expert Systems with Applications, 35, 611–621.
Chen, S.-M., & Shie J.-D. (2009), Fuzzy classification systems based on fuzzy information gain measures. Expert Systems with Applications, 36, 4517–4522.
Chen, S.-M., & Wang, C.-H. (2009). Fuzzy risk analysis based on ranking fuzzy numbers using a-cuts, belief features and signal/noise ratios. Expert Systems with Applications, 36, 5576–5581.
Chen, S.-M., & Chen J.-H. (2009a). Fuzzy risk analysis based on similarity measures between interval-valued fuzzy numbers and interval-valued fuzzy number arithmetic operators. Expert Systems with Applications, 36, 6309–6317.
Chen, S.-M., & Chen J.-H. (2009b). Fuzzy risk analysis based on ranking generalized fuzzy numbers with different heights and different spreads. Expert Systems with Applications, 36, 6833–6842
Deb, S.K. (1993). Fuzzy set approach in mass transit mode choice. In: Ayyub, B.M.
(Ed.). The proceedings of the second international symposium on uncertainty modeling and analysis. IEEE Computer Press (pp. 262–268). College Park, Maryland.
Dessouky M., Hall, R., Nowroozi, A., & Mourikas, K. (1999). Bus dispatching at timed transfer transit stations using bus tracking technology. Transportation Research Part C: Emerging Technologies, 7(4), 187–208.
Dessouky M., Hall R., Zhang, L., & Singh, A. (2003). Real-time control of buses for schedule coordination at a terminal. Transportation Research Part A: Policy and Practice, 37(2), 145–164.
Eberlein, X. J., Wilson, M. H., Barnhart, M. C., & Bernstein, D. (1998). The real-time deadheading problem in transit operations control. Transportation Research Part B:
Methodological, 32(2), 77–100.
Eberlein, X. J., Wilson, N. H. M., & Bernstein, D. (1999). Modeling real-time control strategies in public transit operations. Lecture Note in Economics and Mathematical Systems: Computer Aided Transit Scheduling. Springer-Verlag, Berlin, Heidelberg, 471, 325–346.
Efendigil, T., Onut, S., & Kahraman C. (2009). A decision support system for demand forecasting with artificial neural networks and neuro-fuzzy models: A comparative analysis. Expert Systems with Applications, 36, 6697–6707.
Fernandez, A., Jesus, M.J., & Herrera, F. (2009). On the influence of an adaptive inference system in fuzzy rule based classification systems for imbalanced data-sets.
Expert Systems with Applications, 36, 9805–9812.
Hansen, M., Qureshi, M., & Rydzewski D. (1994). Improving Transit Performance with Advanced Public Transportation System Technologies. PATH Research Report, UCB-ITS-PRR-94-18.
Hickman, M., & Day T. (1996). An assessment of information systems and technologies at California Transit Agencies, Transportation Research Board, 1521, 49-57.
Hsiao, C.-H., Lin, C.-T., & Cassidy, M. (1994). Application of fuzzy logic and neural networks to automatically detect freeway traffic incidents. Journal of Transportation Engineering, 120, 753-772.
Khattak, A., Noeimi, H., Al-Deek H., & Hall, R. (1993). Advanced Public Transportation Systems: A Taxonomy and Commercial Availability. PATH Research Report, UCB-ITS-PRR-93-9.
Kikuchi, S. (1992). Scheduling demand-responsive transportation vehicles using fuzzy-set theory. Journal of Transportation Engineering, 118, 391-409.
Kikuchi, S., Perincherry, V., Chakroborthy, P., & Takahashi, H. (1993). Modeling of driver anxiety during signal change intervals. Transportation Research Record, 1399, 27-35.
King, R. T. F. A., Radha, B., & Rughooputh, H. C. S. (2004). A fuzzy logic controlled genetic algorithm for optimal electrical distribution network reconfiguration. In Proceedings of the 2004 IEEE international conference on networking, sensing and control, (pp.577–582). Taipei, Taiwan.
Koffman, D. (1978). A simulation study of alternative real-time bus headway control strategies. Transportation Research Record, 663, 41–46.
Kuo, R.-J., & Chen, J. A. (2004). A decision support system for order selection in electronic commerce based on fuzzy neural network supported by real-coded genetic algorithm. Expert Systems with Applications, 26, 141–154.
Lau, H. C. W., Chan, T. M., Tsui, W. T., Chan, F. T. S., Ho, G. T. S., & Choy, K. L.
(2009). A fuzzy guided multi-objective evolutionary algorithm model for solving transportation problem. Expert Systems with Applications, 36, 8255-8268.
Lee, L.-W., Chen, S.-M. (2008). Fuzzy risk analysis based on fuzzy numbers with different shapes and different deviations. Expert Systems with Applications, 34, 2763–2771.
Li, T.-H. S., Guo N.-R., & Cheng, C.-P. (2008). Design of a two-stage fuzzy classification model. Expert Systems with Applications, 35, 1482–1495.
Lo, S.-C., Chang, W.-J., Kuo, P.-C., & Kuo, C.-Y. (2009). The Simulation of MRT Transfer System Based on Bus Holding system with platform constraints. In Proceedings of the 2009 IEEE International Conference on Systems, Man, and Cybernetics, (pp. 137–142). San Antonio, Texas, USA.
Lotan, T., & Koutsopoulos, H. (1993). Route choice in the presence of information using concepts from fuzzy control and approximate reasoning. Transportation Planning and Technology, 17, 113-126.
Lotan, T., & Koutsopoulos, H. (1993). Models for route choice behavior in the presence of information using concepts from fuzzy set theory and approximate reasoning. Transportation, 20, 129-155.
Lotfi, A. A., & Kashani, F. H. (2004). Bandwidth optimization of the E-shaped microstrip antenna using the genetic algorithm based on fuzzy decision making. In Proceedings of the 2004 IEEE antennas and propagation society international symposium, (pp. 2333–2336). Monterey, California.
Mamdani, E., & Assilian, S. (1975). An experiment in linguistic synthesis with a fuzzy logic controller. International Journal of Man-Machine Studies, 7, 1–13.
Milosavljevic , N., Teodorovic , D., Papic , V., & Pavkovic , G. (1996). A fuzzy approach to the vehicle assignment problem. Transportation Planning and Technology, 20, 33–47.
Nakatsuyama, M., Nagahashi, N., & Nishizuka, N. (1983). Fuzzy logic phase controller for traffic functions in the one-way arterial road. In Proceedings of IFAC 9th Triennial World Congress, (pp. 2865–2870). Pergamon Press, Oxford.
Nanda, R., & Kikuchi, S. (1993). Estimation of trip O±D matrix when input and output are fuzzy. In: Ayyub, B.M. (Ed.). The proceedings of the second international symposium on uncertainty modeling and analysis. IEEE Computer Press, (pp.104–111). College Park, Maryland.
O’Dell, S. W., & Wilson, N. H. M. (1999). Optimal real-time control strategies for rail transit operations during disruptions. Lecture Note in Economics and Mathematical Systems: Computer Aided Transit Scheduling, Springer-Verlag, Berlin, Heidelberg, 471, 299–323.
Osuna, E. E., & Newell, G. F. (1972). Control strategies for an idealized public transportation system. Transportation Science, 6(1), 52–72.
Pappis, C., Mamdani, E. (1977). A fuzzy controller for a traffic junction. IEEE Transactions on Systems, Man and Cybernetics, 7, 337–364.
Perkinson, D. (1994). Using automated vehicle location data to monitor congestion:
Fuzzy set theory. ITE Journal, February, 35–40.
Sasaki, T., & Akiyama, T. (1986). Development of fuzzy traffic control system on urban expressway. In Proceedings of 5th IFAC/IFIP/IFORS International Conference in Transportation Systems, (pp.333–338).
Sasaki, T., & Akiyama, T. (1987). Fuzzy on-ramp control model on urban expressway and its extension. In: Gartner, N.H., Wilson, N.H.M. (Eds.). Transportation and traffic theory, (pp.377–395). Elsevier Science, New York.
Sasaki, T., & Akiyama, T. (1988). Traffic control process of expressway by fuzzy logic. Fuzzy Sets and Systems, 26, 165–178.
Song, Y. H., Wang, G. S., Wang, P. Y., & Johns, A. T. (1997). Environmental/economic dispatch using fuzzy logic controlled genetic algorithms. IEE Proceedings of Generation Transmission and Distribution, 144(4), 377–382.
Subbu, R., Sanderson, A. C., & Bonissone, P. P. (1998). Fuzzy logic controlled genetic algorithms versus tuned genetic algorithms: An agile manufacturing application. The Proceedings of the 1998 IEEE international symposium on intelligent control, (pp.434–440). Gaithersburg, Maryland, USA.
Sugeno, M., & Nishida, M. (1985). Fuzzy control of model car. Fuzzy Sets and Systems, 16, 103–113.
Teodorovic , & D., & BabicÂ, O. (1993). Fuzzy inference approach to the management problem in air traffic control. Transportation Planning and Technology, 17, 165–178.
Teodorovic , D., & Kikuchi, S. (1993). Transportation route choice model using fuzzy inference technique. In: Ayyub,B.M. (Ed.). The Proceedings of the first international symposium on uncertainty modeling and analysis. IEEE Computer Press (pp.140–145). College Park, Maryland.
Teodorovic , D., & Kikuchi, S. (1993). Application of fuzzy sets theory to the saving based vehicle routing algorithm. Civil Engineering Systems, 8, 87–93.
TeodorovicÂ, D., Kalic , M., & Pavkovic , G. (1994). The potential for using fuzzy set theory in airline network design. Transportation Research, 28B, 103–121.
Teodorovic , D., & Kalic , M. (1995). A fuzzy route choice model for air transportation networks. Transportation Planning and Technology, 19, 109–119.
Teodorovic , D., & Pavkovic , G. (1996). The fuzzy set theory approach to the vehicle routing problem when demand at nodes is uncertain. Fuzzy Sets and Systems, 82, 307–317.
TeodorovicÂ, DusÏan, (1999). Fuzzy logic systems for transportation engineering:
the state of the art. Transportation Research Part A: Policy and Practice, 33, 337–364.
Turnquist, M. A. (1978). Strategies for improving reliability of bus transit service.
Transportation Research Record, 818, 7–13.
Turnquist, M. A., & Blume, S. W. (1980). Evaluating potential effectiveness of headway control strategies for transit systems. Transportation Research Record, 746, 25–29.
Tzeng, G.-H., & Teng, J.-Y. (1993). Transportation investment project selection with fuzzy multi-objectives. Transportation Planning and Technology, 17, 91–112.
Tzeng, G.-H., Teodorovic , D., & Hwang, M-J. (1996). Fuzzy bicriteria multi-index transportation problems for coal allocation planning of Taipower. European Journal of Operational Research, 95, 62-72.
VukadinovicÂ, K., & Teodorovic , D. (1994). A fuzzy approach to the vessel dispatching problem. European Journal of Operational Research, 76, 155–164.
Wang W.-P, & Chen Z. (2008), A neuro-fuzzy based forecasting approach for rush order control applications. Expert Systems with Applications, 35, 223–234.
Xu, W., & Chan, Y. (1993a). Estimating an origin destination matrix with fuzzy weights. Part 1: Methodology. Transportation Planning and Technology, 17, 127–144.
Xu, W., & Chan, Y. (1993b). Estimating an origin-destination matrix with fuzzy weights Part 2: Case studies. Transportation Planning and Technology, 17, 145–164.
Zhao, J., Bukkapatnam, S., & Dessouky, M. M. (2003). Distributed Architecture for Real-Time Coordination of Bus Holding in Transit Networks. IEEE Transactions on Intelligent Transportation Systems, 4, 43-51.
Zadeh, L. A. (1965). Fuzzy sets. Information and Control, 8, 338–353.
Zadeh, L. A. (1973). Outline of a new approach to the analysis of complex systems and decision processes. IEEE Transactions on Systems, Man and Cybernetics, 3, 28–44.
國科會補助出席國際會議報告
99 年 7 月 26 日
報告人姓名 羅士哲
服 務 機 關 名 稱
(請註明系所)
及職稱
國立臺灣科技大學工業 管理系助理教授
會議期間及地點
自 2010 年 7 月 12 日至2010年7月15 日(美國內華達州 拉斯維加斯)
本 部 核 定 補 助
文號 NSC98-2410-H-011-025
會議名稱
(中文)2010電腦科學電腦工程與應用計算國際會議
(英文)The 2010 World Congress in Computer Science, Computer Engineering, and Applied Computing
發表論文題目
(中文)物流管理中以粒子群最佳化求解具接駁式轉運之車 輛運途問題
(英文)A PSO Approach for the Vehicle Routing Problem with Cross-docking in Logistics Management
報告內容應包括下列各項:
一、參加會議經過 二、與會心得 三、建議
四、攜回資料名稱及內容 五、其它
WORLDCOMP10學術之旅 羅士哲
國立臺灣科技大學工業管理系助理教授 一、 參加會議經過
本 次 會 議 為 WORLDCOMP10 (The 2010 World Congress in Computer Science, Computer Engineering, and Applied Computing, http://www.world-academy-of-science.org/worldcomp10/ws),自2010年7月12日至 2010年7月15日在美國內華達州拉斯維加斯市的Monte Carlo Resort舉行。此系列 會議包含22個子會議,本人主要參與的會議為 GEM10 (The 2010 International Conference on Genetic and Evolutionary Methods),主辦人為 Prof. Hamid R.
Arabnia,邀請本人發表會議論文並擔任GEM10會議2010年7月13日下午的分段主 持人。
本次會議安排十位的Keynote lectures,其中最要的就是擔任第一位Keynote Speaker 的 Prof. Lotfi A. Zadeh 教 授 進 行 “Computing With Words and Perceptions—A Paradigm Shift” ,Zadeh教授為模糊理論的創始人。除了Keynote lectures外,還有13個Tutorials。這次學術會議,台灣也有幾位教授參與。除了白 天的論文發表外,第一天的晚上九點有安排社交晚宴。會議期間連續四天早出晚 歸,相當辛苦,因為這四天正好碰到會議所在地拉斯維加斯熱浪來襲,連續數天 都是高達攝氏44度的高溫,不過也過得相當充實。除在學術專業與各國學者交流 外,對異國風情文化亦略有體會與感受。
二、 與會心得
首先,感謝國科會補助出國參加國際研討會,使申請人能有機會參與這次 的WORLDCOMP10國際會議。這次會議包含22個子會議,與會人數相當多人,
根據 “Microsoft Academic Search” ,所有的WORLDCOMP10國際會議,除了一 個 EEE10 子會議外,均被列為 “Top-ranked Conferences” (依據數個指標包含論 文引用數),WORLDCOMP10國際會議每日均安排 Plenary lecture,之後則分十 幾場進行論文發表。討論之熱烈,可想而知。除了會議進行時的討論外,連中場 Coffee Break 的時間,也看到多位學者不斷熱烈討論,是申請人參加國多次內外 研討會見過最熱絡的一次。
申請人除發表論文 “A PSO Approach for the Vehicle Routing Problem with Cross-docking in Logistics Management” 於GEM10會議2010年7月13日下午場次 並擔任該時段之 Session Chair 主持該場論文發表,該時段預定之七篇論文,除 最後一篇的發表人因故不克前來外,其他六篇論文均完成發表手續,並且在Q/A 時段引起與會者相當大的討論。六篇論文發表人來自六個不同國家,顯示此會議 相當的國際化,論文之內容也相當有深度,本人深感獲益良多。
三、建議
本次研討會給我的感覺是學術交流與國際視野開拓的重要性,有相當多的 會議參與人都是來自各國的碩博士班研究生,但來自台灣的學者相當少,也都是 大專院校的教師,而無任何來自台灣的研究生參與此會議,跟其他國家比較起來,
我們國家對學生的補助相對少,反而是來自中國大陸的學生占了相當大的比例。
因此,教育部或國科會往後應盡量補助國內年輕學者或博士生,早日參與國際學 術會議,開拓其國際視野並邁向國際化。
另外,WORLDCOMP10國際會議的22個子會議中,以資料探勘子會議的參 與人數最多,該子會議的規模比其他會議來的大,也比較團結,建議未來若有學 者欲參加這個會議,可以選擇資料探勘子會議做為主要的會議,可以獲得較多的 資源與體驗。
四、攜回資料名稱及內容
攜回的主要資料,除了該會議的詳細議程外,以及一本 GEM10 大會論文集與 CD 光碟一片。
1
A PSO approach for the Vehicle Routing Problem with Cross-docking in Logistics Management
Shih-Che, Lo* and Ching-Yu Wang
Department of Industrial Management, National Taiwan University of Science and Technology No. 43, Keelung Rd., Sec. 4, Taipei, Taiwan, R.O.C.
*Corresponding author. Tel: +8862-2737-6351; Fax: +8862-2737-6344. Email address: [email protected] (S.-C.
Lo).
Submitted to “Genetic & Evolutionary Methods (GEM)” track of the “2010 World Congress in Computer Science, Computer Engineering, and Applied Computing”
Abstract
The design of logistics network with the establishment of Cross-docking allows freight companies to integrate the physical flow of goods collaboratively between upstream suppliers and downstream retailers in a supply chain. The collective effort aims at synchronizing the shipments in both pickup and delivery processes concurrently to avoid handling and inventory costs being generated in the distribution centers. Accordingly, the optimization of vehicle dispatching schedule is imperative in order to produce a routing plan with minimum transport cost to fulfil all demand.
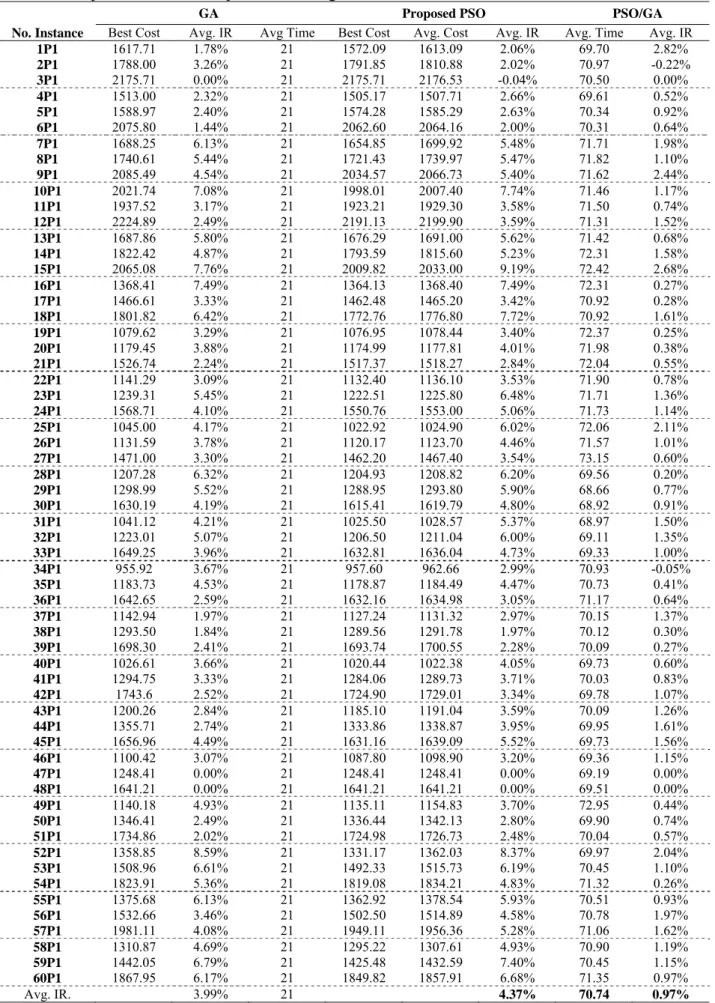
This study developed an algorithm based on the Particle Swarm Optimization (PSO) to find combinatorial optimal solutions of the vehicle routing problems with Cross-docking in a supply chain. Experimental results from the PSO method were compared with the Genetic Algorithm (GA) through numerical examples of VRP pickup and delivery benchmark problems to validate the performance of the proposed PSO algorithm. The computational results showed that the proposed PSO algorithm is competitive with average improvements of 1% over the GA method based on the criterion of expectation solution quality.
Keywords: vehicle routing problem; cross-docking; logistics; particle swarm optimization; supply chain management
1. Introduction
With the significant impact of cost management in the supply chain environment, constructing an efficient logistics operation enables companies to build competitive edges over competitors from a global strategy viewpoint. LaLonde and Zinszer [1] identified that the logistics cost accounted for approximately 10% of a company’s total revenue, while Apte and Viswanathan [2] stated that 30% of final cost was incurred in the distribution process. As a result, a well-organized and highly cost efficient logistics mechanism appears essential in order to lower costs, increase profits, and improve company’s overall performance.
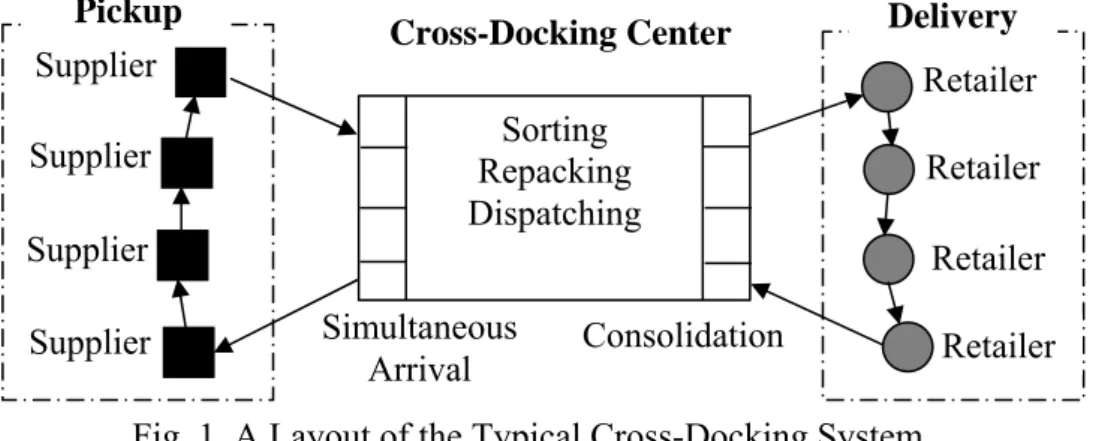
This research aims at controlling transport costs by optimizing routes and scheduling of vehicles, which is well known as the Vehicle Routing Problem (VRP). Among numerous studies of the VRP, the model with optimal vehicle routes scheduling, considering both pickup and delivery processes simultaneously in a hub operation, is called the VRP with Cross-docking (VRPCD). The core value of Cross-docking reflects on the ability of synchronizing material flows on both sides of supply chain. Generally, there is no interruption between two sides of flows as long as all shipments from pickup process arrive at the Cross-docking concurrently and then deliver to customers after the consolidation process. In this case, there is no inventory stocking at the distribution warehouse and no delay of customer orders. Figure 1 shows a typical layout of the Cross-docking functionality.
From Figure 1, Cross-docking is a concept of flowing goods from receiving to shipping without ever putting them into the distribution warehouse for storage. It is also considered as optimal vehicle routing for the associated direct service fulfilment, subject to loading capacity and service time constraints [3]. The primary objective is to avoid the inventory and handling cost so that there will be no inventory being stored in the central warehouse ideally [4]. Also, since the VRP is a well-known NP hard problem, applying an efficient heuristic approach is necessary in order to obtain a best or near optimal solution within a reasonable computation time.
The particle swarm optimization is a newly developed evolutionary meta-heuristics in the field of Swarm Intelligence and has been found to be robust and efficient in solving nonlinear and multi-modal problems [5]. More importantly, it was proved to be efficiently competitive with the Genetic Algorithm (GA) for the optimization problem
2
[6]. Numerous studies of the PSO have been presented in the past. However, most of them were emphasized on nonlinear, complex and continuous binary space problems. For the discrete problems seeking for combinatorial optimal solutions as the VRP does, the applications by the PSO were still relatively few. Therefore, this study developed a heuristic algorithm based on the particle optimizer and applied the method to solve the practical VRPCD problems. The major objective of the research is to obtain optimal solutions of vehicle routing and scheduling, least number of vehicles dispatched, and the total cost minimization as a whole.
Fig. 1. A Layout of the Typical Cross-Docking System.
The reminder of this paper is organized as follows. Section 2 defines VRPCD problem formulation. Section 3 details the design and procedure of our proposed PSO algorithm, following a number of experimental examples presented in Section 4. Section 5 concludes the research with a summary based on the computational results.
2. Problem Descriptions
PSO is a newly developed evolutionary meta-heuristics that was introduced by [6] as the observation of simplified social behaviour of bird flocks. Various modifications have been presented since the introduction. Shi and Eberhart [5][7] added the inertia weight W to the original PSO equation, where W plays a role of balance between local and global search, ranging from 0.9 to 1.2 on average for a better performance. In this study, our proposed PSO algorithm is developed based on the following evolutionary steps of particle.
The velocity:
Vidt = W × Vid + φid1 × rand() × (Pid – Xidt) + φid2 × Rand() × (Pgd – Xidt). (1) New position updated by:
Xidt+1←Xidt+ Vidt. (2)
Subject to:
. then
,
If
, then
,
If
max max
max max
V V V
V
V V V
V
id id
id id
−
=
<
=
≥ (3)
The individual best position is updated using:
⎩⎨
⎧
≤
= >
).
( ) ( if ,
), ( ) ( if ,
id id
id
id id
id
id X f X f P
P f X f
P P (4)
The swarm best position is updated using:
⎩⎨
⎧ <
= , otherwise.
), ( ) ( min if }, ) ( min { arg
gd
gd id
id
gd P
P f P f P
P f (5)
On the problem of the vehicle routing with one Cross-docking, the constraints for simultaneous arrival of each vehicle from the pickup routes and equivalent quantity of goods transporting on both sides of supply chain are particularly emphasized. Therefore, several assumptions are made in the VRPCD formulation. First, we have n nodes, which are comprised by both number of suppliers and retailers who are serviced by m vehicles. Each vehicle must be sent out and arrived at the Cross-docking (i = 0), particularly restricting for simultaneous arrival of vehicles from pickup routes. Second, for each customer, only one vehicle is assigned and associated with a cost amount of Cij. Every customer has the same amount of demand d, which is restricted to the capacity limit q of each vehicle. Also, a constraint of time horizon T specifies the total distance travelled by vehicles cannot exceed it. Two types of cost are considered:
transporting and operational cost. The overall scope is to obtain the optimal routing schedule and least number of vehicles used. The following presents the basic notations of the VRPCD model.
Basic notations:
Xijk : a binary variable representing the route from i to j is serviced by vehicle k.
Cross-Docking Center
Consolidation Simultaneous
Arrival
Sorting Repacking Dispatching
Retailer
Retailer Delivery
Retailer Retailer Supplier
Supplier Supplier Supplier
Pickup