FTIR study of adsorption and photoreactions of acetic acid on TiO2
Li-Fen Liao, Chen-Fu Lien and Jong-Liang Lin*Department of Chemistry, National Cheng Kung University 1, T a Hsueh Road, T ainan, T aiwan, Republic of China
Received 12th April 2001, Accepted 18th June 2001
First published as an Advance Article on the web 19th July 2001
Fourier-transformed infrared spectroscopy has been employed to study the adsorption and photoreactions of acetic acid on powderedTiO Molecular acetic acid and acetate groups are present on following acetic
2. TiO2
acid adsorption at 35 ¡C. Acetic acid is adsorbed via hydrogen bonding or Lewis acidÈbase interaction and is removed at 170 ¡C, leaving acetate on the surface. The adsorbed acetate groups adopt a bidentate
coordination.CO is detected as a photoproduct in the UV irradiation of surface acetate. In the presence of 2(g)
water, some surface acetate is converted into acetic acid, and, in this case, bothCO and are 2(g) CH4(g) observed in the photoillumination. However, e†ect of water on the reaction rate forCO and
2(g) CH4(g) formation is not signiÐcant.O can increase the photodecomposition rate of acetic acid on and in
2 TiO2,
addition toCH and oxygenated compounds such as and are 4(g) CO2(g), CH3OH(g), CH2O(g) HCOOCH3(g) detected. It is likely that these species are generated due toO produced from photoelectrons and
2~, O2,
attacking adsorbed acetic acid molecules instead of attacking acetate groups.
Introduction
is a wide band gap semiconductor with band edge posi-TiO
2
tions suitable for photocatalytic reactions of a large number of organic molecules. Photons with energy larger than the band gap can excite the electrons from the valence band to the con-duction band, forming electronÈhole pairs as photoreaction initiators.1,2 Photoreactions of acetic acid induced byTiO or
2 platinized TiO have been studied previously using EPR,3,4
2
gasÈliquid chromatography5h9 and mass spectrometry.10 These investigations were carried out with the catalysts either in aqueous solutions of CH or
3COOH CH3COOH/ mixtures3h8 or in contact with acetic acid CH
3COO~
vapor.9,10 It was found by Bard et al.7,8 that, in aqueous reac-tion systems of acetic acid or acetic acid/acetate withTiO or
2 in the absence of and were the Pt/TiO
2 O2, CO2(g) CH4(g) major products with minor amounts of C and
2H6(g) H2(g). When CH (98 atom%) was used to react with
3COOD
the generated methane was composed of 80% Pt/TiO
2, and 20% Meanwhile, photo-CH
3D(g) CH4(g). CH3COOH decomposed D1.9 times as fast as CH showing an
3COOD,
isotope e†ect on the reaction rate. In addition to the gaseous
products of CO and
photo-2(g), CH4(g), C2H4(g) H2(g), decomposition of acetic acid also generated insigniÐcant amounts of oxygenated compounds in aqueous medium.5,7,8 Bard et al. proposed a mechanism for the observed gaseous products of acetic acid photodecomposition :7,8
h` ] CH
3COO~] CH3~] CO2 (1) e~ ] CH3COOH] H(ads) ] CH3COO~ (2) e~ ] CH3~] CH3COOH] CH4] CH3COO~ (3) 2CH 3~] C2H6 (4) 2H(ads)] H2 (5) CH 3~] H(ads)] CH4 (6) An alternative possible pathway for the formation ofCH was
4 also proposed, i.e.,
e~ ] (CH
3~)(ads)] (CH3~)(ads) (7)
(CH
3~)(ads) ] H2O] CH4] OH~ (8) In the in situ EPR study ofPt/TiO suspended in acetic acid
2
aqueous solution, Nosaka et al. observed the formation of and radicals and proposed the following CH
3~ ~CH2COOH mechanism for their formation :5
h` ] CH
3COOH] CH3~] CO2] H` (9) ~OH] CH3COOH] CH3~] CO2] H2O (10) h` ] H2O] ~OH ] H` (11) ~OH] CH3COOH] ~CH2COOH] H2O (12) Sclafani et al. investigated the photodecomposition of Ñowing acetic acid vapor over a series of pure insulators and semiconductor oxides.9 The main products detected by gas chromatography were CO and with a trace of
2(g) CH4(g), formation was much faster than C
2H6(g). CO2(g) CH4(g). Muggli et al. studied photocatalytic decomposition of a monolayer of acetic acid onTiO in He Ñow using mass
spec-2
trometry.10 They also observed the formation of CO2(g), and and suggested the following two parallel CH
4(g) C2H6(g)
pathways during transient experiments for acetic acid photo-decomposition :
CH
313COOH(ads)] 13CO2] CH4 (13) 2CH
313COOH(ads) ] O(1)] C2H6] 2 13CO2] H2O(ads) (14) Eqn. (14) involvesTiO lattice oxygen O(l).
2
Unfortunately, in these previous reports the subject of surface adsorption of acetic acid and its relation to photoreac-tivity were hardly discussed. Without knowing the surface adsorption, the adsorbates involved in photoreactions may not be exactly assigned. For example, Bard et al. proposed the acetate ion as hole acceptor in eqn. (1), while Nosaka et al. proposed acetic acid as hole acceptor in eqn. (9). In the present paper, we Ðrst studied the adsorption of acetic acid on using Fourier-transformed infrared spectroscopy. It was TiO
2
found that acetic acid was adsorbed both molecularly and dis-sociately onTiO at 35 ¡C. Adsorbed acetic acid was removed
2
from surface by brieÑy annealing theTiO at 170 ¡C, leaving 2
the surface covered with acetate groups. We then studied the photoreaction of surface acetate and the e†ect of H
addi-2O tion to the reaction system to mimic the reaction in the solu-tion phase. The investigasolu-tion was further extended to TiO
2 surface covered with both acetic acid and acetate groups to di†erentiate their contributions to the reaction products. Finally, we investiged the e†ect of the addition of O
2.
Experimental
The sample preparation ofTiO powder supported on a tung-2
sten Ðne mesh (D6 cm2) has been described previously.11,12 In brief,TiO powder (Degussa P25, D50 m2 g~1, anatase 70%,
2
rutile 30%) was dispersed in a water/acetone solution to form a uniform mixture which was then sprayed onto a tungsten mesh. After that, theTiO sample was mounted inside the IR
2
cell for simultaneous photochemistry and FTIR spectroscopy. The IR cell, with two CaF windows for IR transmission
2
down to 1000 cm~1, was connected to a gas manifold which was pumped by a 60 L s~1 turbomolecular pump with a base pressure of D1] 10~7 Torr. TheTiO sample in the cell was
2
heated to 450 ¡C under vacuum for 24 h by resistive heating. The temperature of the TiO sample was measured by a
2
K-type thermocouple spotwelded on the tungsten mesh. Before each run of the experiment, the TiO sample was
2
heated to 450 ¡C in vacuum for 2 h. After the heating, 10 Torr was introduced into the cell as the sample was cooled to O
2
70 ¡C. When theTiO temperature reached 35 ¡C the cell was 2
evacuated for gas dosing. The TiO surface after the above 2
treatment still possessed residual isolated hydroxy groups.13 TheO (99.998%, Matheson) was used as received in a
com-2
pressed state. CH (99.9%, Fisher) was puriÐed by 3COOH
several cycles of freezeÈpumpÈthaw prior to introduction into the infrared cell. The pressure was monitored with a Baratron capacitance manometer and an ion gauge. In the photochem-istry study, both the UV and IR beams were set 45¡ to the normal of the TiO sample. The UV light source used was a
2
combination of a Hg arc lamp (Oriel Corp) operated at 350 W, a water Ðlter, and a band pass Ðlter with a band width of D100 nm centered at D320 nm (Oriel 51650). The UV absorption of CH for the wavelength used in the
3COOH
present study was negligible.14 IR spectra were obtained with a 4 cm~1 resolution by a Bruker FTIR spectrometer with a MCT detector. The entire optical path was purged with CO
2 -dry air. The spectra presented here have been ratioed free
against a clean TiO spectrum providing the metal-oxide 2
background. In the study of photooxidation, the photoirradia-tion time was taken to start as the UV lamp was turned on. The lamp took 40È50 s to reach the full power.
Results and discussion
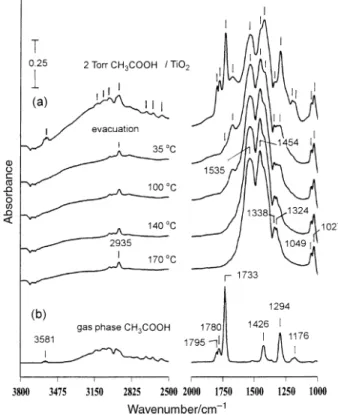
Fig. 1(a) shows the IR spectra of a clean TiO surface in 2
contact with D2 Torr of CH at 35 ¡C, followed by 3COOH
evacuation and brief annealing at the indicated termperatures. As marked in the spectrum ofTiO in contact with D2 Torr
2
absorption bands appear at 1027, 1047, 1184, CH
3COOH,
1199, 1293, 1340, 1423, 1452, 1535, 1674, 1732, 1779, 1798, 2569, 2636, 2698, 2939, 3025, 3074, 3128 and 3578 cm~1. Since gas phaseCH is present in the infrared cell, to Ðnd its
3COOH
contribution to the spectrum in Fig. 1(a), infrared absorptions of gaseous acetic acid, taken under the same optical condi-tions, are shown in Fig. 1(b). Acetic acid molecules present in the gas phase show the monomeric form with characteristic bands at 1176, 1780, 1795 and 3581 cm~1 as well as the dimeric form with characteristic bands at 1294, 1426 and 1733 cm~1.15 The monomer/dimer ratio is concentration depen-dent.15 The dimer is held together by hydrogen bonding between two monomers, resulting in a lower carbonyl stretch-ing frequency (1733 cm~1) than those of monomer (1780, 1795
Fig. 1 (a) IR spectra of theTiO at 35 ¡C after being in contact with 2
D2 Torr of acetic acid followed by evacuation and annealing at the indicated temperatures for 1 min. The absorption frequencies at the marked positions in the 35 ¡C spectrum are listed in the text. The weight of theTiO sample used was 67 mg. (b) IR spectra of acetic
2
acid vapor in the absence ofTiO All the spectra were recorded over 2.
50 scans.
cm~1).15 In Fig. 1(a), the gaseous acetic acid is removed from the infrared cell by evacuation. The remaining peaks at 1027, 1049, 1296, 1341, 1415, 1453, 1535, 1675, 1736 and 2936 cm~1 are due to adsorbed surface species. The peaks at 1296, 1415, 1675 and 1736 cm~1 decrease in intensity with increasing surface temperature under vacuum and disappear at 170 ¡C, suggesting that they originate from the same adsorbed com-pound. The peaks of 1675 and 1736 cm~1 are characteristic absorptions of carbonyl stretching. In addition, the peaks at 1296 and 1415 cm~1 are close to the acetic acid absorptions in the gas phase. These observations indicate that acetic acid is molecularly adsorbed on the surface at temperatures less than 170 ¡C. The weak band at 1736 cm~1 reveals that some of the surface acetic acid is adsorbed with hydrogen bonding, as sug-gested by the similar carbonyl stretching frequency of dimeric acetic acid in the gas phase. This hydrogen bonding may come from the interaction of a adsorbed acetic acid with surface OH groups or with another acetic acid molecule. The other car-bonyl peak, at 1675 cm~1, is D60 cm~1 lower than that of the adsorbed acetic acid with hydrogen bonding and is attributed to acetic acid bonded at Lewis acid sites (Ti4`) through the oxygen lone-pair electrons of the carbonyl group. The same carbonyl stretching frequency has been reported for methyl formate adsorbed on TiO After removal of the surface
2.16
acetic acid, the 170 ¡C spectrum in Fig. 1(a) shows infrared bands at 1027, 1049, 1324, 1338, 1454, 1535 and 2935 cm~1. These are assigned to adsorbed acetate groups, as supported by the similar formic acid decomposition process on TiO
2.16 The peaks at 1027 and 1049 cm~1 are related toCH rocking
3 and CÈC stretching, 1324 and 1338 cm~1 to CH bending,
3
1454 and 1535 cm~1 to ÈCOOÈ stretching, and 2935 cm~1 to stretching. In particular, the 81 cm~1 di†erence between CH
3
the ÈCOOÈ antisymmetric and symmetric stretching fre-quencies of 1535 and 1454 cm~1 reveals that the acetate group is bonded by a chelating bidentate conÐguration, as
shown in Scheme 1.17 CH is used to represent the 3COO(a)
surface acetate, showing only its adsorbed state and chemical formula, but not its electric charge.
Scheme 1
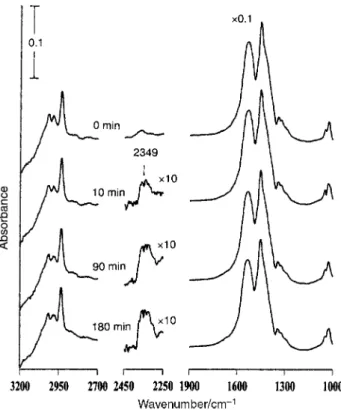
Photochemistry of CH
3COO(a)
Fig. 2 shows the IR spectra taken both before and after the indicated times during photoirradiation ofCH in a
3COO(a) closed cell. The only product detected by our spectrometer is
at 2349 cm~1. The solid curve with data points in Fig. CO
2(g)
3 shows the relativeCO concentration as a function of UV 2(g)
irradiation time. From the slope of the curve in Fig. 3, the photoreaction rate is higher in the initial stages and becomes smaller for longer illumination times. The two dashed curves in Fig. 3 are simulatedCO production curves with Ðrst-order
2
kinetics, but di†erent rate constants. As expected, the experi-mental data do not follow Ðrst-order reaction kinetics, since the surface is inhomogeneous. The slower reaction rate for elongated UV irradiation in the experimental curve partially results from the decrease of CH concentration with
3COO(a)
light exposure. Most importantly, it reÑects retarded efficiency of photogenerated holes to initiate the surface reaction with photoirradiation time. The decrease of reaction rate with illu-mination is likely to be due to electron accumulation on the
Fig. 2 IR spectra taken before and after the indicated times during UV irradiation ofCH which was formed by exposing a clean
3COO(a),
surface to 2 Torr of acetic acid vapor followed by annealing at TiO
2
170 ¡C for 3 min under vacuum. Each spectrum was recorded with Ðve scans. All the traces in the region 1000È1900 cm~1 have been multiplied by a factor of 0.1. To clearly show theCO absorption,
2(g)
the three curves in 2250È2450 cm~1 region of the 10, 90 and 180 min spectra are obtained after the spectrum prior to UV irradiation is subtracted, and then multiplied by a factor of 10. The weight of the
sample used was 88 mg. TiO
2
Fig. 3 Relative CO concentration as a function of UV irradiation 2
time in the photodecomposition ofCH (ÈÈ) and two simu-3COO(a)
latedCO production curves of Ðrst-order kinetics with di†erent reac-2
tion rate constants (È È È). The maximumCO amount is scaled to 1. 2
surface, which increases the recombination of electronÈhole pairs.18,19 Photoreaction ofCH in 10 Torr of was
3COO(a) O2 also investigated. It is found that the observedCO
forma-2(g) tion after 180 min irradiation is D3 times that without O
2. No other products were detected.
Photochemistry ofCH in the presence of water
3COO(a)
The e†ect of water on the CH photoreaction was 3COO(a)
studied by preparing the acetate-adsorbed TiO surface fol-2
lowed by introduction ofH into the cell, to give a D0.1 2O
Torr equilibrium vapor pressure, and UV illumination on the surface. Fig. 4 shows the IR spectra before and after 10, 90 and 180 min UV irradiation. It is found that after exposure of vapor to acetic acid is formed on the H
2O CH3COO(a),
surface as indicated by its characteristic peaks at 1291 and 1671 cm~1 in the 0 min spectrum in Fig. 4, accompanying a D15% decrease of acetate. A surface reaction of CH
3COO(a) must take place on Fig. 4 ] H2O(a)] CH3COOH(a) TiO
2. shows that, in the presence ofH the infrared absorption at
2O,
3017 cm~1 is enhanced under UV irradiation. To easily see the band, an IR spectrum was taken after the 180 min irradia-tion, followed by evacuation to remove gaseous products from the cell, and was then subtracted from the 180 min spectrum in Fig. 4. The inset in Fig. 4 is the di†erence spectrum, clearly showing a sharp peak at 3017 cm~1 which is attributed to
Fig. 5 shows the relative concentration of CH
4(g).20 CO2(g)
andCH as a function of UV irradiation time. Because of 4(g)
the noise in the baseline of the spectra, an absorption band for is not discernible when its peak intensity is less than CH
4(g)
D10% of that after the 180 min UV irradiation in Fig. 4. Therefore, in this case, the relativeCH concentration is set
4(g)
to zero in the initial photoirradiation stage in Fig. 5. To obtain absolute amounts ofCO and formed, two
2(g) CH4(g)
calibration curves of peak area vs. pressure forCO at 2349 2(g) cm~1 andCH at 3017 cm~1 have been established. It is
4(g)
found that the absolute ratioCO is D1.71 after 2(g)/CH4(g)
180 min photoillumination in Fig. 4. This reveals that, in the photodecomposition ofCH or some
3COO(a) CH3COOH(a), of the intermediates or products in the gas phase or on the surface derived from the CH moiety of the two adsorbed
3
forms were not detected by our infrared spectrometer. The nonstoichiometric ratio of CO may also explain
2(g)/CH4(g)
the very lowCH signal during the initial stage of the photo-4(g)
irradiation process as shown in Figs. 4 and 5. The presence of H considerably increases the amount of by a
Fig. 4 IR spectra taken before and after the indicated times during photoirradiation of CH in D0.1 Torr water vapor. Each
3COO(a)
spectrum was recorded with Ðve scans. All the traces in the region 1000È1900 cm~1 have been multiplied by a factor of 0.1. To clearly show the CO absorption, the three curves in 2250È2450 cm~1
2(g)
region of the 10, 90 and 180 min spectra are obtained after the back-ground spectrum prior to UV irradiation is subtracted, and then multiplied by a factor of 10. The inset shows thatCH (3017 cm~1)
4(g) is formed. The weight of theTiO powder used was 88 mg.
2
factor D2.3 after 180 min light exposure, as compared to that in Fig. 3 without water. Because both CH and
3COO(a) were present on the surface in the photo-CH
3COOH(a)
decomposition study ofCH in the presence of 3COO(a) H2O, photoreactions catalyzed by a TiO surface covered with
2
and from acetic acid adsorption CH
3COOH(a) CH3COO(a)
were investigated. The results are shown in Fig. 6. Fig. 7
Fig. 5 Relative concentrations ofCO and formed in the 2(g) CH4(g)
photoreaction of adsorbed acetate with water overTiO as a function 2
of UV irradiation time. The maximum amount for each species is scaled to 1.
Fig. 6 IR spectra taken before and after the indicated times during photoirradiation of aTiO surface initially in contact with 2 Torr of
2
acetic acid followed by evacuation at 35 ¡C. The spectra are presented in the same way as those in Fig. 4. The weight of theTiO sample
2 used was 88 mg.
shows the relative concentrations of theCH and 4(g) CO2(g) photoproducts as a function of UV irradiation time. Com-pared to the case of Fig. 4 with CH
3COO(a), CH3COOH(a) andH in the reaction system, the amount of formed
2O CO2(g)
in Fig. 6 after 180 min irradiation is D95% of that in Fig. 4, but theCH is D80%. It is found that the absolute ratio of 4(g)is D1.84 after 180 min photoirradiation in Fig. CO
2(g)/CH4(g)
6 and that a similar amount ofCH is consumed 3COOH(a)
(Figs. 4 and 6). From these comparative studies, it is con-cluded thatCH contributes signiÐcantly to the
for-3COOH(a)
mation of CO and shown in Fig. 4. Water may 2(g) CH4(g)
enhance the formation ofCO and but seems not 2(g) CH4(g),
Fig. 7 Relative concentrations ofCO and formed in the 2(g) CH4(g)
photoreaction of adsorbed acetic acid and acetate as a function of UV irradiation time. The maximum amount for each species is scaled to 1.
to be very signiÐcant. The major role ofH is to transform 2O
surface acetate groups to acetic acid which also takes part in photodecomposition.
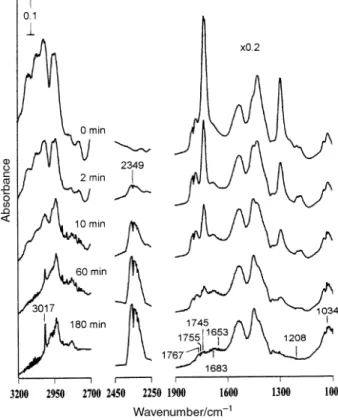
e†ect on acetic acid photoreaction O
2
Figs. 8 and 9 show spectra for the photoreaction of a TiO 2 surface initially in contact with D4 Torr ofCH and a
3COOH mixture of D4.5 Torr CH and D10 Torr in a
3COOH O2
closed cell, respectively, to show the O e†ect. In Fig. 8, 2
and are the only photoproducts detected in the CO
2(g) CH4(g)
absence ofO but with acetic acid present in the gas phase to 2,
replenish the adsorbate consumed in the photoreaction, the amounts ofCO and formed after 180 min
irradia-2(g) CH4(g)
tion are D1.7 times of that in Fig. 6. A considerable amount of gaseous acetic acid is still present in the cell at the end of the photoillumination. In contrast to the case without O
2, oxygen-containing species such as CH represented at
3OH(g)
1034 cm~1, CH at 1745 cm~1, at 1653, 1683 2O(g) H2O(g)
cm~1 and HCOOCH at 1208, 1755 and 1767 cm~1 are 3(g)
generated in the presence ofO as shown in Fig. 9.20 In addi-2
tion, the gaseous acetic acid is almost depleted after 180 min irradiation with a concomitant signiÐcant increase of CO
2(g) andCH The and formed after 180 min in
4(g). CO2(g) CH4(g)
Fig. 9 are D10 and D2.5 times of those in Fig. 8, respectively. The presence ofO largely increases the photoreaction rate.
2
Since, in Fig. 9, theTiO is covered with both
2 CH3COOH(a)
and CH it is interesting to further explore which 3COO(a),
species is responsible for the signiÐcantly increased CO 2(g) amount in the presence ofO In the discussion of Fig. 2 for
2.
Fig. 8 IR spectra taken before and after the indicated times during photoirradiation of aTiO initially in contact with D4 Torr of acetic
2
acid. Each spectrum was recorded with Ðve scans. The weight of the sample used was 67 mg. All spectra in the region 1000È1900 TiO
2
cm~1 have been multiplied by a factor of 0.2. To clearly show the absorption, the four curves in the 2250È2450 cm~1 region of CO
2(g)
the 2, 10, 60 and 180 min spectra are obtained after the spectrum prior to UV irradiation is subtracted, and then multiplied by a factor of 5.
Fig. 9 IR spectra taken before and after the indicated times during photoirradiation of aTiO surface initially in contact with a mixture
2
of D4.5 Torr of acetic acid and D10 TorrO Each spectrum was 2.
recorded with Ðve scans. The weight of theTiO sample used was 67 2
mg. To clearly show theCO absorption, the four curves in the 2(g)
2250È2450 cm~1 region of the 2, 10, 60 and 180 min spectra are obtained after the spectrum prior to UV irradiation is subtracted.
photoreaction it has been stated that can CH
3COO(a) O2
only increase theCO amount by a factor of D3 compared 2(g)
to the case withoutO Taking this and the similar amount of 2.
in Figs. 2 and 9 together into consideration, CH
3COO(a)formation from photoreaction only con-CO
2(g) CH3COO(a)
tributes D6% of theCO found in Fig. 9. Therefore it is 2(g)
concluded thatCH is the major precursor in the 3COOH(a)
photodecomposition to CO in the presence of
2(g) O2.
AdsorbedO can capture photogenerated electrons to form 2
anionic oxygen species that may act as oxidants. Scavenging of photogenerated electrons by O increases the lifetime of
2
holes and therefore speeds up the photoreactions they induced. The enhanced formation ofCH in Fig. 9 as
com-4(g)
pared to the case without O is attributed to the enhanced 2
formation ofCH that contributes to formation
accord-3~ CH4
ing to Bard et al.Ïs eqns. (3), (6) and (8), because the presence ofO extends the lifetime of holes. In addition, the formation
2
ofH or other oxygenated species also can increase the yield 2O
ofCH from reactions with Fig. 10 shows the relative 4(g) CH3~.
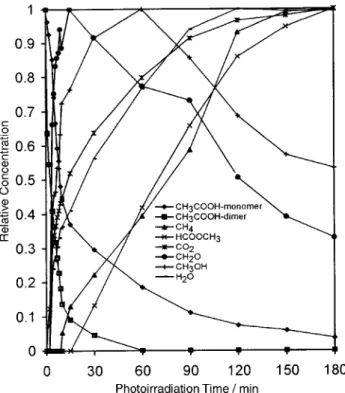
concentrations of the gaseous reactants and products as a function of photoirradiation time for Fig. 9. The gaseous acetic acid decreases with photoillumination in contrast to the monotonically increased CO and
2(g), CH4(g), H2O(g) Both and are generated HCOOCH
3(g). CH3OH(g) CH2O(g)
as intermediates. They reach a maximum amount before 80 min irradiation and then decrease.
We now make a brief summary and discuss further the results of the present study. Exposure of acetic acid over TiO
2 produces molecularly adsorbed CH and
disso-3COOH(a)
ciatively adsorbedCH The is bound 3COO(a). CH3COOH(a)
onTiO by hydrogen bonding or by Lewis acidÈbase inter-2
actions as evidenced by its carbonyl stretching frequencies. The CH is bonded in a bidentate conÐguration. 3COO(a)can be photodecomposed to by UV light CH
Fig. 10 Relative concentration of the species involved in the photo-reaction of a mixture of D4.5 Torr of acetic acid and 10 Torr of O
2 over TiO as a function of UV irradiation time. The maximum
2
amount for each species during the irradiation process is scaled to 1.
exposure through TiO excitation ; however, its photo-2
decomposition rate decreases with UV illumination time, probably due to electron accumulation on the surface that increases the possibility for electronÈhole recombination. When the TiO surface is covered with both
2 CH3COOH(a)
and CH is also observed in addition to 3COO(a), CH4(g)
Eqns. (1), (3) and (6) proposed by Bard et al. may CO
2(g).
explain the formation ofCH and but
4(g) CO2(g), CH3COO~ and CH should be replaced by and 3COOHin the present study, i.e., absorbed acetate andCH3COO(a) CH
3COOH(a)
acetic acid are involved in the photoreaction. In eqns. (2) and (3),CH acts as a photoelectron scavenger, allowing
3COOH(a)
the rate ofCH photodecomposition by hole capture 3COO(a)
to be increased and therefore enhancing CO formation. 2(g)
Although our results can be explained by Bard et al.Ïs mecha-nism, the possibility of hole capture ofCH to form
3COOH(a) and can not be completely ruled out. In the CH
4(g) CO2(g)
photodecomposition of CH in the absence of 3COO(a)
the formed from a CH
3COOH(a), CH3~ hole] CH3COO(a) may be adsorbed on the surface, ejected into the gas phase or may react with H(a) as shown in eqn. (6) to formCH
Ejec-4(g). tion ofCH radicals has been observed in the thermal
disso-3~
ciation of CH on copper single crystal surfaces,21,22 3I
on Al,23 on GaAs(100),24 on K/ Al(CH
3)3 Ga(CH3)3 CH3Br Ag(111)25 and methoxy groups on O/Mo(110).26 The latter case demonstrates that methyl radicals can also be ejected from oxidized metal surfaces, not just from bare metal ones. Additionally, CH radical has been detected by EPR in the
3~
photoreaction of aqueous acetic acid onPt/TiO at 77 K.3,4 2
SinceCH radicals are reactive species, if the ejection process 3~
is important, CH formation would be reduced according 4(g)
to Bard et al.Ïs mechanism. Based on the bidentate bonding conÐguration ofCH ejection is likely to occur
3COO(a), CH3~
since the CH group in points away from the 3 CH3COO(a)
surface. The methyl radicals thus formed may either stick on or react with adsorbates on the cell surface. Since our cell is only D10 cm long, low concentration of gaseous species may not be observable. This may explain why CH is not
4(g) detected in the spectra shown in Fig. 2. Fig. 4 shows that
can react with to form The CH
3COO(a) H2O CH3COOH. presence ofH may enhance the formation of and
2O CH4(g)
in the photodecomposition of but the CO
2(g) CH3COO(a),
e†ect is not signiÐcant. Addition ofO to the photoreaction 2
system of acetic acid over TiO considerably increases its 2
reaction rate and produces the oxygen-containing products methanol, formaldehyde and methyl formate. The major species reacting with oxygen is CH instead of
3COOH(a)
Schwitzgebel et al. have investigated the photo-CH
3COO(a).
decomposition of aqueous n-octanoic acid catalyzed by TiO 2 -glass microbubbles and observed the formation of n-coated
heptanol, n-heptanal, n-heptanoic acid andCO They pro-2.27
posed a reaction mechanism involving organoperoxy and tetraoxide intermediates in order to balance the equations of the photocatalytic reactions. Here a similar mechanism is pro-posed to account for the formation of methanol and formalde-hyde in the photoreaction of CH in the presence of
3COOH O 2: CH 3COOH] h` ] CH3~] CO2] H` H` ] O2~] ~OOH CH 3~] O2] CH3OO~ CH
3OO~] ~OOH] CH3OOOOH CH
3OOOOH] CH3COOH] CH3OH] CH2O ] O2] CO2 TheO is due to photoelectron capture by
2~ O2.
Finally, in our present study of the photocatalytic degrada-tion of acetic acid, no C is observed, because the
2H6(g)
process for C is a minor process. Although a small 2H6(g)
amount ofC may be formed in the cell, its signal must 2H6(g)
be below the detection limit of our infrared spectrometer.
Acknowledgement
We gratefully acknowledge the support of the National Science Council of the Republic of China (Grant NSC-89-2113-M-006).
References
1 M. A. Fox and M. T. Dulay, Chem. Rev., 1993, 93, 341.
2 M. R. Ho†mann, S. T. Martin, W. Choi and D. W. Bahnemann, Chem. Rev., 1995, 95, 96.
3 Y. Nosaka, K. Koenuma, K. Ushida and A. Kira, L angmuir, 1996, 12, 736.
4 Y. Nosaka, M. Kishimoto and J. Nishino, J. Phys. Chem. B, 1998, 102, 10279.
5 T. Sakata, T. Kawai and K. Hashimoto, J. Phys. Chem., 1984, 88, 2344.
6 H. Yoneyama, Y. Takao and H. Tamura, J. Phys. Chem., 1983, 87, 1417.
7 B. Kraeutler and A. J. Bard, J. Am. Chem. Soc., 1978, 100, 5985. 8 B. Kraeutler and A. J. Bard, J. Am. Chem. Soc., 1978, 100, 2239. 9 A. Sclafani, L. Palmisano, M. Schiavello and V. Augugliaro, New
J. Chem., 1988, 12, 129.
10 D. S. Muggli and J. L. Falconer, J. Catal., 1999, 187, 230. 11 P. Basu, T. H. Ballinger and J. T. Yates, Jr., Rev. Sci. Instrum.,
1988, 59, 1321.
12 J. C. S. Wong, A. Linsbigler, G. Lu, J. Fan and J. Y. Yates, Jr., J. Phys. Chem., 1995, 99, 335.
13 Y. Suda, T. Morimoto and M. Nagao, L angmuir, 1987, 3, 99. 14 J. G. Calvert and J. N. Pitts, Jr., Photochemistry, John Wiley &
Sons, New York, 1966.
15 R. C. Herman and R. Hofstadter, J. Chem. Phys., 1938, 6, 534. 16 C.-C. Chuang, W.-C. Wu, M.-C. Huang, I.-C. Huang and J.-L.
Lin, J. Catal., 1999, 185, 423.
17 K. Nakamoto, Infrared and Raman Spectra of Inorganic and Coordination Compounds, Wiley, New York, 4th edn., 1986, pp. 232È233.
18 C. M. Wang, A. Heller and H. Gerischer, J. Am. Chem. Soc., 1992, 114, 5230.
19 C.-C. Chuang, C.-C. Chen and J.-L. Lin, J. Phys. Chem. B, 1999, 103, 2439.
20 T he Aldrich L ibrary of FT -IR Spectra, Aldrich, Milwaukee, 1st edn., 1985.
21 J.-L. Lin and B. E. Bent, J. Am. Chem. Soc., 1993, 115, 2849. 22 J.-L. Lin and B. E. Bent, J. Phys. Chem., 1993, 97, 9713.
23 D. W. Squire, C. S. Dulcey and M. C. Lin, Chem. Phys. L ett., 1985, 116, 525.
24 J. R. Creighton, Surf. Sci., 1990, 234, 287.
25 X.-L. Zhou, S. R. Coonand and J. M. White, J. Chem. Phys., 1991, 94, 1613.
26 J. G. SaraÐn and C. M. Friend, J. Am. Chem. Soc., 1989, 111, 8967.
27 J. Schwitzgebel, J. G. Ekerdt, H. Gerischer and A. Heller, J. Phys. Chem., 1995, 99, 5638.