Establishment and Implementation of Source Water Implementation Plan for Water Treatment Plants in Taiwan
E.-E. Chang
1; Yi-Li Lin
2; and Pen-Chi Chiang
3Abstract: In accordance with the source water implementation plan rule共SWIPR兲 in Taiwan, water treatment plants 共WTPs兲 with source water parameters exceeding the source water quality standards are required to submit a source water implementation plan to improve the source water and drinking water quality. In this study, the SWIPR was analyzed, and the concept of comprehensive performance evaluation共CPE兲 was applied for upgrading the performance of WTPs. Three WTPs 关Da-Nan WTP 共Type 1兲, Liu-Du WTP 共Type 2兲, and Chen-Chin-Lake WTP共Type 3兲兴 were selected as demonstration projects. A CPE team was established to evaluate the operations of these WTPs and make recommendations for improving the performance of the WTPs to achieve the drinking water standards. This paper describes the analysis and recommendations of the CPE team.
DOI: 10.1061/共ASCE兲1090-025X共2007兲11:1共2兲
CE Database subject headings: Water quality; Water treatment plants; Taiwan.
Introduction
Population growth and industrial development are two major fac- tors causing increases in water consumption in Taiwan. Further, the quantity and quality of source water are deteriorating because of overuse and heavy loading of point and nonpoint pollution, such as human activities, domestic wastewaters, and agricultural discharges. To protect water resources from deterioration and to protect public health, it is important to establish and enforce source water and drinking water quality standards.
As Taiwan has limited water sources, it is crucial to protect and improve the existing source water quality and conserve the water resource. For those water treatment plants 共WTPs兲 that have poor source water quality, along with their parent company, Taiwan Water Company, a source water implementation plan 共SWIP兲 is required to be submitted to the Taiwan Environmental Protection Agency共EPA兲. Along with the submittal of the SWIP, an evaluation and modification program of the existing water treatment units based on the concept of comprehensive perfor- mance evaluation 共CPE兲 must be implemented. The CPE is a process for evaluating a WTP’s design capabilities and associated administrative, operational, and maintenance practices of the fa- cility in a systematic way to achieve optimum performance of the facility 共USEPA 1998兲. After comprehensive evaluation of the
facility, the CPE expert team recommends an improvement plan which should be implemented by the WTP’s staffs. This evalua- tion process is intended to provide recommendations to the water industry for upgrading their existing facilities or improving the treatment processes if the source water quality at those facilities cannot meet the standards.
The objective of this research is to analyze the general prin- ciples of the source water implementation plan rule共SWIPR兲 for protecting the source water as well as ensuring the safe drinking water in Taiwan. The source water and drinking water quality standards in Taiwan also were reviewed. Three WTPs were cho- sen as demonstration projects and were assessed in accordance with the CPE process to comply with SWIPR. The implementa- tion process and assessment outcomes for those WTPs were re- vealed throughout this investigation.
General Principles of the Source Water Implementation Plan Rule
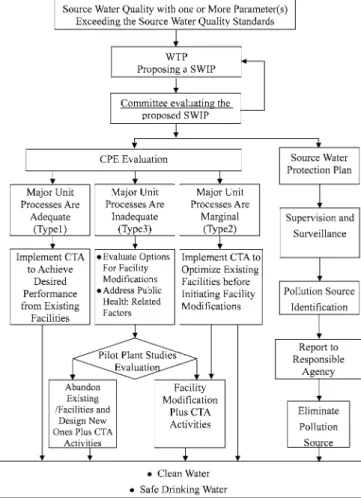
In Taiwan, a WTP is required to produce safe drinking water and to protect source water entering into the treatment plan 共Fig. 1兲.
Therefore, it is imperative for WTPs to establish procedures to implement the source water and drinking water quality standards.
In Taiwan, the SWIPR was promulgated to integrate the CPE technique into source water protection. The history of the Taiwan- ese water quality standards and implementation of SWIPR at three demonstration sites are shown in the following.
Drinking Water Quality Standards
The current Drinking Water Management Act was promulgated by the Taiwanese Presidential Office and became effective in November 1972, as amended in May 1997. Article 6 of the Act requires that surface water and groundwater meet drinking water quality standards prior to being used for drinking water.
1Dept. of Biochemistry, Taipei Medical Univ., 250 Wu-Hsing St., Taipei, Taiwan, Republic of China.
2Graduate Institute of Environmental Engineering, National Taiwan Univ., 71 Chou-Shan Rd., Taipei, Taiwan, Republic of China 共corresponding author兲. E-mail: f88541104@ntu.edu.tw
3Graduate Institute of Environmental Engineering, National Taiwan Univ., 71 Chou-Shan Rd., Taipei, Taiwan, Republic of China.
Note. Discussion open until June 1, 2007. Separate discussions must be submitted for individual papers. To extend the closing date by one month, a written request must be filed with the ASCE Managing Editor.
The manuscript for this paper was submitted for review and possible publication on May 9, 2006; approved on May 12, 2006. This paper is part of the Practice Periodical of Hazardous, Toxic, and Radioactive Waste Management, Vol. 11, No. 1, January 1, 2007. ©ASCE, ISSN 1090-025X/2007/1-2–10/$25.00.
Drinking water quality standards that were enacted in Taiwan in 1972 included 37 bacteriological, chemical, physical, and radionucleic parameters共Yeh et al. 1997兲. The latest revision con- tains 52 regulated parameters that are classified into three catego- ries:共1兲 microbial parameters, including coliform group and total bacterial count;共2兲 physical parameters, including odor, turbidity, and color; and共3兲 chemical parameters including volatile organic compounds, synthetically organic compounds, and heavy metals.
The latest revisions to the drinking water quality standards were incorporated in the regulations implementing the Act in February 1998.
Source Water Quality Standards
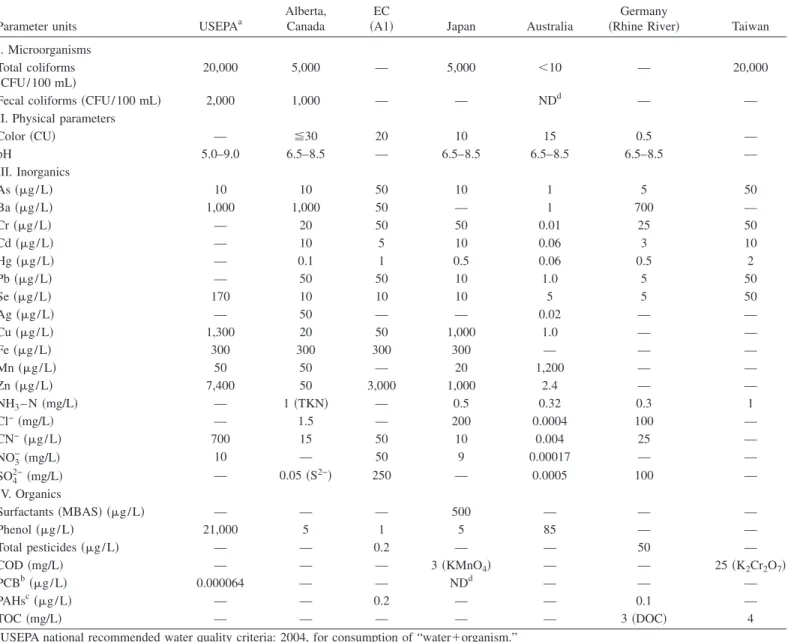
The Taiwanese source water quality standards were promulgated by the Taiwan EPA in 1997. A comparison of source water quality criteria/standards in various nations is shown in Table 1 共EEC 1975; EHD 2003; NHMRC 1996; USEPA 2004; Chang et al.
2005兲. If a WTP is found to use unacceptable source water, it may be subject to a fine or halt the source water usage. Halting source water usage was not a viable option because of difficulty in ob- taining new drinking water sources. Therefore, the Taiwan EPA promulgated SWIPR to guide WTPs with poor source water in protecting source water quality and improving the performance of existing water treatment facilities in providing safe drinking water.
Source Water Implementation Plan Rule
The SWIPR was promulgated in November 1997 by the Taiwan EPA. The purpose of this rule is to protect source water and adopt the CPE process suggested by the USEPA to improve WTP per- formance共1991兲. The CPE technique uses a rating system to clas- sify each major treatment process as Types 1, 2, or 3 共USEPA 1998兲. The methodology to determine the process type is based on the capability of the specific unit process in treating water. A unit process would be rated Type 1 if its operating capacity ex- ceeds the peak instantaneous operating flow rate; Type 2 if its capacity is 80–100% of the peak flow; or Type 3 if its operating capacity is less than 80% of the peak flow. The performance problems associated with Type 1 plants are likely to be related to plant operation, maintenance, and/or administration, which may be improved by technical assistance. Type 2 plants need to pro- vide minor process improvements to meet performance goals.
Type 3 facilities require major modifications to achieve perfor- mance objectives. A comprehensive assessment of the facility’s operating capacity is made by the CPE team, and the performance-limiting factors are determined in order to imple- ment the comprehensive technical assistance共CTA兲 technique to achieve the desired water quality at optimal performance. After completing the CPE process, a CTA may be implemented for facility improvement in the WTP.
The SWIPR requires that the WTP manager submit and imple- ment the SWIP. The SWIP is for upgrading the existing facilities or installing advanced treatment processes when the quality of the source water entering the plant is not in compliance with the source water quality standards. The SWIP needs to include the following items:
1. Basic information regarding the WTP facility;
2. Population of the region and the amount of water supplied;
3. Inspection data that include statistical tables and figures, for the water quality parameters not meeting the source water quality standards; and
4. Inspection plans and emergency response plans during the period of executing the SWIP.
When executing the SWIP, the WTP manager is required to submit a water quality report to evaluate if the water quality pa- rameter共s兲 exceeds the source water quality standards in five con- secutive inspections.
If any parameter of the source water quality is not in compli- ance with the source water quality standards after the fifth inspec- tion, the plant manager will be fined between 60,000 and 600,000 NT dollars 共approximately 1,890–18,900 USD兲; or the usage of the source water will be halted. The source water is allowed to be used again only after the SWIP is approved by the Taiwan EPA.
Taiwan EPA invites experts, scholars, and related institutions to form a review committee to evaluate the proposed SWIP. If the proposed plan is approved by the Taiwan EPA, the water plant manager must execute the implementation plan and submit progress reports to the Taiwan EPA and the local responsible agency. For a proposed SWIP with an execution period of less than six months, progress reports must be submitted monthly; for a proposed SWIP with an execution period of more than six months, progress reports must be submitted every three months. If necessary, the Taiwan EPA or the local responsible agency may invite the reviewers to audit the achievements on site. If the evaluation cannot meet the requirements of SWIPR, the previ- ously approved SWIP will be revoked and the WTP will be re- quired to shut down.
Fig. 1. Operational procedure for a WTP to excuse a SWIP
Fig. 1 shows the operational procedures for a WTP to execute an SWIP.
Methodology
Model Development and Applications for
Balancing THMs Formation and Disinfection Efficiency in Liu-Du WTP
A relatively simple model proposed by our previous study 共Chiang et al. 1997兲 derived from former researchers 共Morris and Baum 1977; Qualls and Johnson 1983; Rook 1977兲 can be used for predicting disinfection efficiency as well as trihalomethanes 共THM兲 formation at the Liu-Du WTP for executing the action recommended by the CPE team. In this model, a dispersion model, disinfection kinetics, and THM formation kinetics were
combined together. The average disinfection efficiency with given exit age distribution function and batch kinetics can be integrated as
冉
1 −NN0冊
⫻ 100%=
冉
1 −冕
0⬁冋
NN0册
batchEd冊
⫻ 100%=
再
1 −冋 冕
0b/CT冑
4d1 exp冉
−共1 − 兲4d 2冊
+
冕
b/CT⬁
冉
CTb冊
n冑
4d1 exp冉
−共1 − 兲4d 2冊 册
d冎
⫻ 100% 共1兲where d⫽0.14kW/L. The residual free chlorine and THMs forma- Table 1. Comparison of Source Water Quality Criteria/Standards in Various Nations
Parameter units USEPAa
Alberta, Canada
EC
共A1兲 Japan Australia
Germany
共Rhine River兲 Taiwan I. Microorganisms
Total coliforms
共CFU/100 mL兲 20,000 5,000 — 5,000 ⬍10 — 20,000
Fecal coliforms共CFU/100 mL兲 2,000 1,000 — — NDd — —
II. Physical parameters
Color共CU兲 — ⬉30 20 10 15 0.5 —
pH 5.0–9.0 6.5–8.5 — 6.5–8.5 6.5–8.5 6.5–8.5 —
III. Inorganics
As共g/L兲 10 10 50 10 1 5 50
Ba共g/L兲 1,000 1,000 50 — 1 700 —
Cr共g/L兲 — 20 50 50 0.01 25 50
Cd共g/L兲 — 10 5 10 0.06 3 10
Hg共g/L兲 — 0.1 1 0.5 0.06 0.5 2
Pb共g/L兲 — 50 50 10 1.0 5 50
Se共g/L兲 170 10 10 10 5 5 50
Ag共g/L兲 — 50 — — 0.02 — —
Cu共g/L兲 1,300 20 50 1,000 1.0 — —
Fe共g/L兲 300 300 300 300 — — —
Mn共g/L兲 50 50 — 20 1,200 — —
Zn共g/L兲 7,400 50 3,000 1,000 2.4 — —
NH3– N共mg/L兲 — 1共TKN兲 — 0.5 0.32 0.3 1
Cl−共mg/L兲 — 1.5 — 200 0.0004 100 —
CN−共g/L兲 700 15 50 10 0.004 25 —
NO3−共mg/L兲 10 — 50 9 0.00017 — —
SO42−共mg/L兲 — 0.05共S2−兲 250 — 0.0005 100 —
IV. Organics
Surfactants共MBAS兲 共g/L兲 — — — 500 — — —
Phenol共g/L兲 21,000 5 1 5 85 — —
Total pesticides共g/L兲 — — 0.2 — — 50 —
COD共mg/L兲 — — — 3共KMnO4兲 — — 25共K2Cr2O7兲
PCBb共g/L兲 0.000064 — — NDd — — —
PAHsc共g/L兲 — — 0.2 — — 0.1 —
TOC共mg/L兲 — — — — — 3共DOC兲 4
aUSEPA national recommended water quality criteria: 2004, for consumption of “water⫹organism.”
bPolychlorinated biphenyls.
cPolycyclic aromatic hydrocarbon.
dNot detectable.
tion in a continuous flow-through reactor can be obtained by
冉
关Cl关Cl22兴兴0冊
batch=
冕
0⬁
冉
关Cl关Cl22兴兴0冊
batchEd
=
冕
0⬁ 1
冑
4dexp冉
−共1 − 兲4d 2冊
exp共− k1T关TOC兴兲d共2兲 关THMs兴 =
冕
0⬁
关THMs兴batchEd =
冕
0⬁
k2关TOC兴m⫻ T ⫻ 关Cl2兴0
⫻ 1
冑
4dexp冉
−共1 − 兲4d 2冊
exp共− k1T关TOC兴兲d 共3兲 In our previous research, the value of b = 0.3, n = 2 共Chiang et al. 1997兲, k=5, k1= 4.17⫻10−4L / mg min, m = 3, and k2= 0.0152共L/mg兲m min 共Lou and Chiang 1994兲.Analytical Methods
All of the water quality parameters, such as turbidity, DOC, pH, total coliforms, and THMs, were measured for the water samples, followed by the QA/QC programs included in the Standard Meth- ods共APHA 1998兲.
Demonstration Projects of SWIP Implementations
Three WTPs participated in SWIP demonstration projects. A com- mittee reviewed each of the WTP’s SWIP and provided comments to the WTPs for implementation to improve the plants’ perfor- mance. The details of the implementation for each WTP are de- scribed in the following. The first plant, Da-Nan WTP共classified as Type 1兲, is the major WTP in the Tao-Yuan County. The total coliform concentration in the source water of this WTP occasion- ally does not meet the source water quality standards. The second WTP, the Liu-Du WTP共classified as Type 2兲, is located in Taipei County, and often has high total coliform concentrations which exceed the source water quality standards. The third WTP, the Chen-Chin-Lake WTP共classified as Type 3兲, is the major WTP in the Kaohsiung area with total hardness and NH3–N not meeting
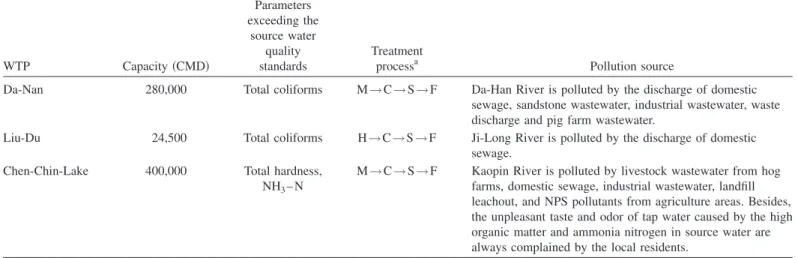
the source water quality standards. The treatment processes and pollution sources for these three WTPs are summarized in Table 2.
Type 1: Da-Nan WTP
Approximately 600,000 people live in the catchment areas of the Da-Han River which provides source water to the Da-Nan WTP.
The designed treatment capacity is 250,000 CMD 共cubic meters per day兲, and the water production rate is 280,000 CMD. The average water quality data of the source water is shown in Table 3. The occurrence percentage of source water turbidity below 100 NTU is 92.9% from December 2000 to May 2002 共shown in Fig. 2兲. Extraordinarily high values of turbidity in source water were observed after heavy rainfall caused by typhoons. The ex- traordinarily poor condition of the source water prevented the coagulation process from removing turbidity to meet the regula- tory limit. This condition resulted in a 3.6% of turbidity in clean water which does not meet the standard value of 2 NTU共shown in Fig. 3兲. The concentration profiles of total coliforms in source water are shown in Fig. 4. The profiles indicated that a total of Table 2. Background Information on Three Chosen Demonstration WTPs in Taiwan
WTP Capacity共CMD兲
Parameters exceeding the
source water quality standards
Treatment
processa Pollution source
Da-Nan 280,000 Total coliforms M→C→S→F Da-Han River is polluted by the discharge of domestic sewage, sandstone wastewater, industrial wastewater, waste discharge and pig farm wastewater.
Liu-Du 24,500 Total coliforms H→C→S→F Ji-Long River is polluted by the discharge of domestic sewage.
Chen-Chin-Lake 400,000 Total hardness, NH3– N
M→C→S→F Kaopin River is polluted by livestock wastewater from hog farms, domestic sewage, industrial wastewater, landfill leachout, and NPS pollutants from agriculture areas. Besides, the unpleasant taste and odor of tap water caused by the high organic matter and ammonia nitrogen in source water are always complained by the local residents.
aH⫽hydraulic jump tank; M⫽rapid mixing tank; C⫽coagulation basin; S⫽sedimentation tank; and F⫽rapid filtration basin.
Fig. 2. Turbidity of source water utilized by the Da-Nan WTP from December 2000 to December 2002
8.3% of the water quality data exceeded 20,000 CFU/ 100 mL and 30.8% exceeded 10,000 CFU/ 100 mL. The value of 10,000 CFU/ 100 mL is the anticipated source water quality standard for total coliforms in Taiwan. Based on the previous evidence, the Da-Nan WTP is required to develop and submit a SWIP to the Taiwanese EPA.
After the on-site evaluation of the facilities in the Da-Nan WTP, the plant was classified as Type 1. The CPE team made several recommendations to improve the plant’s performance.
First, the particulate active carbon共PAC兲 mixing intensity in the rapid mixing tank should be checked. Second, the turbidity of treated water from the rapid filtration tank should be decreased.
Third, the inspection frequencies for total coliforms in source water, sedimentation effluent, rapid filtration effluent, and clean water should be increased and the disinfection efficiency should be improved.
In response to the CPE recommendations, the WTP instituted several actions to improve the plant’s performance since June 2002. For example, a tracer test with sodium chloride was con- ducted to ensure that the PAC mixing effect in the hydraulic jump tank performed properly. It was found that the hydraulic jump provided better mixing than the current mixer in the rapid mixing tank. The addition of PAC to the source water may be modified by installing a dosage machine which would provide a fixed amount
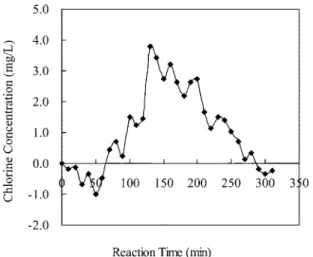
of PAC as compared to manually adding the PAC. To reduce turbidity in rapid filtration effluent, the quality of filter media is examined and replaced gradually. In Fig. 3, it is shown that after the periodic change of filter media, the turbidity of the clean water is 96.5% accumulative percentage less than the standard value共2 NTU兲 from June to December in 2002. To confirm the disinfection efficiency of total coliforms, the monitoring frequen- cies of total coliforms in source water, sedimentation effluent, rapid filtration effluent, and clean water were increased from once to twice per week. The pattern of chlorine dosage was modified so that the C⫻T 共chlorine dose-contact time兲 value of the disinfec- tion tank was 96.02 mg min/ L共shown in Fig. 5兲 as suggested by the surface water treatment rule in the United States. Monitoring locations for the THMs共trihalomethanes, the most prevalent dis- infection by-products兲 in clean water also was increased from three points to five points per month. Monitoring results of THMs revealed that all the averaged THM concentrations are below the standard value共80 g/L兲, and the concentration of THMs in the distribution system is shown in Fig. 6.
The SWIP also is implemented by patrolling the pollutant sources in the catchment area of source water twice a week, pho- tographing evidence for pollution actions, performing the bioas- say tests, and reporting to the responsible agencies.
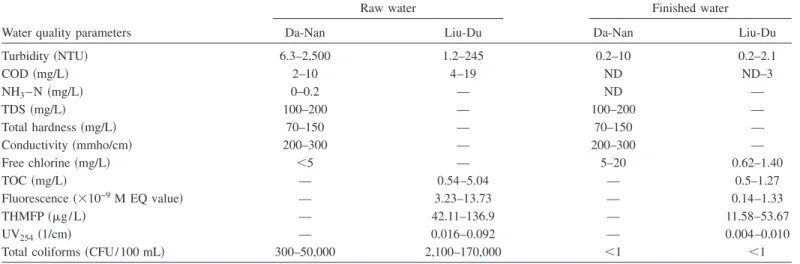
Table 3. Water Quality Data for the Da-Nan and Liu-Du WTPs in the Period of 2000–2002
Raw water Finished water
Water quality parameters Da-Nan Liu-Du Da-Nan Liu-Du
Turbidity共NTU兲 6.3–2,500 1.2–245 0.2–10 0.2–2.1
COD共mg/L兲 2–10 4–19 ND ND–3
NH3– N共mg/L兲 0–0.2 — ND —
TDS共mg/L兲 100–200 — 100–200 —
Total hardness共mg/L兲 70–150 — 70–150 —
Conductivity共mmho/cm兲 200–300 — 200–300 —
Free chlorine共mg/L兲 ⬍5 — 5–20 0.62–1.40
TOC共mg/L兲 — 0.54–5.04 — 0.5–1.27
Fluorescence共⫻10−9M EQ value兲 — 3.23–13.73 — 0.14–1.33
THMFP共g/L兲 — 42.11–136.9 — 11.58–53.67
UV254共1/cm兲 — 0.016–0.092 — 0.004–0.010
Total coliforms共CFU/100 mL兲 300–50,000 2,100–170,000 ⬍1 ⬍1
Fig. 3. Turbidity of finished water utilized by the Da-Nan WTP from December 2000 to December 2002
Fig. 4. Concentration profile of total coliforms in source water utilized by the Da-Nan WTP from December 2000 to December 2002
Type 2: Liu-Du WTP
The Liu-Du WTP is located near the Ji-Long River, which pro- vides source water to the plant with the average water quality data as shown in Table 3. During the inspection period, the source water was contaminated with total coliform that did not meet the source water quality standards 共20,000 CFU/mL兲. The total coliform contamination is caused by the discharge of domestic sewage severely polluting the Ji-Long River, especially in dry seasons. The source water also was found to have high values of turbidity 共245 NTU兲 and total organic carbon 共TOC兲 共5.04 mg/L兲, which do not meet the source water quality stan- dards共4 mg/L兲 共Taiwan EPA 2000兲. As a result, the Liu-Du WTP also was required to develop and submit an SWIP.
As the source water quality cannot be timely improved, the CPE process was performed to evaluate the performance of the existing facilities in the Liu-Du water treatment plant. After the on-site evaluation, the Liu-Du WTP was classified as a Type 2 plant. The CPE team observed several operating problems as fol- lows. First, the removal efficiency of turbidity, which ranged from 55.3 to 86.6%, was not steady. Second, the disinfection efficiency of total coliforms in the finished water tank should be monitored frequently due to high loading of total coliforms.
The CPE team recommended several actions to resolve these problems. These actions are described in the following. To in- crease turbidity removal, install two plastic cloths that are 1.2 m in depth. The cloth assists the diversion plate to increase the sedi- mentation effect of the sedimentation tank and decrease the load- ing rate of the filtration tank. Further, increase the removing frequency of the scum in the sedimentation tank and install tur- bidity monitors in each treatment unit.
The disinfection performance curves generated from the disin- fection kinetic model关Eqs. 共1兲 and 共3兲兴 may be used as the crite- ria for designing the chlorine contact chamber. Based on the Taiwanese drinking water quality standards, the acceptable disin- fection efficiency must be greater than 99.99% inactivation of total coliforms, and the allowable level of THMs must be less than 80g/L. These numerical standards may serve as opera- tional guidelines for the plant manager to install the appropriate number of baffles in the chlorine chamber to improve the effi- ciency of the disinfection process. Fig. 7 may be used to deter- mine the required chlorine doses for a given contact time and a Fig. 5. C⫻T value examination experiment of disinfection tank in
Da-Nan WTP共T10= 124.7 min, residual chlorine⫽0.77 mg/L兲 Fig. 7. Relationships among applied chlorine, contact time, and L / W ratio for 99.99% disinfection efficiency of total coliforms in the rectangular chlorine chamber in the Liu-Du WTP
Fig. 8. Effect of applied chlorine on THMs formation of inlet TOC= 3.0 mg/ L and the rectangular chlorine chamber of L / W ratio⫽20 in the Liu-Du WTP
Fig. 6. Concentration of THMs in the distribution system of Da-Nan WTP
given L/W ratio to achieve the 99.99% disinfection efficiency.
Fig. 7 also may aid in designing the chlorine contact chamber and in determining the L/W value and contact time under a given chlorine dose.
Fig. 8 shows the effect of chlorine dose on THMs formation at inlet TOC= 3.0 mg/ L and the rectangular chlorine chamber at L/W ratio= 20. To keep the THM formation below 80g/L 共the current drinking water quality standards兲 at the Liu-Du WTP, the chlorine dose had to be maintained at below 3 mg/ L for a contact basin with a L/W ratio at 20. Fig. 9 was constructed to predict the effect of TOC on THM formation at the applied chlorine dose⫽3.0 mg/L and the rectangular chlorine chamber of L/W ratio⫽20. Fig. 9 shows that THM concentrations increase linearly with TOC; the higher the TOC, the more rapid the increase in THM formation. To comply with the standard of 80g/L, the TOC concentration should be maintained below 3 mg/ L before adding disinfectant, which is consistent with results reported by Lou and Chiang 共1994兲. Fig. 10 shows the comparison between the effects of L/W ratio and TOC concentration on THM forma-
tion for applied chlorine dose⫽3.0 mg/L and contact time of 60 min. From this comparison, it is evident that there is only a small variation in THM formation for L/W ratio ranging from 2 to 70. This concludes that the geometry of a chlorine contactor af- fects the disinfection efficiency共shown in Fig. 7兲 but has minimal influence on the formation of THMs. It also may be concluded that reducing TOC prior to chlorine application is a more effec- tive tool for controlling THM formation than altering the geom- etry共L/W ratio兲 of the reactor.
Based on the previous conclusion, the application of chlorine maintained at approximately 1.0 mg/ L level at Liu-Du WTP as the most cost effective method to minimize THM formation and improve the disinfection efficiency. Under these operational con- ditions, the Liu-Du WTP may maintain an acceptable level of residual chlorine共0.2–1.0 mg/L兲 and THMs 共80 g/L兲.
Type 3: Chen-Chin-Lake WTP
The Kaopin River provides most of the source water to the Kaoshiung metropolitan area with an average flow rate of 650,000 CMD for 2,370,000 residents. The source water has been seriously contaminated by livestock wastewater from hog farms, domestic sewage, industrial wastewater, landfill leachate, and nonpoint source共NPS兲 pollutants from agriculture areas, account- ing for 52.5, 11.2, 28.8, 2.2, and 5.3%, respectively, with a total of 23,187 kg of BOD per day. In the catchment area of the Kaopin River, the Chen-Chin-Lake is the major WTP. Table 4 shows the average water quality data of Chen-Chin-Lake WTP. Although the average NH3–N level shown in Table 4 is under 1 mg/ L, several unacceptable NH3–N levels have been reported. Local residents have complained about the unpleasant taste and odor of tap water.
This situation is caused by the high organic matter and ammonia nitrogen in the source water. As a result, the Chen-Chin-Lake WTP was required to develop and submit a SWIP.
The CPE process also was used to evaluate the performance of the existing facilities at the Chen-Chin-Lake WTP. After the on-site evaluation, the Chen-Chin-Lake WTP was classified as a Type 3 plant. The CPE team observed that the performance of the conventional treatment process, i.e., flotation and the coagulation–sedimentation tanks, and floc-forming condition are not satisfactory. Further, the high NH3–N caused an overdose of Table 4. Average Water Quality Data for the Chen-Chin-Lake WTP from 1996 to 2000
Water quality parameters Source water Finished water
Turbidity共NTU兲 23.8 0.95
Bicarbonate共mg/L兲 152 137
Color共TCU兲 13 ⬍5
Total alkali共mg/L as CaCO3兲 156.9 188.9
pH 7.8 7.3
Chloride共mg/L兲 6.9 22.3
Sulfate共mg/L兲 81.8 92.8
NH3– N共mg/L兲 0.36 0.08
NO2– N共mg/L兲 0.14 ND
NO3– N共mg/L兲 1.14 1.23
TDS共mg/L兲 333 394
Total hardness共mg/L as CaCO3兲 228 257
Fe共mg/L兲 0.31 0.05
Mn共mg/L兲 0.06 0.01
Conductivity共s/cm兲 467 569
Total coliforms共CFU/100 mL兲 — —
Fig. 9. Effect of TOC on THMs formation for applied chlorine dose⫽3.0 mg/L and the rectangular chlorine chamber of L/W ratio⫽20 in the Liu-Du WTP
Fig. 10. Comparison between the effects of L / W ratio and TOC concentration on THMs formation for applied chlorine dose⫽2.0 mg/L and contact time of 60 min in the Liu-Du WTP
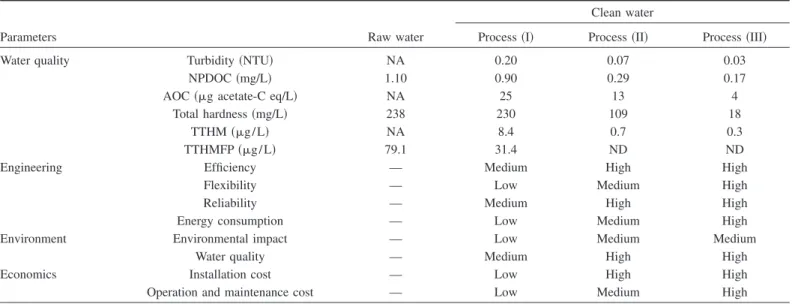
prechlorination. To alleviate these problems, pilot plant studies on process modifications of the Chen-Chin-Lake WTP were per- formed and are shown in Fig. 11. Table 5 presents the overall performance evaluation of the selected advanced treatment processes from the aspects of engineering, environment, and economy.
Among the three test processes conducted at the pilot plants, Processes 共II兲 and 共III兲 exhibit greater performance in terms of efficiency, flexibility, and reliability. As Process共II兲 is more eco- nomical than Process共III兲 for meeting the drinking water quality standards, Process共II兲 was adopted by the Chen-Chin-Lake WTP.
The processes include the preozonation, coagulation, sedimenta- tion, pellet softening, rapid filtration, postozonation, and biologi- cal activated carbon. These treatment processes are expected to achieve the following goals:共1兲 reduce the hardness from 240 to 150 mg/ L; 共2兲 replace prechlorination and postchlorination with ozonation; and共3兲 remove taste and odor by the biological acti- vated carbon filtration process. After adopting these processes, a recent study indicates that the water meets the drinking water quality standards共shown in Table 6兲.
Conclusions
Three demonstration plants were performed in accordance with the SWIPR. The existing WTPs may be evaluated and modified based on the concept of CPE. In the Da-Nan WTP共Type 1兲, a tracer test with sodium chloride revealed that a hydraulic jump should be installed to replace the existing mixer in the rapid mixing tank to provide better mixing. To reduce turbidity in rapid
filtration effluent, the filter media is examined and replaced peri- odically. With these minor modifications, the quality of the treated water will improve and meet the drinking water quality standards.
The disinfection performance curves generated from the disin- fection kinetic model for the Liu-Du WTP共Type 2兲 may be used as guidelines for improving the operation of the chlorine contact chamber. The performance code also may be used as a reference to a design engineer to determine the appropriate number of baffles for upgrading the chlorine chamber performance at the existing WTP. With this model development, the application of chlorine at about 1.0 mg/ L level at Liu-Du WTP is the most cost effective method to minimize THM formation, maximize disin- fection efficiency, and maintain an acceptable level of residual chlorine共0.2–1.0 mg/L兲 and THMs 共80 g/L兲.
For the Chen-Chin-Lake WTP共Type 3兲, advanced water treat-
Table 5. Comparison of Clean Water Quality and the Aspects of Engineering, Environment, and Economics for Different Processes in the Chen-Chin-Lake Pilot Plants
Clean water
Parameters Raw water Process共I兲 Process共II兲 Process共III兲
Water quality Turbidity共NTU兲 NA 0.20 0.07 0.03
NPDOC共mg/L兲 1.10 0.90 0.29 0.17
AOC共g acetate-C eq/L兲 NA 25 13 4
Total hardness共mg/L兲 238 230 109 18
TTHM共g/L兲 NA 8.4 0.7 0.3
TTHMFP共g/L兲 79.1 31.4 ND ND
Engineering Efficiency — Medium High High
Flexibility — Low Medium High
Reliability — Medium High High
Energy consumption — Low Medium High
Environment Environmental impact — Low Medium Medium
Water quality — Medium High High
Economics Installation cost — Low High High
Operation and maintenance cost — Low Medium High
Note: NA⫽not available; and ND⫽not detectable.
Table 6. Major Quality Parameters after Completion of Upgrading Project in the Chen-Chin-Lake WTP
Water quality parameters Design water quality
Current drinking water quality
standards 共July 2005兲
pH 6.0–8.5 6.0–8.5
Color共PCU兲 3 5
Odor共TON兲 1 3
Free residual chlorine共mg/L兲 0.5–1.0 0.2–1.0
Turbidity共NTU兲 0.2
共95% of the time兲 2 0.3
共100% of the time兲
Ammonia共mg/L兲 0.008 0.1
THM共mg/L兲 0.04 0.08
HAA共mg/L兲 0.03 —
Bromate共mg/L兲 0.008 0.01
Total hardness共mg/L as CaCO3兲 150 300
Total dissolved solids共mg/L兲 500 500
Total coliforms共CFU/100 mL兲 0 6
AOC共g acetate-C eq/L兲 50 —
Fig. 11. Processes at the pilot plant in the Chen-Chin-Lake WTP
ment processes, i.e., preozonation, coagulation, sedimentation, pellet softening, rapid filtration, postozonation, and BAC pro- cesses need to be constructed. After completing the installation of the advanced treatment units, a study indicated the following goals were achieved: 共1兲 reduction of the hardness of finished water from 240 to 150 mg/ L;共2兲 replacement of prechlorination and postchlorination with ozonation; and共3兲 removal of bad taste and odor by the biological activated carbon filtration process to meet the drinking water quality standards.
Acknowledgments
This research is supported by grants from the Taiwan EPA and Taiwan Water Company. Special thanks are extended to experts from the Taiwan water supply industry and professors from vari- ous universities for their valuable input.
Notation
The following symbols are used in this paper:
b ⫽ disinfection coefficient 共mg min/L兲;
C ⫽ effluent concentration 共mg/L兲;
C0 ⫽ influent concentration 共mg/L兲;
DL ⫽ dispersion coefficient 共m2/ min兲;
d ⫽ dimensionless molecular diffusion coefficient, dispersion index共DL/L兲;
E ⫽ dimensionless concentration 共C/C0兲;
k ⫽ nonideality coefficient in dispersion model;
k1 ⫽ rate constant of chlorination with respect to chlorine 共L/mg min兲;
k2 ⫽ rate constant of chlorination with respect to THMs formation关共L/mg兲mmin兴;
L ⫽ total length of flow pass-through baffled rectangular reactor共m兲;
m ⫽ order of chlorination reaction with respect to THMs formation;
N ⫽ number of surviving microorganisms;
N0 ⫽ number of microorganisms in influent water;
n ⫽ disinfection coefficient;
T ⫽ theoretical residence time 共min兲;
t ⫽ exit residence time 共min兲;
W ⫽ channel width of baffled rectangular reactor 共m兲;
and
⫽ dimensionless residence time 共t/T兲.
References
American Public Health Association共APHA兲. 共1998兲. Standard methods for the examination of water and wastewater, 20th Ed., Washington, D.C.
Chang, E. E., Chiang, P. C., Lin, Y. L., and Tsai, H. P.共2005兲. “Evaluation of source water quality standards for total coliforms, TOC, and COD in Taiwan.” Pract. Period. Hazard. Toxic Radioact. Waste Manage.,
9共3兲, 193–203.
Chiang, P. C., Chang, E. E., Ko, Y. W., and Lou, J. C.共1997兲. “Balancing disinfection efficiency and THM formation during chlorination: The- oretical considerations.” Can. J. Chem. Eng., 75共5兲, 892–898.
EEC. 共1975兲. “Council directives: Concerning the quality required of surface water intended for the abstraction of drinking water in the Member States.” 75/440, Official Journal of the European Communities.
Environmental Health Directorate 共EHD兲. 共2003兲. “Summary of guide- lines for Canadian drinking water quality.” Prepared by the Federal- Provincial Subcommittee on Drinking Water of the Federal-Provincial Committee of Environmental and Occupational Health.
Lou, J. C., and Chiang, P. C.共1994兲. “A study of trihalomethane forma- tion in a water distribution system.” Hazard. Waste Hazard. Mater.,
11共2兲, 333–343.
Morris, J., and Baum, B.共1977兲. “Precursors and mechanisms of halo- form formation in the chlorination of water supplies.” Galinberg Conf.
National Health and Medical Research Council共NHMRC兲. 共1996兲. “Aus- tralian drinking water guidelines.” Agricultural and Resource Man- agement Council of Australia and New Zealand, Commonwealth of Australia.
Qualls, R. G., and Johnson, J. D. 共1983兲. “Kinetics of the short-term consumption of chlorine by fulvic-acid.” Environ. Sci. Technol.,
17共11兲, 692–698.
Rook, J. J. 共1977兲. “Chlorination reactions of fulvic acids in natural- waters.” Environ. Sci. Technol., 11共5兲, 478–482.
Taiwan Environmental Protection Administration共Taiwan EPA兲. 共2000兲.
“Investigation of TOC, COD and total coliforms in source water and evaluation of source water quality standards.” EPA–89–J102–03- 1093, Taiwan, Republic of China.
United States Environmental Protection Agency 共USEPA兲. 共1998兲.
“Handbook: Optimizing water treatment plant performance using the composite correction program.” EPA/625/6-91/027, Cincinnati.
United States Environmental Protection Agency共USEPA兲. 共2004兲. “2004 edition of the drinking water standards and health advisories.” EPA/
822/R-04/005, Washington, D.C.
Yeh, J. H., Hsu, M. H., Chang, E. E., and Huang, C. P.共1997兲. “Devel- opment of statute governing drinking water and strategic plan for drinking water research in ROC.” Proc., 3rd Int. Workshop on Drink- ing Water Quality Management and Treatment Technology, Taiwan, Republic of China.