Comparison of Gas Chromatography-Mass Spectrometry Data from
Different Laboratories using Dynamic Programming
Anuradha Wijikoon
1,2, Miyako Kusano
1, Masanori Arita
1,3 1Metabolomics Research Group, Plant Science Center, Riken
2Axiohelix Corporation
3Department of Computational Biology, Graduate School of Frontier Sciences, The
University of Tokyo
AW: [email protected] MK: [email protected] MA: [email protected]
Abstract
-The standard method for non-targeted profiling in plant metabolomics is the gas chromatography-mass spectrometry (GC-MS). It produces more robust output than other chromatographic techniques linked to MS, and metabolite identification requires both retention indices (i.e., adjusted retention times) and mass spectra, which are dependent on individual experimental platforms. Here we assess two approaches of dynamic programming on annotated reliable GC-MS data from two major institutions in plant metabolomics: (1) dynamic programming approach using absolute retention indices and (2) dynamic programming approach using relative retention indices. Our result suggested the advantage of the latter method.Keywords: metabolomics, peak alignment, dynamic programming, GC-MS
1. Introduction
Mass spectrometry (MS) is the standard method for the non-targeted profiling of small molecules from biological samples. Depending on the molecules to be analyzed, MS is combined with an additional separation method such as gas- or liquid chromatography (GC and LC, respectively), or capillary electrophoresis (CE). Among them, GC-MS has been the de-facto standard in plant metabolomics because of its reproducibility and stability, and of its wide coverage of biologically important compounds. Indeed, major institutions have reported successful identification of hundreds of metabolites using GC-MS not only in cress (Arabidopsis) but also in potato, rice, and tomato [1,2,3].
The identification process uses both retention indices (RIs) from chromatography and spectra
from MS. The standard strategy first aligns chromatograms from the samples of identical background, and then identifies peak components that are well conserved across samples [4]. The size of each raw chromatogram from MS is around 2 gigabytes and the computational cost for the alignment is expensive. In the software program by Jonsson et al. [5], therefore, chromatograms are divided into several time windows, each of which undergoes 1) baseline adjustment, 2) noise reduction, and 3) peak alignment. Candidate peaks thus identified are searched against a reference library for similar RIs and spectra. Successfully identified peaks are annotated with their metabolite names (i.e. identified compounds), whereas unidentified but consistently observed peaks are annotated as mass spectral tags (MSTs). In order to ensure the accuracy, each committed institution usually prepares its own reference library, consisting of measurements of commercially available standard metabolites on its own platform.
The above strategy can be applied to a sample set of different biological backgrounds. In the authors’ previous report, total 40 Arabidopsis data from 3 genetic backgrounds were aligned and analyzed [6]. Among the extracted 518 peaks, 98 and 77 peaks were annotated as known metabolites and MSTs, respectively.
This annotation process requires an expert’s knowledge and experience. No separation method is perfect, and many metabolites co-elute, or at least overlap, in the chromatography step (i.e. multiple metabolites for the same RI). The same metabolite may obtain multiple RIs due to different degrees of derivatization and ionization. Retention-time drift is also problematic; peaks of
the same metabolite may have different RIs in different experiments at different institutions. For these reasons, the number of observed peaks is usually much larger than the number of detectable metabolites. Extracted raw peaks must be manually verified by an expert for their possible overlaps or excessive separations. In our previous work, only 171 peaks (known metabolites or MSTs) out of 518 were annotated, and the rest were abandoned as noise even though they were consistently observed. It is therefore natural that a comparison method across institutions is needed to verify and refine annotation, and to hopefully increase the number of identified metabolites.
Even on the common experimental platform, comparing data across institutions is not straightforward. Extracted peak lists are the result of profile alignments for different analyses with different biological and software parameters [4]. In GC-MS analysis, it is common that the same metabolites obtain multiple RIs. Moreover, the genotype of the standard sample (often called a wild-type, e.g. Col-0 in Arabidopsis) may not be identical across institutions. To assess the possibility of inter-institutional comparison, we present here a dynamic programming approach to align extracted peak lists from chromatograms.
Dynamic programming (DP), a well known solution for DNA sequence comparison, has already been applied to chromatographic peak-alignments. Nielsen et al. reported a DP approach to find nearly best correlation between LC-MS chromatograms a decade ago [7], and Johnson et al. utilized RIs for peak alignments [8]. These alignment methods rely on absolute RIs: closer peaks are aligned preferentially. The same is true for other approaches such as peak clustering [9]. In other words, these methods are designed for homogeneous data from a single institution.
Advancement was recently made for GC-MS data by Robinson et al [10]. They used a combination of RIs and mass spectra using the following similarity function between peaks i and j in their dynamic programming:
C t t j i S j i P i j 2 ) ( exp ) , ( ) , ( (1)
In this equation, S(i, j) refers to the similarity of mass spectra between peaks i and j, ti and tj are their RIs, and C is the user-defined tolerance parameter that adjusts the importance of time differences to the overall peak similarity. This approach can flexibly align chromatograms
considering the similarity of mass spectra and covers nonlinear time drifts by adjusting the value C. However, it still uses absolute RIs: for chromatograms with an overall shift, it will assign many small penalties for all peak pairs with a shift, instead of introducing a single ‘gap’ corresponding to the overall shift between chromatograms.
Here we extend the Robinson’s method to accommodate for linear time shifts, and assess its effectiveness on data from different institutions. The data we use are extracted peak lists from the hierarchical multivariate curve resolution (H-MCR) method, which is known to outperform custom software used in metabolome analysis [11]. Approximate error rates were estimated from manual annotations, and we show that our method indeed improves the alignment of peaks and that the alignment helps identify new metabolites.
2. Results
The input peak lists were provided by Riken Plant Science Center (PSC, Yokohama) and Max Planck Institute for Molecular Plant physiology (MPI-MP, Golm). MPI-MP used another peak detection- (deconvolution) process using AMDIS (See Methods). The data were independently measured for different experiments on different plant samples, and contained peaks were identified by different experts as either known, MSTs, or un-annotated. Note that each peak is characterized with a RI and a mass spectrum.
2.1 Estimation of true matches and their
retention-index shifts
The list of 54 commonly identified-as-known metabolites between the two institutions is shown in Appendix with their adjusted retention indices. RIs were adjusted by the standard molecules (alkanes), and the adjustment is reliable up to around the index 2300. Therefore in the following analysis, metabolites eluting at less than index 2300 were regarded as the true data for error estimation. When these metabolites are matched with differently annotated peaks, we call them false-positives. When these metabolites are matched with gaps, we call them false-negatives. The objective of the alignment is to minimize such false matches.
From the chart, we can tell that there is an overall shift between institutions (the average time difference between 48 metabolites is about +12). On the other hand, the average time difference for the same metabolites within each institution was
less than 5 (data not shown). Peaks of some metabolites tended to appear in a wider range of 6 or 7 (e.g. lactic acid orL-valine, data not shown). These observations justify the necessity of DP approach that can cope with overall shift. We employ Eq. 1 for our similarity function together with a gap penalty of –0.2. Since there is no mismatch penalty (range of similarity score is 0 < P(i, j) < 1), using a negative gap penalty corresponds to a strategy that aligns data as much as possible. This strategy is not necessarily suitable for peak alignments where many gaps are allowed, and we will discuss this issue later.
For the similarity of mass spectra S(i, j), the cosine correlation (dot product) is used where each peak intensity is normalized as
W = [original intensity]0.5[mass]2.
This normalization scheme was shown to be effective in our previous report and is actually used in our MassBank database for metabolite mass spectra (http://massbank.jp/) [12].
2.2 Coping with a shift in retention indices
Our DP approach basically uses the following standard recurrence relation:
) , ( ) 1 , 1 ( ) 1 , ( ) , 1 ( max ) , ( j i P j i D gp j i D gp j i D j i D (2)
where gp stands for gap penalty, and P for the peak similarity function. Each state D(i, j) keeps the alignment score, a pointer to the previous state for the traceback, and a pointer to the previously peak-matched state (the third condition in Eq. 2) skipping all gaps. The introduction of the latter pointer does not change the time complexity of the algorithm and its maintenance is straightforward: gapped states simply inherit the destination of pointers from their previous states. This pointer is used in the computation of peak similarity function (Eq. 1). For the values ti and tj, we do not use absolute RIs of spectra, but their distances from the previously matched peaks. In order to guarantee that peaks with large time-differences will not match, initial conditions D(i, 0) and D(0, j) are set only for the states with close RIs. For the rest, the initial scores are set as –∞ .
2.3 Coping with consecutive occurrence of
split peaks from identical metabolite
Extracted peak lists from the H-MCR method often include split chromatographic peaks that are consecutive in time from identical metabolites.
The multiplicity of split depends on difference of metabolite concentrations in each experimental condition and software parameters. Their mass spectra show high similarity and range for 0 to 9 time window depending on metabolites. This is an inevitable consequence from the balance between the bandwidth of elution and the resolution of peak detection. Ideally, split peaks should be compacted into a single peak with a representative retention index, but this operation is difficult because we cannot tell an ideal retention index for the metabolite. To cope with split peaks, therefore, we use a two-state gap condition. One is a standard gap-state with penalty gp1 and
the other, gp2, is a penalty for a split-peak-state,
i.e., peaks of highly similar mass spectra from identical metabolites. The DP starts from the standard gap-state, and after each single peak match, it enters the split-peak state. If no highly similar split peaks are found, it returns to the standard state. The value of gp2 must be much
smaller than the gp1 to reduce the excessive
penalties for a group of split peaks. Thus, the gp term in Eq. 2 becomes:
otherwise gp i i P if gp gp 1 2 ( 1, ) (3) where ε is a user-defined threshold close to 1.
3. Performance Analysis
We assume an ideal situation where false positives and false negatives arise due to random occurrences of (possibly similar) noise peaks. Under this assumption, introducing an overall time-shift in the alignment does not alter, on average, the matching probability with noise peaks. Therefore in discussing peak alignments, we only need to focus on the improvement of matching probability for true data. Let p1, p2,..., pn be an ideal chromatographic peaks without noise and f, g be a function that shifts or skews their RIs (but not their spectra). The chromatographic comparison in the DP process can be represented as comparing f(pi) and g(pi) for all i. They each are typically nonlinear and institution-dependent.
Proposition: If function g is linearly approximated as bf + c where scaling factor b and baseline difference c are constants, then the proposed DP method produces a better alignment score than the Robinson’s method in comparing f(pi) and g(pi).
Proof (outline): We only need to focus on true matches between f(pi) or g(pi) of total M peaks (0 <
i < M) if scores from false matches can be averaged out between f and g. Let us write Δ pi= g(pi) – f(pi) = (b–1) f(pi) + c and assume b ≠ 1. In a DP that considers absolute RIs, the total score for true matches will depend on the distance between mapped positions of ith true peak pi. The crucial part of the exponent in Eq.1 is therefore – Δ pi2 = –(b–1)2{ f(pi) – c/(1–b) }2. Whereas in the DP
of relative RIs, the total score will depend on –(Δ pi – Δ pi-1)2 = – (b–1)2{ f(pi) – f(pi-1) }2.
The performance therefore depends on the difference between f(pi-1) and the constant c/(1–b).
Case 1: Let us consider f(pi) > g(pi) with 1 > b or
f(pi) < g(pi) with 1 < b always holds. It is
straightforward that f(pi) > c/(1–b) and the DP with
relative RIs performs better.
Case 2: Let us consider f(pi) < g(pi) for 0 < i < j
and f(pi) > g(pi) for j < i < M for some j. Such j
can exist at most once when g is a linear approximation of f. The performance of relative RIs becomes worse only around j because Δ pj+1– Δ pj~ 2 Δ pj+1. For other i, the case is reduced to Case 1. Therefore, when the number of matching peaks is large, the DP with relative RIs performs better. The same idea applies to when function g is quadratically approximated or further (there can be two or more js).
4. Performance on real samples
The analysis in the previous section ignored contributions from false matches in DP and noise factors that may shift f(pi) and g(pi). Indeed, the
analysis shows that the relative DP performs worse when f(pi) – g(pi) fluctuates around zero.
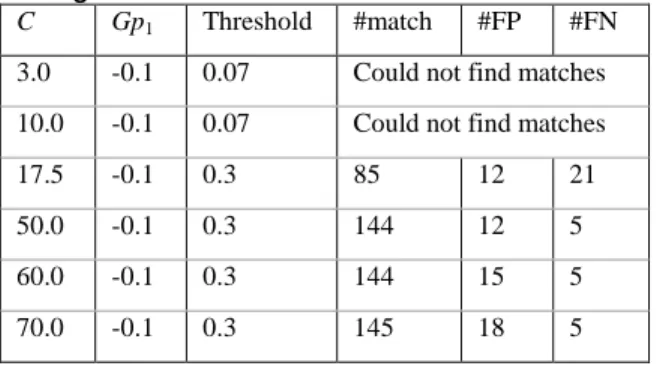
In order to test the feasibility of the relative approach, several approaches were compared on actual data. The performance of the traditional scoring scheme a la Robinson on data from Riken PSC and MPI-MP Golm is shown in Table 1. The number of peak pairs that showed similarity of more than 0.3 was computed for different tolerance parameter for retention time difference C in Eq. 1. In the similarity function Eq. 1, gap penalty of gp1was –0.1, and gap penalty for split
peaks (gp2) was unused to emulate the traditional
method. The tolerance parameter C played a crucial role. When C was small, the algorithm could not find valid matching peaks, and it must be enlarged as much as 50 to obtain valid alignment between two data. The result of our approach is summarized in Table 2. The gap penalties were gp1 = –0.2 and gp2 = –0.05, and the number of
false positives is comparable with that of Robinson’s approach at C = 10.0. The reason of smaller number of matches is because the same metabolites are counted multiple times because of
split peaks, and in both approaches, the total number of matching metabolites is almost identical. The larger number of false negatives in Table 2 is due to metabolites of large RIs (see Appendix). Metabolites in the shaded part in Appendix tended to obtain inconsistent RIs because the adjustment by standard molecules does not work well for heavy molecules. When we ignore such large molecules, our method outputs a comparable result with a much smaller value of C.
Table 1 -Performance of similarity function using absolute retention indices:
C Gp1 Threshold #match #FP #FN
3.0 -0.1 0.07 Could not find matches
10.0 -0.1 0.07 Could not find matches
17.5 -0.1 0.3 85 12 21
50.0 -0.1 0.3 144 12 5
60.0 -0.1 0.3 144 15 5
70.0 -0.1 0.3 145 18 5
Table 2 -Performance of similarity function using relative retention indices:
C Gp1 Gp2 Threshold #match #FP #FN
6.0 -0.2 -0.05 0.27 103 19 18
8.0 -0.2 -0.05 0.27 113 22 17
10.0 -0.2 -0.05 0.27 115 15 12
15.0 -0.2 -0.05 0.3 100 20 10
5. Discussion and conclusions
We developed an alignment program for outputs of GC-MS. The method uses relative retention indices in the computation and can align metabolite peaks with a smaller tolerance value. Although our method is theoretically advantageous, it did not much outperform on real samples measured at Riken and MPI-MP. The reason we believe is the ad-hoc setting of gap penalties. As described previously, negative gap penalties correspond to ‘align as much as possible’ strategy. For metabolite peaks, in contrast to biological sequence alignments, we need not maximize the number of matches; the alignment goal is the detection of highly similar mass spectra (with close retention indices) only. From this perspective, investigation of appropriate parameter values is needed as well as consideration on probabilistic alignment method [13].
Methods
The metabolite samples of Arabidopsis at Riken PSC were measured by Pegasus III TOF-MS system (Leco, St. Joseph, MI, USA) and MS data analysis including smoothing, alignment, time-window setting, and H-MCR [11] was carried out by MATLAB 7.0 (Mathworks, Natick, MA, USA). The detailed procedure is shown as in Ref. 11. The metabolite samples at MPI-MP were measured by the same platform but the temperature program was different. At PSC it started with a 2-min isothermal step at 80 ◦C followed by temperature ramping at 30 ◦C to a final temperature of 320 ◦C, which was maintained for 3.5 min. At MPI-MP, on the other hand, the temperature ramping at 15 ◦C to a final temperature of ramping was 350 °C and was maintained for 2 min at 350 °C. The difference made the time shift of retention indices. In addition, the peak detection was done by AMDIS (Automated Mass Spectral Deconvolution and Identification System, National Institute of Standards and Technology, Gaithersburg, MD, USA) at MPI-MP.
MS data of MPI-MP are downloadable from http://csbdb.mpimp-golm.mpg.de/csbdb/gmd/msri/ gmd_msri.html. The software program in Java and MS data of Riken PSC are available on request from the authors.
References
[1] Roessner U, Wagner C, Kopka J, Trethewey RN, Willmitzer L. “Simultaneous analysis of metabolites in potato tuber by gas chromatography-mass spectrometry,” Plant J., 23(1), 131-142, 2000
[2] Sato S, Soga T, Nishioka T, Tomita M. “Simultaneous determination of the main metabolites in rice leaves using capillary electrophoresis mass spectrometry and capillary electrophoresis diode array detection,” Plant J., 40(1), 151-163, 2004
[3] Schauer N, Zamir D, Fernie AR. “Metabolic profiling of leaves and fruit of wild species tomato: a survey of the Solanum lycopersicum complex,” J. Exp. Bot., 56(410), 297-307, 2005
[4] Jonsson P, Gullberg J, Nordström A, Kusano M, Kowalczyk M, Sjöström M, Moritz T. “A strategy for identifying differences in large series of metabolomic samples analyzed by GC/MS,” Anal. Chem., 76(6), 1738-1745, 2004
[5] Jonsson P, Johansson ES, Wuolikainen A, Lindberg J, Schuppe-Koistinen I, Kusano M, Sjostrom M, Trygg J, Moritz T, Antti H. “Predictive metabolite profiling applying
hierarchical multivariate curve resolution to GC-MS data-A potential tool for multi-parametric diagnosis,” J. Proteome Res., 5(6), 1407-1414, 2006
[6] Kusano M, Fukushima A, Arita M, Jonsson P, Moritz T, Kobayashi M, Hayashi N, Tohge T, Saito K. “Unbiased characterization of genotype-dependent metabolic regulations by metabolomic approach in Arabidopsis thaliana,” BMC Syst. Biol., 1:53, 2007
[7] Nielsen NPV, Carstensen JM, Smedsgaard J. “Aligning of single and multiple wavelength chromatographic profiles for chemometric data analysis using correlation optimised warping,” J. Chromatogr. A, 805, 17-35, 1998
[8] Johnson KJ, Wright BW, Jarman KH, Synovec RE. “High-speed peak matching algorithm for retention time alignment of gas chromatographic data for chemometric analysis,” J. Chromatogr. A, 996, 141-155, 2003
[9] Duran AL, Yang J, Wang L, Sumner LW. “Metabolomics spectral formatting, alignment and conversion tools (MSFACTs),” Bioinformatics, 19(17), 2283-2293, 2003
[10] Robinson MD, De Souza DP, Keen WW, Saunders EC, McConville MJ, Speed TP, Likić VA. “A dynamic programming approach for the alignment of signal peaks in multiple gas chromatography-mass spectrometry experiments,” BMC Bioinformatics, 8:419, 2007
[11] Kusano M, Fukushima A, Kobayashi M, Hayashi N, Jonsson P, Moritz M, Ebana K, Saito K. “Application of a metabolomics method combining one-dimensional and two-dimensional gas chromatography-time-of-flight/mass spectrometry to metabolic phenotyping of natural variants in rice,” J Chromatogr B. 855, 71–79, 2007
[12] Horai H, Arita M, Nishioka T “Comparison of ESI-MS Spectra in MassBank Database,” Proceedings of the International Conference on BMEI2008, Hainan China, 853-857, 2008
[13] Roshan U, Livesay DR “Probalign: Multiple sequence alignment using partition function posterior probabilities,” Bioinformatics 22(22), 2715-2721, 2006
Appendix
Annotation A: RI at MPI-MP B: RI at PSC RI (A) - RI (B) Gap A - Gap B
Lactic acid (2TMS) 1047 1055.456 -8.456 0 L-Alanine (2TMS) 1098 1099.255 -1.255 7.201 Hydroxylamine (3TMS) 1101 1114.1815 -13.1815 -11.9265 [Oxalic acid (2TMS)] 1135 1127.3762 7.6238 20.8053 L-Valine (2TMS) 1216 1209.2981 6.7019 -0.9219 Urea (2TMS) 1257 1250.1523 6.8477 0.1458 L-Serine (2TMS) 1263.1 1252.005 11.095 4.2473 Phosphoric acid (3TMS) 1277.9 1263.1842 14.7158 3.6208 L-Proline (2TMS) 1301 1294.7119 6.2881 -8.4277 Glycine (3TMS) 1310 1300.8907 9.1093 2.8212 Succinic acid (2TMS) 1320.8 1302.2823 18.5177 9.4084 Glyceric acid (3TMS) 1337.9 1315.816 22.084 3.5663 Fumaric acid (2TMS) 1358.6 1341.2135 17.3865 -4.6975 DL-Alanine (3TMS) 1362 1357.287 4.713 -12.6735 Threonic acid-1,4-lactone (2TMS) 1381 1370.8207 10.1793 5.4663 L-Threonine (3TMS) 1392 1373.4647 18.5353 8.356 Beta-Alanine (3TMS) 1431 1421.4886 9.5114 -9.0239 Malic acid (3TMS) 1491 1472.8523 18.1477 8.6363 Malic acid (3TMS) 1491.7 1472.8523 18.8477 0.7 Threitol (4TMS) 1501 1487.2462 13.7538 -5.0939 Threitol (4TMS) 1501 1488.1174 12.8826 -0.8712 Pyroglutamic acid (2TMS) 1527 1521.2041 5.7959 -7.0867 4-Aminobutyric acid (3TMS) 1530 1524.6614 5.3386 -0.4573 Erythronic acid (4TMS)] 1547 1539.0604 7.9396 2.601 L-Glutamic acid (3TMS) 1630.5 1605.2803 25.2197 17.2801 L-Glutamic acid (3TMS) 1630.6 1606.2772 24.3228 -0.8969 L-Phenylalanine (2TMS) 1634 1625.8724 8.1276 -16.1952 Xylose methoxyamine (4TMS) 1667.3 1633.0255 34.2745 26.1469 Arabinose methoxyamine (4TMS) 1673 1655.7854 17.2146 -17.0599 L-Asparagine (3TMS) 1682.5 1658.4731 24.0269 6.8123 Putrescine (4TMS) 1740 1734.6171 5.3829 -18.644 Putrescine (4TMS) 1740 1737.0466 2.9534 -2.4295 Shikimic acid (4TMS) 1819.6 1784.083 35.517 32.5636 Citric acid (4TMS) 1828 1799.074 28.926 -6.591 L(+)-Ascorbic acid {BP} 1852.4 1840.346 12.054 -16.872 Tetradecanoic acid (1TMS) 1853 1842.5693 10.4307 -1.6233 Fructose methoxyamine (5TMS) 1874 1850.5438 23.4562 13.0255 Galactose methoxyamine (5TMS) 1891 1877.512 13.488 -9.9682 Glucose methoxyamine (5TMS) 1897 1899.6471 -2.6471 -16.1351 L-Tyrosine (3TMS) 1941 1930.8958 10.1042 12.7513 Glutamine (4TMS) 2000 1990.5898 9.4102 -0.694 Hexadecanoic acid (1TMS) 2050 2040.6145 9.3855 -0.0247 [cis-Sinapinic acid (2TMS)] 2058 2050.5916 7.4084 -1.9771 myo-Inositol (6TMS) 2090.3 2079.8335 10.4665 3.0581 myo-Inositol (6TMS) 2091 2080.5232 10.4768 0.0103 9,12-(Z,Z)-Octadecadienoic acid (1TMS) 2210.9 2208.5803 2.3197 -8.1571 Spermidine (5TMS) 2253 2250.9578 2.0422 -0.2775 Fructose-6-phosphate methoxyamine (6TMS) 2318.9 2279.287 39.613 37.5708 Nicotianamine (4TMS) 2606 2562.4546 43.5454 3.9324 5-AMP (5TMS) 3079.1 3046.1636 32.9364 -10.609 alpha-Tocopherol (1TMS) 3146 3153.3408 -7.3408 -40.2772 Cholesterol (1TMS) 3154 3186.7883 -32.7883 -25.4475 Campesterol (1TMS) 3264 3298.3704 -34.3704 -1.5821 Raffinose (11TMS) 3392.6 3353.7986 38.8014 73.1718
Average (up to Spermidine) 11.6485723 0.223366