Differences in Growth Estimation and Yield Prediction of Rice Crop Using Satellites Data Simulated from Near
Ground Hyperspectral Reflectance
Chwen-Ming Yang
1Rong-Kuen Chen
2ABSTRACT
The simulated broadband data of satellites SPOT 5 and FORMOSAT-2 were mimicked from canopy high-resolution reflectance spectra measured near ground, by a field-portable spectroradiometer, and these spectral data were then used to compare the differences in growth estimation and yield prediction of rice crop relative to those of ground measurements. Reflectance of broadband sensors was acquired by using the mean value of reflectance averaging over the respective waveband regions of hyperspectral data. Results indicated that the calculated values of normalized difference vegetation index (NDVIs) from hyperspectral (i.e. NDVINB) and simulated satellites data (i.e., NDVISPOT 5 and NDVIFORMOSAT-2) were all nonlinearly distributed during the first and second cropping seasons of rice. The curves were nearly parallel to each other, but values of NDVISPOT 5 and NDVIFORMOSAT-2 were lower than those of NDVINB. The relationship between the measured leaf area index (LAImeasured) and NDVINB was best fitted to an exponential growth function, by which the estimated values of LAINB, LAISPOT 5 and LAIFORMOSAT-2 were obtained using the respective NDVIs as inputs. Values of LAINB were found higher than those of LAISPOT 5 and LAIFORMOSAT-2 on the same sampling dates yet all the estimates were lower than the corresponding values of LAImeasured after ca. 55 days after transplanting. As the simulated satellites data obtained lower values of NDVI and LAI than those of NDVINB and LAINB counterparts, yields predicted from satellites data were less than yield predicted from ground-based hyperspectral data. These predicted yields were all lower than the measured yields.
Key Words: Rice growth, Yield prediction, FORMOSAT-2, SPOT 5, Hyperspectral data.
1. Introduction
The nondestructive nature and capabilities of large scale observation and on-site monitoring makes remote sensing (RS) techniques an ideal means used for implementing practices in agricultural production processes and the current precision agriculture system.
With the techniques applied in data acquiring, timely information on the growth and development of a crop in the field can be provided as commanded, and farmland biotic and abiotic controls and resources management become a daily routine. Since details of spectral characteristics (SCs) from the target surface are detectable and discernible from the high
1 Research Fellow, Crop Science Division, Taiwan Agricultural Research Institute
2 Assistant Research Fellow, Agronomy Department, Chiayi Branch Station, TARI
Received Date: Feb. 13, 2007 Revised Date: Apr. 18, 2007 Accepted Date: Apr. 19, 2007
radiometric and visual resolution data, it opens up many new applications in areas such as agriculture, forestry, ecology, and land cover classifications.
However, correlation between SCs and related biophysical properties of crop canopy should be identified and established before any practical application to be taken in production processes (Goetz, 2002).
Many internal and external factors may impose significant influence on the correlation between biophysical traits and spectral attributes, and thus limit its applications. The spectral components are sensitive to atmospheric effect when detected from higher altitude (Liu and Huete, 1995), and may be affected by interference from soil background and surrounding shadows when obtained from lower elevation (Wiegand et al., 1990; Richardson et al., 1992; Wiegand et al., 1992; Maas, 2000). Growth status of vegetation with contributions from nutrient supply and environmental impact also play a role (Myneni et al., 1989; Barrett and Curtis, 1992; Asner, 1998; Goel, 1988). Therefore, cautions should be made in acquiring the radiometric data for the development of spectral models and in interpreting the assessment results to minimize over-fitting problem.
In this regard, as well as for improving the linkage of SCs with biophysical parameters, a number of spectral indices (SIs) which calculated by two or three SCs have been developed (Huete, 1988).
Growth traits, such as fractional vegetation cover, leaf area index (LAI) and biomass, were connected with varied indices to estimate growth and predict yield. Further extended the uses of spectral indices for evaluating stress environment, discriminating treatment levels, and assessing constraints of individual practices can be found in the literature (Kanemasu et al., 1985; Masoni et al., 1996; Clarke,
1997; Fassio and Cozzolino, 2003). Among SIs, normalized difference vegetation index (NDVI), which is defined by the spectral reflectance averaged over wavebands in red and near-infrared regions, is probably the most well known (Rouse and Haas, 1973; Rouse et al., 1974). Change of NDVI to LAI is commonly used to estimate and monitor plant growth (Yang and Chen, 2004), and has also been extended to predict yield (Chen and Yang, 2005). When values of LAI are beyond certain threshold level, however, the LAI-NDVI relationship becomes less sensitive (Yang and Chen, 2004). Soil brightness may produce large variation in NDVI at lower end of LAI (Liu and Huete, 1995), while leaves overlapping along vertical layers of canopy may change both canopy reflectance behavior and LAI-NDVI relationship at higher boundary of LAI (Curran, 1983; Carlson et al., 1990;
Carlson and Ripley 1997). At both ends of the relationship changes in NDVI with LAI become irregular and the LAI may not be precisely assessed from NDVI.
The sun synchronous satellite FORMOSAT-2 equipped with high spatial and spectral resolution broadband sensors that can generate 2-m panchromatic (520-820 nm) and 8-m multispectral images (blue band, 450-520 nm; green band, 520-600 nm; red band, 630-690 nm; and near-infrared band, 760-900 nm) with 1-day revisit rate. The multispectral images acquired by SPOT Earth observation satellites are also source of information for studying, monitoring, forecasting and managing natural resources and human activities. The multispectral wavebands of SPOT 5 are in green (500-590 nm), red (610-680 nm), near-infrared (780-890 nm) and mid-infrared (1580-1750 nm) regions. These high resolution satellite data are useful inputs for data analysis and decision making in the applications of environmental and agricultural issues.
The geometrical and radiometric resolutions are able to resolve both intra- and inter-field variability of crop conditions. By detecting within-field spatial and temporal variability of biophysical traits, a precision farm management becomes possible and may result in an increase in canopy uniformity for a better crop yield and quality (Barnes et al., 1997; Garcia et al., 2001; Johnson et al., 2001). Proper application of fertilizers can also reduce detrimental effects on public health and ecosystems (Buresh et al., 1993;
Mashima et al., 1999).
The objective were to evaluate the feasibility and compare the variability of growth estimation and yield prediction with the simulated FORMOSAT-2 and SPOT 5 spectral data mimicked from canopy high-resolution reflectance spectra measured near ground, relative to those obtained from narrow-band data and ground measurements.
2. Materials and Methods
2.1 Cultivation Practices
The cultivation scheme of this study was similar to that reported by Chen and Yang (2005). There were two field experiments conducted in the experimental farm of Taiwan Agricultural Research Institute (24°45′N, 120°54′E, elevation of 85 m) at Wufeng, Taiwan. The experiment one, carried out in the cropping seasons of 2000 to 2002, was to collect the required growth data and near ground canopy high-resolution reflectance spectra used for models’
establishment in growth estimation and yield prediction. The experimental field was divided into 20 plots with ca. 0.5 ha each. Seedlings of rice (Oryza sativa L. cv. Tainung 67) were machine transplanted to north-south rows with a density of approximately 185,000 hills ha1 (plant distance 0.18 m and row spacing 0.3 m), on 18 February 2000 and
27 February 2002 for first crops and 5 August 2000 and 3 August 2001 for second crops. Data obtained from the first crop of 2001 were not used because the spectroradiometer was in repairing and no near-ground spectral data were collected. Leaf areas were measured periodically to calculate changes in LAI along plant development. Yields were harvested at maturity to correlate with the variation of LAI.
Harvest occurred on 16 June 2000 and 25 June 2002 for first crops and 6 December 2000 and 26 November 2001 for second crops.
The pH of loamy soil (Fluvaquentic Dystrochrept) was in rage of 4.5 to 5.7 with organic matter of 0.011-0.021 kg kg-1. Three to five days after transplanting (DAT), a composite fertilizer (N:P:K2O
= 36:24:30 kg ha-1) was applied as basal dose. On 10 DAT (second crops) or 14 DAT (first crops), another composite fertilizer (N:P:K = 20:2.2:8.3 kg ha-1) was applied as the second dose. The third dose (N:P:K = 40:4.4:16.6 kg ha-1) was applied on 21 DAT (second crops) or 28 DAT (first crops). The last dose was applied (25.2 kg N ha-1) about 20 days before heading (6–8 weeks after transplanting). Herbicide butachlor (5% granule, 1.5 kg a.i. ha-1) and bentazon (44.1%
solution, 200×, 1.3 L a.i. ha-1) were applied before 7 and 21 DAT, respectively, to minimize the infestations of weeds. Rice brown planthopper [Nilaparvata lugens (Stal)] and leaffolder [Cnaphalocrocis medinalis (Guenee)] were managed with carbofuran (40% WP, 800×, 0.48 L a.i. ha-1) and stem borer (Rupella spp.) was controlled by cartap (6% granule, 1.8 kg a.i. ha-1). Validamycin A (50% S, 1000×, 0.5 L a.i. ha-1) was used to protect from the infection of sheath blight (caused by Rhizoctonia solani Kühn).
The experiment two, conducted in both first and second crops of 2001 and 2002, was to collect data for model validation. A separate experimental field
with pH of 5.60 from TARI Experimental Farm was selected. The field was applied with similar cultivation practices, but was treated with different levels of nitrogen (N) fertilizer, in form of ammonium sulfate, to produce various scales of plant growth and yield production. In first crop of 2002 and second crops of 2001 and 2002, there were six levels of N fertilizer, i.e., 0, 30, 60, 90, 120 and 150 kg N ha-1. Each quantity was divided into 3 equal dressings, sprayed on the week of transplanting, 28 DAT (second crops) or 42 DAT (first crop) after transplanting, and 21 days before heading, respectively. An extra field plot was added and treated with 180 kg N ha-1 in the first crop of 2001.
Rice seedlings were transplanted on 27 February 2001 and 27 February 2002 for first crops and on 6 August 2001 and 8 August 2002 for second crops.
Yield was harvested at various dates as a consequence of applying different levels of N fertilizer.
2.2 Growth and Spectral Measurements
Leaf area was determined by harvesting six hills of rice plants from the target region of each field plots on each sampling, using an area meter (LI-3000A, Li-Cor Inc., Lincoln, NE, USA). Leaf area index was calculated by the accumulated apparent green leaf area (m2) per unit ground area (1 m2). Two 10-m2 areas rice were harvested per field plot for the determination of yield production of each plot.
Measurements of canopy reflectance spectrum were taken at the dates of plant samplings, every two to three weeks from about 1 month after transplanting to harvest. Most parts of the reflectance spectrum were found not affected by background interference when rice crop reached more than 70% of land cover,
at about 4 weeks after transplanting. The NDVI calculations were made after that stage. Two SCs, narrow bands at red light minimum (RRED), the chlorophyll absorption maximum in photosynthetic reaction, and at near-infrared peak (RNIR), near the red-edge right end in response to vegetation covering percentage, were identified dynamically from canopy hyperspectral data during growing periods and used for the calculations of NDVINB by the equation:
(RNIR-RRED)/(RNIR+RRED). The mean values of reflectance over 630-690 nm and 760-900 nm regions were computed for simulating the reflectance values of red and near-infrared regions of FORMOSAT-2 broadband sensors, while mean values averaged over 610-680 nm and 780-890 nm were to simulate broadband reflectance of SPOT 5 satellite. Both narrow-band and broadband data were used to compare the differences in growth estimation and yield prediction relative to those of ground measurements.
A portable spectroradiometer (model GER-2600, Geophysical and Environmental Research Corp., Millbrook, NY) with 10° field-of-view (FOV) lens was used to measure the reflected radiance of target regions in a range from 330 to 2600 nm. The radiometer has two spectrometers, one measuring waveband range of 330 to 1050 nm with 1.5-nm resolution and the other measuring waveband range of 1050 to 2600 nm with 11.5-nm resolution. The band centers were rounded off to the nearest whole number in applications, and only radiance data in the 350 nm to 2400 nm range were used because of severe noise in both ends of the spectrum. A notebook computer, driven by software supplied by GER, was connected to the radiometer unit to automatically record the readings from all 537 channels. The software is able to control spectral measurements and display radiance, percentage reflectance, and other
modes for data interpretation.
The radiometer unit was mounted 5.8 m above the rice canopy surface in a nadir viewing on an adjustable mobile lift to result a sampled area 1 m in diameter. On each targeted area, a setup of four consecutive full spectral range scans was made to compute an averaged radiance spectrum, which was then divided by the radiance spectrum from a spectral reference panel (‘Spectralon’, Labsphere, Inc., North Sutton, NH, USA) of known spectral characteristics to obtain reflectance spectrum. Target measurements were collected immediately after the reference measurements for reflectance spectrum calculation.
About 15 spectra were obtained from random target regions on each field or plot each measuring day. A single mean reflectance spectrum was produced from all the spectra collected from each field or plot and used in the statistical analyses. Such practices were intended to compensate for the effects of narrow sensor FOV (10°) and low sensor height (5.8 m) so that the radiance measurements were more analogous to those obtained from the sensor at satellite altitude.
All reflectance data were collected under near cloud-free conditions between 10:00 to 13:00 local time.
2.3 Growth Estimation and Yield Prediction
The relationship between LAI and NDVI was analyzed with paired values of LAImeasured and NDVINB. All the computed NDVIs were plotted against the measured LAIs to obtain the regression equation, from which the estimates of LAINB were extracted from the fitting regression function using NDVIs as inputs. The analyses was then conducted for calculating values of NDVIFORMOSAT-2 and NDVISPOT 5, which were computed from mean reflectance values of near-infrared and red regions as
those of broadband sensors of satellites FORMOSAT-2 and SPOT 5, respectively. Values of NDVINB, NDVIFORMOSAT-2, and NDVISPOT 5 were used as inputs for the previous LAImeasured ─ NDVINB
relationship to obtain the estimates of LAINB, LAIFORMOSAT-2 and LAISPOT 5, respectively.
Correlation between grain yield and LAImeasured
was analyzed from 50 DAT to harvest. The determination coefficients (R2) from regression analyses were plotted to determine the optimal timing for predicting yield with LAImeasured. Furthermore, the quantitative relationships between the accumulated values of LAImeasured, computed from different periods during rice growth, and yields, produced under different levels of N applications, were analyzed to obtain the optimal period that may improve yield prediction with the cumulative LAImeasured. The LAImeasured was replaced by either LAINB, LAIFORMOSAT-2, or LAISPOT 5 to accumulate the values in the optimal periods for producing respective predicted yields, and the differences between predicted yields and measured yield were then compared.
2.4 STATISTICS
The statistics were carried out by using Statistical Analysis System (SAS) version 8.1 (SAS Institute, 1998) and Sigmaplot 2000 (SPSS ASC BV, the Netherlands). The dummy-variable test was used to compare differences in spectral data between different years of the same cropping season as well as between cropping seasons. Data from two years or two seasons were pooled for statistical analyses if the tests were non-significant. The root mean square error (RMSE) was calculated as ∑
=
−
= k
1 i
2 i
i X)
k (X
RMSE 1 ˆ ,
and was used to compare the precision of estimation between the measured values (Xi) and the estimated values (Xˆi).
3. Results and Analyses
A typical high-resolution reflectance spectrum of rice canopy/vegetation was plotted in Fig. 1, in which generally reflectance was low in the visible region (400-740 nm) while reflectance was high and vary significantly in the infrared region (740-2400 nm). As figure shown, characteristic narrow-bands at red light minimum (RED) and near-infrared peak (NIR) can be identified from the spectrum. During the cropping seasons, both SCs appeared dynamically along the wavelength axis of reflectance spectrum, and their reflectances (RRED and RNIR) were used for the calculations of NDVI of narrow bands (NDVINB).
To compare the relative locations between these two narrow-bands and the corresponding broadband sensors of satellites SPOT 5 (RED: 610-680 nm; NIR:
780-890 nm) and FORMOSAT-2 (RED: 630-690 nm;
NIR: 760-900 nm), the specified broadband regions were also identified in Fig. 1.
Fig. 1. A typical high-resolution reflectance spectrum of rice (Oryza sativa L. cv. TNG 67)
canopy/vegetation and the identified spectral characteristics at red light minimum (RED) and
near-infrared peak (NIR). The corresponding locations of red and near-infrared regions to the
broadband sensors of satellites SPOT 5 and FORMOSAT-2 are also identified.
Temporal changes in NDVIs from narrow-band and broadband spectral data along plant development
as the representatives of vegetation expansion were graphed in Fig. 2. The calculated values of NDVINB, NDVISPOT 5, and NDVIFORMOSAT-2 were curvilinearly distributed during the first and the second cropping seasons, increased to near heading and then decreased toward maturity. Changes in NDVISPOT 5 and NDVIFORMOSAT-2 were nearly parallel to changes in NDVINB, but with a lesser extent, indicating that values of NDVIs from the mimicked satellites broadband data were lower than those from near-ground hyperspectral data on the same sampling dates. By using the ratio-based SIs such as NDVI to correlate with biophysical traits, though in a non-linear trend, the measure can minimize the interference by both internal geometry noise and external radiation influence (Elvidge and Chen, 1995;
Gilabert et al., 1996).
Fig. 2. Temporal changes in NDVINB, NDVISPOT 5 and NDVIFORMOSAT-2 after transplanting for rice plants (Oryza sativa L. cv. TNG 67) grown in first crops of
2000 and 2002 and second crops of 2000 and 2001.
First crops
NDVI
0.0 0.3 0.6 0.9 1.2
Second crops
Days after transplanting
0 40 80 120 160
0.0 0.3 0.6 0.9 1.2
YNB=-0.208+0.026X-1.618*10-4X2 (R2=0.658, P<0.0001)
YSPOT 5=-0.271+0.027X-1.683*10-4X2 (R2=0.651, P<0.0001)
YFORMOSAT-2=-0.261+0.027X-1.673*10-4X2 (R2=0.653, P<0.0001)
YNB=0.202+0.022X-1.804*10-4X2 (R2=0.804, P<0.0001)
YSPOT 5=0.183+0.022X-1.827*10-4X2 (R2=0.804, P<0.0001)
YIFORMOSAT-2=0.174+0.022X-1.849*10-4X2 (R2=0.810, P<0.0001)
NB estimate SPOT 5 estimate FORMOSAT-2 estimate
Wavelength (nm)
0 700 1400 2100 2800
Reflectance (%)
0 15 30 45 60
NIR RNIR
RRED
RED REDSPOT 5(630-690 nm)
NIRSPOT 5(760-900 nm) REDFORMOSAT-2(610-680 nm) NIRFORMOSAT-2(780-890 nm) 1
2 3 4
5 6 7 8
1 2
3 4
5 6
7 8
Narrow-band Broadband
Information contained in satellite images and radiometric data may be extracted to the qualitative and quantitative evaluation of biophysical traits of a crop canopy in field, regional or global scale. Within growth indicators LAI is probably the most commonly used, not only in describing growth behavior of vegetation directly but also in assessing growth status upon environmental impact in many growth models indirectly (Bonan, 1993; Liu et al., 1997; Running et al., 1999). Therefore, the relationship between LAI and SIs derived from remote sensing data is often the subject of interest (Nemani et al,. 1993; Chen and Cihlar 1996;
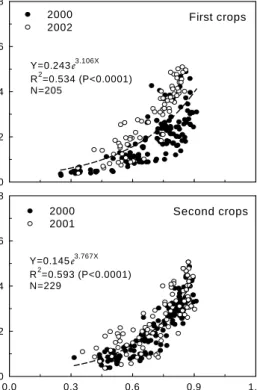
Fassnacht et al., 1997; Su and Yang 1999; Chen and Yang 2002; Yang and Chen 2004). The feasibility of using the simulated SPOT 5 and FORMOSAT-2 spectral data in estimating rice growth was examined by the intensity of the LAI-NDVI relationship. The ground truth relationship was analyzed with paired values of LAImeasured and NDVINB, and was found fitted to an exponential growth function (Fig. 3), similar to that reported by Su and Yang (1999) and Yang and Chen (2004). As that changes of LAI as a function of NDVI show a positive correlation with a fairly high coefficient of determination (R2 > 0.53), results suggest that LAI can be considered a good indicator for NDVI while NDVI may be a good parameter to estimate LAI. The relationship appears adequate for estimating and monitoring rice growth during the growing periods. However, with the exponential function, change of LAI to NDVI was less sensitive at the lower end of NDVI, a further increase in LAI results in only small and asymptotic increase in NDVI, and may exhibit ‘over-fitting’
problem due to the saturation of reflectance scale at the upper end of NDVI, a rapid increase in LAI with a little variation in NDVI (Gilabert et al., 1996; Yang and Su, 1998; Yang and Chen, 2004).
Fig. 3. The relationship between LAImeasured and NDVINB for rice (Oryza sativa L. cv. TNG 67) plants grown in the first cropping seasons of 2000 and 2002 and the second cropping seasons of 2000 and 2001.
Additionally, large scatter was observed by the pooling of heterogeneous data of the same cropping season from different years, indicating that there may have a high internal heterogeneity over canopy between years due to variation in environmental factors. Differences in the patterns of LAI-NDVI relationship between cropping seasons also implied that model developed in first crops may not suitable for model developed in second crops. Nevertheless, such variations in LAI suggest that there is a space for precision management by which data of LAI variation may be incorporated as inputs (Yang and Chen, 2005). Management strategies or recommendations can then be formulated and field spots with low LAIs could be potentially improved through a differential site-specific treatment, especially during the early stages of growth. With the
First crops
LAImeasured 0 2 4 6 8
Second crops
NDVINB
0.0 0.3 0.6 0.9 1.2
0 2 4 6 8
Y=0.243e3.106X R2=0.534 (P<0.0001) N=205
Y=0.145e3.767X R2=0.593 (P<0.0001) N=229
2000 2002
2000 2001
high spatial and radiometric resolution satellites data such as FORMOSTA-2 and SPOT 5, a more precise LAI-NDVI relationship should be retrieved, relative to those of low resolution imageries mixing with several land cover classes in a pixel (Chen and Cihlar, 1996). The scatter effect caused by a mixture of different land covers on the spectral data is therefore greatly reduced.
Fig. 4. Temporal changes in LAImeasured, LAINB, LAISPOT 5, and LAIFORMOSAT-2 after transplanting for rice (Oryza sativa L. cv. TNG 67) plants grown in the
first cropping seasons of 2000 and 2002 and the second cropping seasons of 2000 and 2001.
By using the established LAI-NDVI relationships (Fig. 3), the estimates of LAINB, LAISPOT 5, and LAIFORMOSAT-2 may be computed by the input of the respective values of NDVINB, NDVISPOT 5, and NDVIFORMOSAT-2. Accordingly temporal distributions in LAIs can be plotted for comparisons (Fig. 4). As shown, changes in values of
LAImeasured, LAINB, LAISPOT 5, and LAIFORMOSAT-2 were all quadratic distributed during rice growth. Values of LAINB were higher than the corresponding values of LAISPOT 5 and LAIFORMOSAT-2, but the estimated LAIs were lower than the values of LAImeasured after approximately 55 DAT in both fist and second crops.
By inspecting the temporal patterns graphed in Fig. 2, the lower values of the estimated LAIs may be attributed to the lower values of the corresponding NDVIs. Although the simulated satellites spectral data are proved feasible in estimating rice growth in terms of LAI, the estimates of LAIs appeared to be under-estimated with the use of reflectance of larger bandwidths as of SPOT 5 and FORMOSAT-2. With the necessary adjustment algorithms, however, these estimates of LAI can then be re-adjusted to derive the LAI-NDVI relationship applicable for the satellites data and extended for growth monitoring and evaluation (Chen and Cihlar, 1996; Colombo et al., 2003).
As proposed by Chen and Yang (2005) that the accumulated values of LAImeasured collected from the optimal time period, from 15 days before heading (DBH) to 15 days after heading (DAH) for first crops and from 15 DBH to 10 DAH for second crops, were suitable for predicting grain yield of rice through the pre-established algorithms. This study adopted the method and also substituted the values of LAImeasured
with the values of LAINB, LAISPOT 5 and LAIFORMOSAT-2 to predict yields from varied satellites (Fig. 5). Results showed that the relationships between the estimated and the measured yields were closely related in both first and second crops.
However, yields predicted from the simulated satellites spectral data obtained a lower value than the yield predicted from the near-ground hyperspectral data, and all the predicted yields were lower than the measured yields. Since values of NDVIRFORMOSAT-2 First crops
LAI
0 2 4 6 8
Second crops
Days after transplanting
0 40 80 120 160
0 2 4 6 8
YMeasured=-4.957+0.206X-1.270*10-3X2 YNB=-2.835+0.151X-9.655*10-4X2
YSPOT 5=-2.802+0.146X-9.820*10-4X2 YFORMOSAT-2=-2.747+0.144X-9.237*10-4X2
YMeasured=-2.539+0.198X-1.583*10-3X2 YNB=-1.537+0.167XT-1.390*10-3X2 YSPOT 5=-1.484+0.161X-1.336*10-3X2 YFORMOSAT-2=-1.459+0.158X-1.313*10-3X2
RMeasured2=0.557 (P<0.0001) RNB2=0.796 (P<0.0001) RSPOT 52=0.787 (P<0.0001) RFORMOSAT-22=0.791 (P<0.0001) RMeasured2=0.636 (P<0.0001) RNB2=0.656 (P<0.0001)
RSPOT 52=0.646 (P<0.0001) RFORMOSAT-22=0.651 (P<0.0001) Measured
NB estimate
SPOT 5 estimate FORMOSAT-2 estimate
and NDVISPOT 5 were smaller than values of NDVINB
on the same sampling dates after transplanting and obtained a lower value of estimates of LAIFORMOSAT-2
and LAISPOT 5, under the same optimal periods to predict yields, yields predicted from LAIs of satellites would be expected to lower than yields predicted from LAINB of hyperspectral data. As pointed out by Murata (1975) and Yoshida (1981) that LAI plays the key role in determining source capacity and biomass accumulation, keeping larger values of LAI during heading and grain-filling periods will provide a positive effect to yield production (Shieh, 1978).
Thus, with lower cumulative values of LAI, yields predicted from simulated satellites data would result in yield underestimation.
Fig. 5. Comparisons of grain yields predicted from the simulated satellites spectral data and the near-ground hyperspectral data to the measured yields for rice (Oryza sativa L. cv. TNG 67) plants grown in the first and the second cropping seasons of
2001 and 2002.
4. Discussion
As a result, this study confirms the potential for using NDVI calculated from canopy high-resolution reflectance data to reasonably estimate growth and predict yield by transforming NDVI into LAI based on the established LAI-NDVI relationship. The approach remains feasible by using the simulated satellites broadband spectral data mimicked from ground-based canopy hyperspectral data. Since values of NDVIFORMOSAT-2 and NDVISPOT 5 were lower than values of NDVINB on the same sampling dates after transplanting, lower values of the estimated LAIFORMOSAT-2 and LAISPOT 5 were obtained, and thus output a lower level of predicted yields. Given that the nature of broadband sensors in providing under-estimated values of NDVI and LAI is tolerable and adjustable, the advantages of using satellites data such as FORMOSAT-2 and SPOT 5 in providing non-destructive real time information of plant growth status are still a promising means to be employed in precision farming system. With the yield predicted a month before harvest, suitable cultivation practices may be applied prior to harvesting for a substantial yield improvement.
In any case, before practical applications of the results yielded from this study, there still has a far step to go. The radiometric distortion caused by geometric and atmospheric effects must be considered and the linkage between satellite data and ground truth should be made. Whether the models examined and validated in the experiments are applicable to real satellite data need also to be clarified.
Acknowledgments
This work was supported by the research grants
First crops
Grain yield estimated (Mg ha-1 )
0 3 6 9 12
Second crops
Grain yieldmeasured (Mg ha-1)
0 3 6 9 12
0 3 6 9 12
YNB=0.879X (P=0.012) YSPOT 5=0.804X (P=0.015) YFORMOSAT-2=0.792X (P=0.014)
YNB=0.930X (P<0.0001) YSPOT 5=0.891X (P<0.0001) YFORMOSAT-2=0.871X (P<0.0001) NB estimate
SPOT 5 estimate FORMOSAT-2 estimate
1:1
1:1
from Council of Agriculture (90AS-4.1.1-CI-C2, 91AS-5.1.3-CI-C2, and 92AS-1.1.6-CI-C1) of the Executive Yuan of Taiwan ROC.
References
Asner, G.P. 1998. Biophysical and biological sources of variability in canopy reflectance. Remote Sens. Environ. 64:234-253.
Barnes, E.M., Pinter, P.J. Jr., Moran, M.S., and Clarke, T.R.. 1997. Remote sensing techniques for the integration of crop models with GIS. Proc. of 89th Annual Meeting of the American Society of Agronomy. Crop Sci. Soc. of Amer. and Soil Sci.
Soc. of Amer, Anaheim, CA.
Barrett, E.C., and Curtis, L.F. 1992. Introduction to Environmental Remote Sensing. In E.C. Barrett and L.F. Curtis (eds.) Introduction to Environmental Remote Sensing, 3rd Ed.
Chapman & Hall, London. 426 pp.
Bonan, GB. 1993. Importance of leaf area index and forest type when estimating photosynthesis in boreal forests. Remote Sens. Environ.
43:303-314.
Buresh, R.J., Castillo, E.G., and DE Datta, S.K. 1993.
Nitrogen losses in puddle soils as affected by timing of water deficit and nitrogen fertilizer.
Plant Soil 157:197-206.
Calson, T.N., and Riply, D.A. 1997. On the relation between NDVI, fractional vegetation cover, and leaf area index. Remote Sens. Environ.
62:241-252.
Carlson, T.N., Perry, E.M., and Schmugge, T.J.. 1990.
Remote estimation of soil moisture availability and fractional vegetation cover for agricultural fields. Agric. For. Meteorol. 52:45-69.
Chen, J.M., and Cihlar, J. 1996. Retrieving leaf area index for boreal conifer forests using Landsat
TM images. Remote Sens. Environ. 55:153-162.
Chen, R.-K., and Yang, C.-M. 2002. Estimating rice growth using ground-based hyperspectral reflectance data and simulated SPOT broad band data. (in Chinese) J. Agric. Res. China 51(4):1-18.
Chen, R.-K. and Yang, C.-M. 2005. Determining the Optimal Timing for Using LAI and NDVI to Predict Rice Yield. J. Photogram. Remote Sens.
10(3):239-254.
Clarke, T.R. 1997. An empirical approach for detecting crop water stress using multispectral airborne sensors. HortTechnology 7(1): 1-16.
Colombo, R., Bellingeri, D., Fasolini, D., and Marino, C.M. 2003. Retrieval of leaf area index in different high resolution satellite data. Remote Sens. Environ. 86:120-131.
Curran, P.J. 1983. Multispectral remote sensing for the estimation of green leaf area index. Philos.
Trans. R. Lond. Ser. A 309:257-270.
Elvidge, C.D., and Chen, Z. 1995. Comparison of broad-band and narrow-band red and near-infrared vegetation indices. Remote Sens.
Environ. 54:38-48.
Fassio, A., and Cozzolino, D. 2003. Non-destructive prediction of chemical composition in sunflower seeds by near infrared spectroscopy. Ind. Crops Prod. 20:321-329.
Fassnacht, K.S., Gower, S.T., MacKenzie, M.D., Nordheim, E.V., and Lillesand, T.M. 1997.
Estimating the leaf area index of north central Wisconsin forest using the Landsat Thematic Mapper. Remote Sens. Environ. 61:229-245.
Garcia Cidad, V., and Vrindts, E. 2001. Use of very high resolution satellite images for precision farming. p.24-33. In: Recommendations on Nitrogen Fertilization. Remote Sensing for Agriculture, Ecosystems, and Hydrology II.
Owe, M., D’Urso, G., and Zilioli, E. eds.
January 2001, Proc. of SPIE, vol.4171.
Bellingham, WA, USA.
Gilabert, M.A., Gandia, S., and Melia, J. 1996.
Analyses of spectral-biophysical relationships for a corn canopy. Remote Sens. Environ.
55:11-20.
Goel, N.S. 1988. Modes of vegetation canopy reflectance and their use in estimation of biophysical parameters from reflectance data.
Remote Sens. Rev. 4:1-212.
Goetz, S.J. 2002. Recent advances in remote sensing of biophysical variables: An overview of the special issue. Remote Sens. Environ.
79:145-146.
Huete, A.R. 1988. A soil-adjusted vegetation index (SAVI). Remote Sens. Environ. 25:295-309.
Johnson, L.F., Roczen, D., and Youkhana, S. 2001.
Vineyard canopy density mapping with Ikonos satemmlite imagery. Third International Conference on Geospatial Information in Agriculture and Forestry. Denver, Colorado. 10 pp.
Kanemasu, E.T., Asrar, G., and Yoshida, M. 1985.
Remote sensing techniques for assessing water deficits and modeling crop response.
HortScience 20:1043-1046.
Liu, Q., and Huete, A. 1995. A feedback based modification of the NDVI to minimize canopy background and atmospheric noise. IEEE Trans.
Geosci. Remote Sens. 33:457-465.
Liu, J., Chen, J.M., Cihlar, J., and Park, W.M. 1997.
A process-based Boreal ecosystem productivity simulator using remote sensing inputs. Remote Sens. Environ. 62:158-175.
Maas, S.J. 2000. Linear mixture modeling approach for estimating cotton canopy ground cover using satellite multispectral imagery. Remote Sens.
Environ. 72:304-308.
Mashima, S.I., Matsumoto, N., and KENJIRO, O.
1999. Nitrogen flow associated with agricultural practices and environmental risk in Japan. Soil Sci. Plant Nutr. 45:881-889.
Masoni, A., Ercoli, L., and Mariotti, M. 1996.
Spectral properties of leaves deficient in iron, sulfur, magnesium, and Manganese. Agron. J.
88:937-943.
Murata, Y. 1975. The effect of solar radiation, temperature and aging on net assimilation rate of crop stands-from analysis of the “Maximal Growth Rate Experiment” of IBP/PP. Proc. Crop.
Sci. Soc. Japan 44:153-159.
Myneni, R.B., Ross, J., and Asrar, G. 1989. A review on the theory of photon transport in leaf canopies. Agric. For. Meteorol. 45:1-153.
Nemani, R., Pierce, L., Running, S.W., and Band, L.
1993. Forest ecosystem processes at the watershed scale: Sensitivity to remotely sensed leaf area index estimates. Intl. J. Remote Sens.
14(13):2519-2534.
Richardson, A.J., Wiegand, C.L., Wanjura, D.F., Dusek, D., and Stiner, J.L. 1992. Multisite analysis of spectral-biophysical data for sorghum. Remote Sens. Environ. 41:71-82.
Rouse, J.W., and Haas, R.H. 1973. Monitoring vegetation systems in the great plain with ERTS.
p.309-317. Third ERTS Symposium. Vol.1.
NASA, Washington, D.C.
Rouse, J.W., Haas, R.H., Schell, J.A., Deering, D.W., and Harlan, J.C. 1974. Monitoring the vernal advancement and retrogradiation (greenwave effect) of natural vegetation. NASA/GSFC Type III report. Greenbelt, MD, USA. 371pp.
Running, S.W., Baldocchi, D.D., Turner, D.P., Gower, S.T., Bakwin, P.B., and Hibbard, K.A. 1999. A global terrestrial monitoring network integrating
tower fluxes, flask sampling, ecosystem modeling and EOS satellite data. Remote Sens.
Environ. 70:108-127.
SAS Institute. 1998. SAS/STAT user's guide. Version 8.1. SAS Inst., Cary, NC, USA.
Shieh, Y.-J. 1978. Growth and community photosynthesis of rice plants in the first and second crop seasons. (in Chinese) p.91-100. In:
Proceedings of the Symposium on the Causes of Low Yield of the Second Crop Rice in Taiwan and the Measures for Improvement. 7-8 June 1978. Taiwan Agricultural Research Institute.
Published by National Science Council, Taipei.
Su, M.-R., and Yang, C.-M. 1999. Estimation of rice growth from reflectance spectra of vegetative cover. J. Photogram. Remote Sens. 4(4):13-23.
Wiegand, C.L., Gerbermann, A.H., Gallo, K.P., Blad, B.L., and Dusek, D. 1990. Multisite analyses of spectral-biophysical data for corn. Remote Sens.
Environ. 33:1-16.
Wiegand, C.L., Maas, S.J., Aase, I.K., Hatfield, J.L., Pinter, P.J. Jr., Jackson, R.D., Kanemasu, E.T., and Lapitan, R.L. 1992. Multisite analyses of spectral-biophysical data for wheat. Remote Sens. Environ. 42:1-21.
Yang, C.-M., and Su, M.-R. 1998. Seasonal variations of reflectance spectrum and vegetation index in rice vegetation cover. p.574-593. In:
Proceedings of the 3rd Asian Crop Science Conference. April 27-May 2, 1998. Chinese Society of Agronomy. Taichung, Taiwan.
Yang, C.-M., and Chen, R.-K. 2004. Modeling rice growth using hyperspectral reflectance data.
Crop Sci. 44:1283-1290.
Yang, C.-M., and Chen, R.-K. 2005. Potential for using FORMOSAT-2data simulated by hyperspectral reflectance to estimate growth and predict yield of rice. J. Taiwan Agric. Res.
54:54-69.
Yoshida, S. 1981. Fundamentals of rice crop science.
IRRI, Los Banos, Laguna, Philippines. 269 pp.
由近地面高解析光譜模擬之不同衛星光譜資料對 水稻生長估測及產量預測產量上之差異
楊純明
1陳榮坤
2摘要
Values of LAINB were found higher than those of LAISPOT 5 and LAIFORMOSAT-2 on the same sampling dates yet all the estimates were lower than the corresponding values of LAImeasured after ca. 55 days after transplanting.
As the simulated satellites data obtained lower values of NDVI and LAI than those of NDVINB and LAINB
counterparts, yields predicted from satellites data were less than yield predicted from ground-based hyperspectral data. 本研究以近地面量測之水稻植被窄頻高解析光譜模擬法國史波特五號(SPOT 5)及臺灣福衛二號 (FORMOSAT-2)之寬頻光譜資料,俾利用於比較其等對水稻生長估測與產量預測上相對於近地面測值之差 異 。 近 地 面 植 被 高 解 析 反 射 比 光 譜(reflectance spectrum) 係 由 田 間 可 攜 式 光 譜 儀 (field-portable spectroradiometer)量測之,寬頻波段之反射比則以同波段各窄頻測值累加之平均值估算。根據試驗結果,
由高解析光譜計算之標準化差植被指數(normalized difference vegetation index, NDVINB)及模擬衛星寬頻
光譜計算之標準化差植被指數(NDVISPOT 5及NDVIFORMOSAT-2)均於一、二期稻作生育過程中呈現非線性分
佈,且分佈曲線之間幾近平行變化,惟模擬衛星光譜資料之 NDVISPOT 5與NDVIFORMOSAT-2 低於高解析光
譜之NDVINB。地面實測葉面積計算之葉面積指數(LAImeasured)與 NDVINB之關係適用於指數生長型函數,
據此將上述不同計算方式得到之 NDVIs 輸入以獲得相對估測之葉面積指數(LAINB、LAISPOT 5 及
LAIFORMOSAT-2)。結果發現約自移植後 55 天起,在同一取樣日之 LAINB估值高於LAISPOT 5及LAIFORMOSAT-2
估值,惟這些葉面積指數估值概低於相對地面實測LAImeasured值。由於利用模擬衛星寬頻光譜資料獲得之
NDVI 及 LAI 估值低於近地面高解析光譜資料估算之相 NDVINB及LAINB,因此以模擬衛星光譜資料預測
之水稻產量低於近地面光譜資料預測之產量,且均低於實測產量。
關鍵詞: 水稻生長、產量預測、福衛二號衛星、史波特五號衛星、高解析光譜
1行政院農委會農業試驗所作物組研究員
2行政院農委會農業試驗所嘉義分所農藝系助理研究員
收到日期:民國 96 年 02 月 13 日 修改日期:民國 96 年 04 月 18 日 接受日期:民國 96 年 04 月 19 日