產業推行環境管理之績效分析及其未來策略研究
施勵行
成功大學 資源工程系
(NSC 89-2416-H-006-072)
Envir onmental Per for mance and Cor por ate Envir onmental
Str ategy in Taiwan
Li-Hsing Shih
Dept. Of Resources Eng., National Cheng Kung University, Tainan, Taiwan
Abstr act
Environmental management system, ISO-14000, has been widely adopted by the industries in Taiwan. By the end of year 1999, more than 560 companies have implemented the ISO-14000 system. However, few studies were conducted on the actual environmental performance after the ISO implementation. This study focuses on the environmental performance in the corporations that have obtained the ISO certification. A survey was conducted to study various aspects of environmental performance and the related factors that affect the performance including the implementation of environmental accounting system and the adoption of green technologies. The corporate environmental strategies of these companies are also discussed herein.
The results show that implementation of ISO14000 has significantly improved the corporate environmental performance, especially on pollution reduction, environmental risk reduction and organizational improvement. On the other hand, the environmental performances on green manufacturing process and overall cost reduction are not significant. Finally, the corporate strategies are categorized into three types using cluster analysis based on their effort on environmental cost and risk evaluation and the environmental performance are quite different among the three groups of companies.
Intr oduction
Environmental management system (EMS) such as ISO-14000 has been widely adopted by the industries in Taiwan since 1996. In 1996, five companies selected and assisted by local government became the first group of companies that got ISO certification, thereby being looked as models for promoting EMS in Taiwan. After that, many local companies have acknowledged the importance of ISO-14000 not only because of the international trade pressure but also because of the environmental awareness of the Taiwan citizen. Up to this research, the end of 1999, more than 560 companies have obtained ISO-14001 certification. In terms of the number of certified companies, Taiwan ranks the fifth worldwide. Government as well as industries sees this as a great achievement and a milestone showing the effort being put in EMS. The implementation of EMS is, however, a continuous process. New regulations proposed by ISO have been announced recently and will be kept up-to-date in the near future. For example, environmental performance evaluation (EPE), life cycle assessment (LCA), corporate environmental report (CER) and environmental accounting (EA) are becoming part of ISO-14000 strongly recommended by international society. For Taiwan industries, the certification of ISO-14001 may not yet be recognized as a beginning of a long pursuit of business sustainability. To achieve the ultimate goal of EMS, local companies ought to be aware of the trend of EMS and know more about the implication of environmental performance and, thereby adjusting their company strategy for the upcoming era of business sustainability.
The goal of this study, firstly, is to investigate what the environmental performance (EP) have been achieved in the local industries that have gotten the ISO certification and how significant the related constructs appear such as technology improvement and environmental cost and risk evaluation. The second goal is to see if there are categories in terms of corporate strategy so that we can foresee the future response of these companies to the aforementioned upcoming regulation in ISO-14000 series.
2. Envir onmental per for mance and EMS implementation
Many studies have reported that the implementation of EMS, viz. ISO-14000 could produce significant environmental performance as well as other benefit for companies. Recent examples include Callan (1996), Chen et al. (1997), Wen and Chen (1998), Illinitch et al. (1998), Steger (1999), Chin and Pun (1999), Ang et al. (1999) and Ho (1999). The performance include organizational improvement, reducing risk, reducing cost, promoting corporate image, resource and energy conservation, waste reduction, and green technology development. Recent version of ISO-14031 further categorizes the EP into two groups: operational performance and managerial performance. The operational performance includes resource and energy saving, waste reduction, process improvement, recycling and so on. The managerial performance includes efficient organization, risk reduction, profit increase, public image change and so on. One of the goals of this present study is to investigate whether these EPs take place after the implementation of ISO-14000 in the local certified companies.
To improve the operational performance, the concept of life cycle assessment (LCA) needs to be used to find the operations that need change or improvement. Thereafter, technology improvement is often the solution. Many researchers, e.g., Hart (1995), Klassen and McLaughlin (1996), Chin and Pun (1999) and Klassen (1999), concluded that technology improvement is the major factor to increase the EP. The technology improvement herein often includes changing manufacturing process, changing product design, reducing
waste or emission, reuse or recycling, and pollution prevention. In this study, the second goal is hence to measure the technology improvement in the implementation process.
On the other hand, the basis of evaluating the managerial performance is to identify and evaluate the environmental cost and risk. Studies including Huang and Liu (1998), Berry and Rondinelli (1998), Lally (1998) and Anderson (1999) addressed the importance of making appropriate evaluation on environmental risk and the related cost. Environmental accounting or full accounting could provide an overall system for an appropriate environmental cost evaluation. To start an environmental accounting system, many environmental cost items need to be identified and separated from a conventional accounting system. Piasecki et al. (1999) categorized the environmental cost into conventional cost including capital and operational costs, hidden cost, contingent liability cost and the cost regarding image and public relation promotion. This study investigates what kinds of environmental cost and risk have been identified and evaluated by local corporations.
Another upcoming requirement in ISO series is corporate environmental report (CER). Many literatures discussed the importance of CER in the EMS implementation and business sustainability. Beets and Souther (1999) suggested that companies who can present a reliable CER could win the support from investors as well as general public. Freedman and Wasley (1990), Barth et al. (1997), Botosan and Sengupta (1997) and Cormier and Magnan (1999) discussed the relation between the disclosure of the company’s environmental information and the EP. Several well-known organizations such as United Nations Environmental Planning (UNEP), Public Environmental Report Initiative (PERI), the Coalition for Environmental Responsible Economics (CERES) and World Business Council for Sustainable Development (WBCSD) consider an appropriate environmental report is necessary for future competitiveness for a corporation. This study also surveys the willingness of disclosing environmental information of local industries.
In summary, the research questions addressed in this section can be stated thus: (1) What are the significant environmental performances in Taiwan industry?
(2) Does the technology improvement take place in the EMS implementation process? (3) How have the detail environmental costs been evaluated in the EMS implementation? (4) What is the industry’s inclination in disclosing environmental information as the
backbone of a CER?
3. Cor por ate str ategy and Envir onmental Per for mance
Considering the worldwide trend of business sustainability, nowadays corporations face the question of whether to make a new environmental strategy to respond the upcoming challenge. As discussed earlier, the new requirements of EMS, such as LCA, CER, EA, and green technologies, are continuously emerging in response of the pressure from government, NGOs and general public. Literatures like Hill and Jones (1996), Lau and Rogothaman (1997), and Maxwell et al. (1997) pointed out that corporations may need to respond effectively in many ways and eventually find a good strategy to turn green in the future.
Many studies therefore categorized the corporate environmental strategy and discussed the characteristics of each category. Good examples include Rondinelli and Vastag (1996), Vastag et al. (1996) and Aragon-Correa (1998). These studies suggested that the corporate environmental strategy could be categorized based on the types of environmental risks, including endogenous and exogenous risks, encountered by the corporations. For example, Vastag (1996) divided the corporate strategy into four types: reactive, strategic, crisis preventive, and proactive management approaches. Rondinelli and Vastag (1996) used a comparison table to show various characteristics of the four types of management approaches.
The categorization implies that a company’s environmental strategy strongly depends on the environmental risks that it faces. Aragon-Correa (1998) used a measure of strategic proactivity that consists of 18 items (including entrepreneurial, engineering and administration dimensions) to categorize corporate strategy and presented empirical results using cluster analysis. Recently, Klaus (1999) used the responses on environmental issues of the companies in Germany and United States to serve as the basis for cluster analysis that identified four different environmental strategies.
In light of the discussion, this study uses the effort put on environmental cost and risk evaluation in local corporations as a measure for categorizing corporate strategy. The measure denotes the company’s weighting as well as effort on the environmental cost and risk, thereby indicating the company’s strategic proactivity. The more effort was put to identify and determine environmental cost, the more active and strategic approach a company adopts. We use this measure as a basis to see if there are different categories of environmental strategy in the local industries. The study also find if there are significant differences on the EP, environmental reporting (ER), and green technology (GT) improvement among the corporations embracing different strategies.
The research questions addressed in this section can be stated:
(1) Can the corporate strategy be categorized into various types based on their weighting on various environmental cost and risk?
(2) If there are different categories of corporate strategy, are there significant differences on EP, GT, and ER among the different categories?
4. Resear ch Methods
4.1 Measur es
The research questions focus on environmental performance and other related constructs in the implementation of EMS including technology improvement; environmental cost estimation and environmental reporting. The measures on EP are divided into two groups: managerial and operational performance. The measures of managerial performance are obtained based on the guidelines suggested by ISO-14030. Four subsets of managerial performance include organizational improvement, reducing risk and liability, increasing profit, and promoting corporate image and competitiveness. Twenty-six variables are used to measure the four subsets of managerial performance (see Table 2). On the other hand, 21 variables are determined to denote the measures of three subsets of operational performance based on the guideline in ISO14030 (see Table 4). Three subsets of operational performance include energy saving, reduction of waste and pollution, and process improvement. Since the significance of the environmental performance is of interest, the managers who are responsible for implementing ISO 1400 are asked to answer subjectively questions about the degree of benefit from certification. Totally 47 questions about the managerial and operational performance from implementing ISO are measured in Likert scale of five points. Writing a “5” means that the ISO manager agrees great benefits from implementing ISO, and writing a “1” means little help from implementing ISO.
Each environmental cost item was asked to see if the environmental cost is actually identified and estimated in the responding company. Table 6 includes the environmental costs that were discussed in Piasecki et al. (1999) and CBCSD (1998). Seventeen questions were thus asked to measure the company’s effort on environmental cost evaluation. The questions are presented in a nominal scale (yes or no).
Technology improvement during the implementation of ISO-14000 is investigated in four aspects including resource and energy conservation, reuse and recycling, waste and
emission reduction, and green design and process. Nineteen variables are selected based on the studies including Klassen and McLaughlin (1996), Watson (1996), Jackson (1997), Ku (1998) and Ho (1999). Likert scale of five-point is also used to measure the variables. Writing a 5 means that the ISO manager agrees significant improvements from implementing ISO, and writing a 1 means picayune improvements from implementing ISO. Finally, the inclination of disclosing the environmental information is studied using 11 variables. The variables are selected from the checklist of environmental report suggested by UNEP, PERI, and CERES. The Likert scale of 5 points is also used herein to measure the inclination for environmental information disclosure. Writing a 5 means that the ISO manager has high inclination of disclosure, and writing a 1 means low inclination of disclosure.
4.2 Sur vey method
A survey questionnaire was mailed to 527 manufacturing registered companies on the list of directories of Bureau of Commodity Inspection and Quarantine (BCIQ) in Taiwan by the end of year 1999. The questionnaire was carefully designed based on the research questions and the measures that we presented earlier. The questionnaire includes six parts: background information, managerial performance, operational performance, technology improvement, environmental cost evaluation, and disclosure of environmental information. The initial questionnaire went through a test run in a smaller sample size including seven companies for questionnaire modification and increasing validity. The covering letter indicated our research scope and emphasized that the research results would be strictly confidential and the resulting statistics would be shared with all respondents. To increase the return rate, a subsequent questionnaire was sent if the addressee was not responding in two weeks.
The final respondents numbered 193. Of the 193 responses received, 190 were considered usable (36% of the original group). This response rate is considered satisfactory, given the usually low levels of response to mailed organizational surveys. Table 1 shows the responses from different sectors. Household and daily necessities industry has the highest response rate (84%) while the response rates of other sectors range 20% to 40%.
5. Results and Analysis
5.1 Envir onmental per for mance and other constr ucts
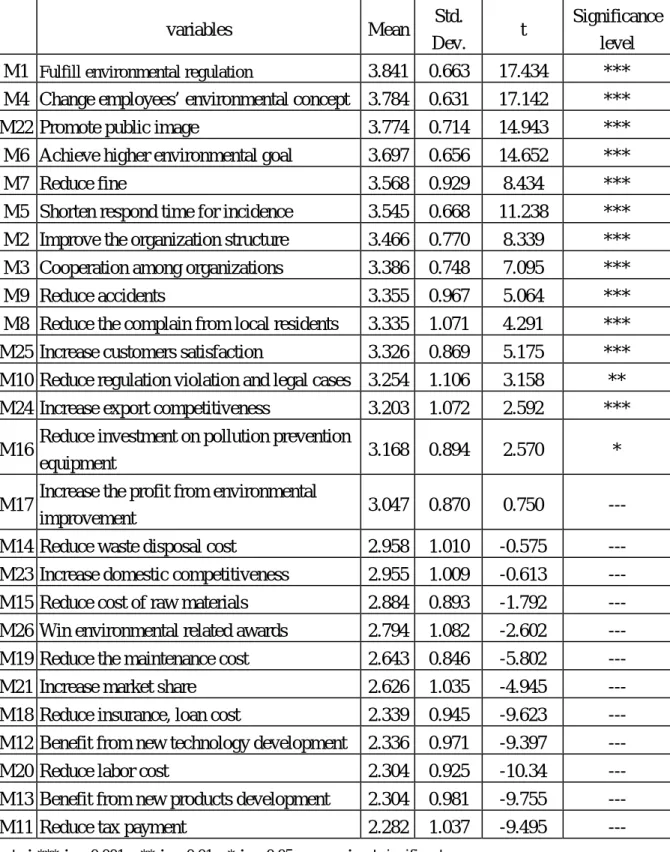
Managerial performance: Twenty-six managerial performance items were investigated to
see if each of them is significant. A null hypothesis of H0 (μ= 3) is assumed to be that the
average score of degree of benefit is 3, and the alternative hypothesis H1 (μ> 3) is assumed
to be that the average score of degree of benefit is greater than 3. The t test is used for testing
H1, and the results of t tests for each variable are shown in Table 2. All tests were performed
at a 95% confidence level (alpha = 0.05). The managerial performance items are listed in a descending order by their average score. The results show that the t tests reject the null
hypotheses for items M1, M4, M22, M6, M7, M5, M2, M3, M9, M8, M25, M10, M24 and M16. In other words, Table 2 shows that approximately a half of the managerial performances are significant while the rest of managerial performances are not significant. For example, benefits due to new material development, benefit of new product design, waste treatment cost reduction, labor cost reduction and increasing market share are not significant.
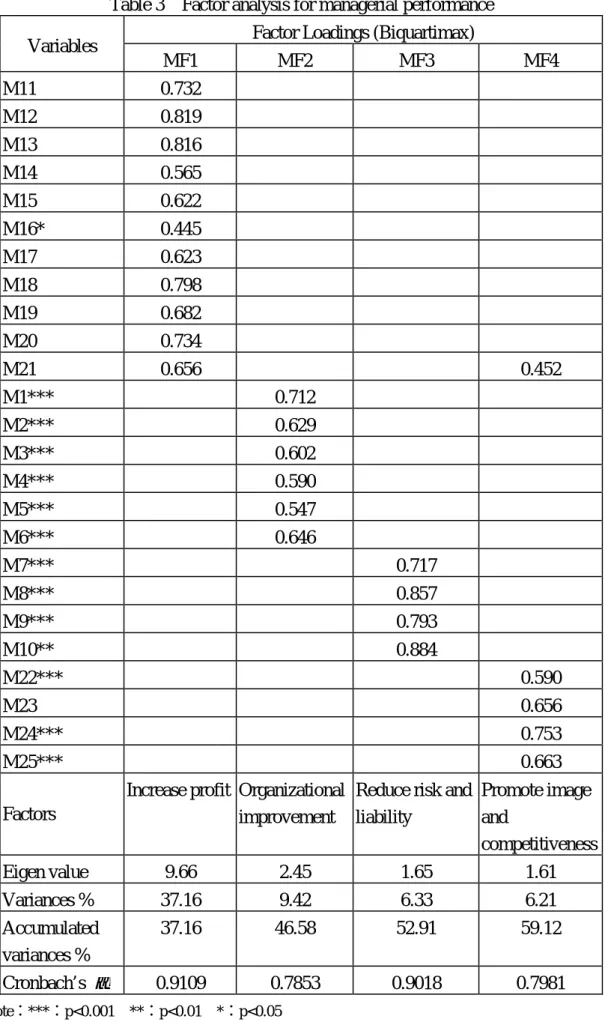
The value of Cronbach coefficient alpha for those 26 items is 0.931. The 26 items were reorganized into four factors using factor analysis. The principal component analysis method was employed. Four common factors are chosen to explain 59.12% of variances of the 26
items since these 26 items were designed to explain four managerial performance factors: organizational improvement, reducing risk and liability, increasing profit, and promoting corporate image and competitiveness. Based on the factor loading pattern of the unrotated factor matrix, interpretation would be difficult. Biquartimax rotation method is used to obtain easier explanation of four factors. Table 3 shows the results of factor analysis and the resulting factor loading. According to the guidelines of BMDP (1992), the lowest sample sizes to be considered significant would be 150 for factor loading of 0.45. Therefore, those factor loadings with a value lower than 0.45 are ignored. Note that the total amount of variance extracted is the same in the rotated solution as it was in the unrotated one. The eigen-value for each factor is 9.66, 2.45, 1.65 and 1.61, respectively. Four common factors are named: (MF1) increasing profit; (MF2) organizational improvement; (MF3) reducing risk and liability; and (MF4) promoting image and competitiveness. Note that the results of four common factors confirm our proposal of four subsets of managerial performance. The values of the Cronbach coefficient alpha for each factors are 0.911, 0.785, 0.902 and 0.798, respectively. Among them, organization improvement, reduction of risk and fine, improvement on company’s image and competitiveness are significant while reduction of total cost is not significant.
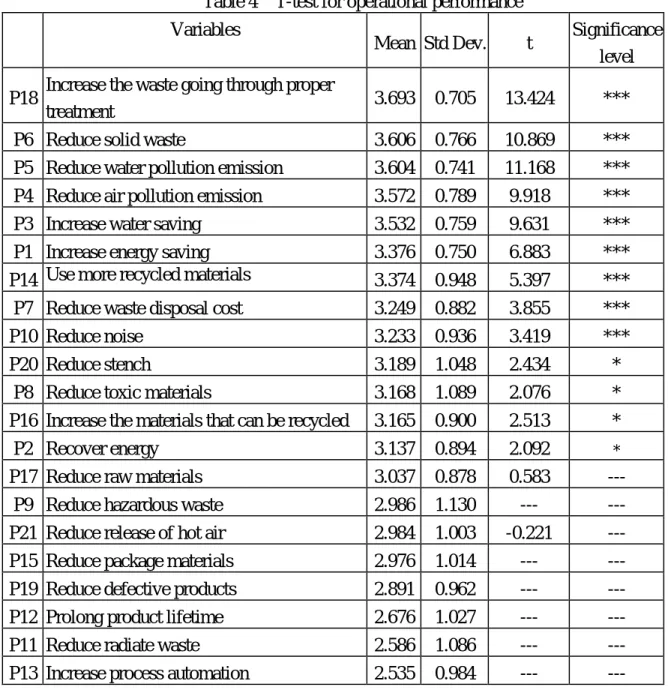
Operational performance: Twenty-one operational performance items were tested herein.
The null hypothesis is that the average score of operational performance is three (μ= 3), and the alternative hypothesis is that it is greater than three (μ> 3). The results of t-tests are
shown in Table 4. All tests were performed at a 95% confidence level (alpha = 0.05). The operational performance items are listed in a descending order by their average score. The results show that the t tests fail to reject the null hypotheses for items P17, P9, P21, P15, P19,
P12, P11 and P13. In other words, Table 4 shows that more than a half of the performances are significant while eight operational performances are not significant. For example, reducing package material, increasing the product lifetime, reducing raw material, process automation and reducing scrap volume are not significant.
The value of Cronbach coefficient alpha for those 21 items is 0.944. The 21 items were reorganized into three factors using factor analysis. The principle component analysis method was employed. Three common factors are chosen to explain 65.06% of variances of the 21 items since these 21 items were designed to explain three operational performance factors: energy saving, reducing waste and pollution, and process improvement. Based on the factor loading pattern of the unrotated factor matrix, interpretation would be difficult. Varimax rotation method is used to obtain easier explanation of three factors. Table 5 shows the results of factor analysis and the resulting factor loading. Those factor loadings with a value lower than 0.45 are ignored. The eigen-value for each factor is 10.08, 1.80 and 1.33, respectively. Three common factors are named: (PF1) reduction of special pollution; (PF2) reduction of general pollution and energy saving; and (PF3) process improvement. The values of the Cronbach coefficient alpha for the factors are 0.896, 0.889 and 0.896, respectively. Note that the results of three common factors are similar to our proposal of three subsets of operational performance. Pollution is split into two types: special and general. The general pollution including the energy saving becomes one common factor. Among the three factors, general pollution reduction is the most significant effect, while the special pollution reduction and the improvement on process management are not significant.
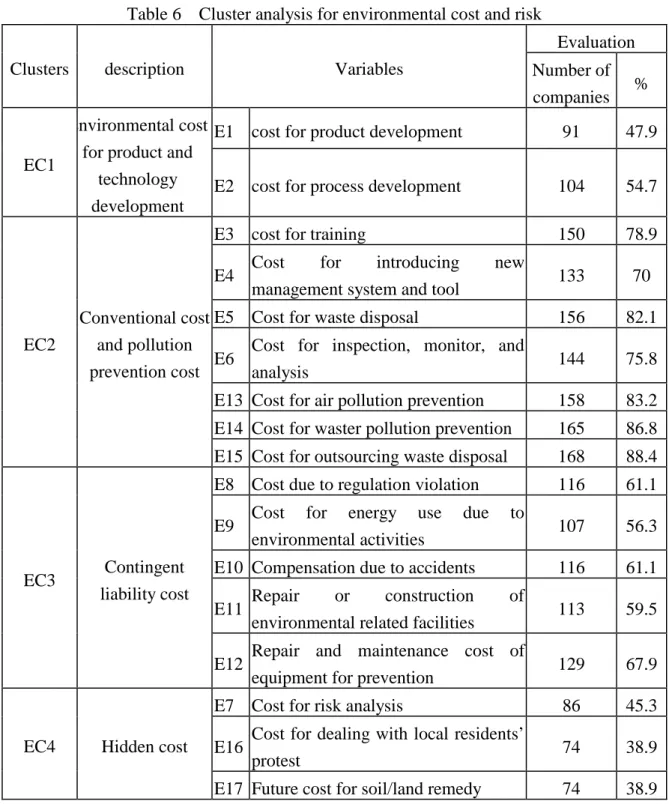
Environmental cost evaluation: Since we use nominal scale in this part of questionnaire,
cluster analysis instead of t-tests and factor analysis is used to analyze the survey results. Euclidean distance and Wald’s method are herein used in the two-stage cluster analysis. Table 6 shows that four clusters are obtained, they are EC1 (cost for R&D and green design), EC2 (conventional cost and pollution reduction cost), EC3 (contingent liability cost) and
EC4 (hidden cost). It appears that local industries put more effort on the evaluation of EC2 and EC3 (more than 55%), while EC1 and EC4 evaluation attract less attention (less than 50%).
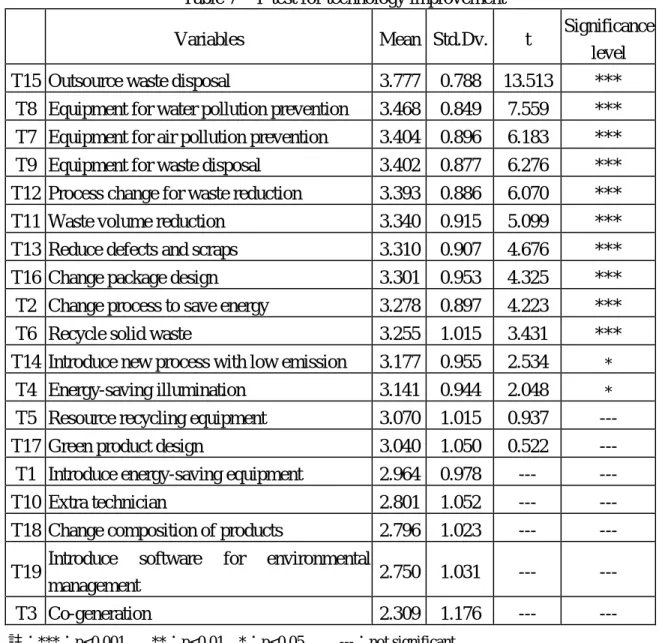
Technology improvement: Nineteen types of technology improvement were tested on
significance. The null hypothesis is that the average score of technology improvement is three (μ= 3), and the alternative hypothesis is that it is greater than three (μ> 3). The results of t-tests are shown in Table 7. All tests were performed at a 95% confidence level
(alpha = 0.05). The technology improvement items are listed in a descending order by their average score. The results show that the t tests fail to reject the null hypotheses for items T5,
T17, T1, T10, T18, T19 and T3. In other words, Table 7 shows that twelve types of the technology improvement are significant while seven are not significant. For example, selecting energy-saving technology, purchasing equipment for reuse and recycling, developing green products and use of environmental-friendly material are not significant.
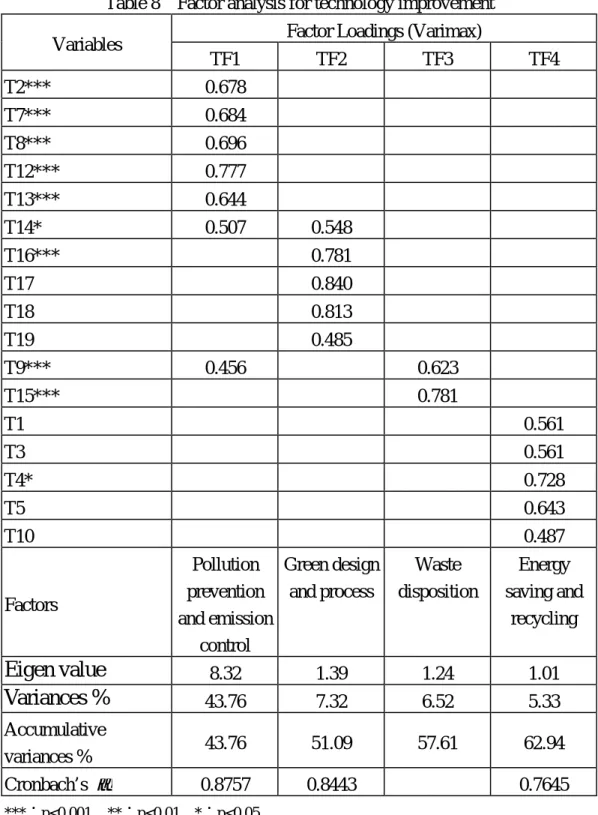
The value of Cronbach coefficient alpha for those 19 items is 0.925. The 19 items were reorganized into four factors using factor analysis. The principal component analysis method was employed. Three common factors are chosen to explain 62.94% of variances of the 19 items since each of their corresponding eigen-values is greater than one. Based on the factor loading pattern of the unrotated factor matrix, interpretation would be difficult. Varimax rotation method is used to obtain easier explanation of four factors. Table 8 shows the results of factor analysis and the resulting factor loading. Those factor loadings with a value lower than 0.45 are ignored. The eigen-value for each factor is 8.32, 1.39, 1.24 and 1.01, respectively. Four common factors are named: (TF1) pollution prevention and emission control; (TF2) green design and process; (TF3) waste disposition and (TF4) energy saving and recycling. The values of the Cronbach coefficient alpha for factors (TF1), (TF2) and (TF4) are 0.876, 0.844 and 0.765, respectively. Note that the results of three common factors are similar to our proposal of four subsets of technology improvement. “Energy conservation” and “recycling” are merged into one factor (TF4); “Waste and emission reduction” is split into two factors (TF1) and (TF3). Among the four factors, pollution prevention and emission reduction and waste disposition are significantly successful while the others including green design and manufacturing process and energy conservation and recycling are not significant.
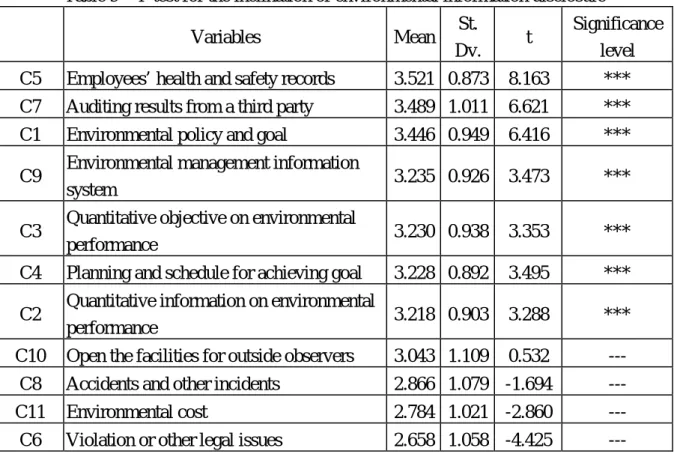
Inclination of environmental information disclosure: Eleven types of environmental
information were tested on the companies’ willingness on information disclosure. The null hypothesis is that the average score of willingness is three (μ= 3), and the alternative hypothesis is that it is greater than three (μ> 3). The results of t-tests are shown in Table 9.
All tests were performed at a 95% confidence level (alpha = 0.05). The inclination of disclosure is listed in a descending order by their average score. The results show that the t
tests fail to reject the null hypotheses for items C10, C8, C11 and C6. In other words, Table 9 shows that local industries are willing to provide more than half of the information to public excluding disclosing regulation violation, accident record, and environmental cost.
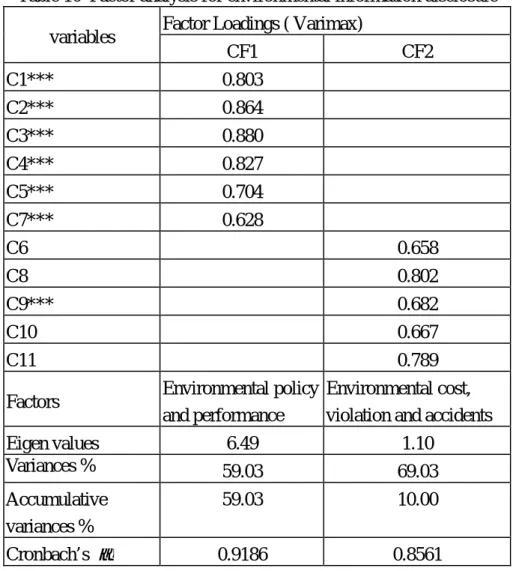
The value of Cronbach coefficient alpha for those 11 items is 0.927. The 11 items were reorganized into two factors using factor analysis. The principal component analysis method was employed. Two common factors are chosen to explain 69.03% of variances of the 11 items since each of their corresponding eigen values is greater than one. The Varimax rotation method is used to obtain appropriate interpretation of four factors. Table 10 shows the results of factor analysis and the resulting factor loading. Those factor loadings with a value lower than 0.45 are ignored. The eigen-value for each factor is 6.49 and 1.10, respectively. Two common factors are named: (CF1) environmental policy and performance;
and (CF2) environmental cost, violation and accidents. The values of the Cronbach coefficient alpha for two factors are 0.919 and 0.856, respectively. In summary, companies are more willing to disclose the general environmental performance and policy rather than violation, accidents and internal environmental cost.
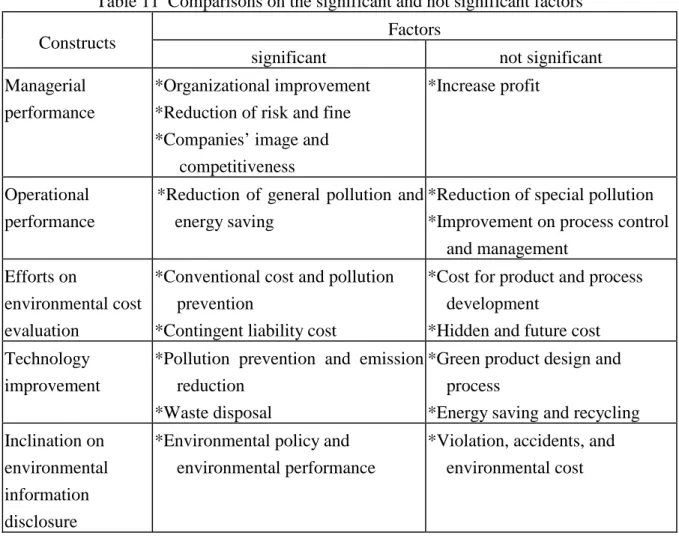
A summary of significant factors and not significant factors in each construct is provided in Table 11. In general, Taiwan’s industries have gained some general and short-term benefit while the direct benefit and long-term improvement such as the improvement on process management are not significant. The observation on benefit in the implementation of ISO-14000 can be explained by the efforts being put in terms of technology improvement and environmental cost evaluation. Short-term technology improvements such as emission reduction and waste disposition attract more attention than the long-term technology improvement such as green design and process and recycling. Similarly, the efforts on environmental cost identification and evaluation focus more on conventional and pollution prevention cost. The cost for long-term development such as product and process development and future hidden cost are not recognized and evaluated yet. As to the environmental information report, like many companies in the world, local companies tend to disclose the environmental policy and achievement instead of releasing the so-called bad records.
5.2 Envir onmental Str ategy and EP
According to the work of Vastag et al. (1996) and Rindinelli et al. (1996), corporate strategy can be categorized based on the environmental risk that a company encounters. We extend this idea to categorize the local corporate strategy based on their recognition and effort on environmental cost evaluation. In other words, a company puts more weight and effort on environmental cost and risk evaluation, it should be considered having a proactive strategy. In this section, the responses on the questions indicating a company’s effort on the environmental cost evaluation are used in a cluster analysis. The factor scores of the four factors obtained in Section 5.1 are normalized before conducting the two-stage cluster analysis where a non-hierarchy cluster analysis is conducted before the hierarchy cluster analysis to determine an appropriate number of clusters. Three clusters of the companies are obtained, and the ANOVA and Duncan tests (alpha = 0.1) were conducted on the clusters. Table 12 shows the results respectively. Clusters 1 and 2 have more efforts in the green deign cost estimation (ECS1) than cluster 3. Clusters 1, 2, and 3 put significantly different efforts on evaluating conventional cost, pollution prevention cost (ECS2) and hidden cost (ECS4). Cluster 1 puts more effort on contingent liability cost estimation (ECS3) than clusters 2 and 3. In general, the effort put on environmental cost estimation has a descending order in clusters 1, 2 and 3.
Based on more ANOVA analysis, Table 13 shows the factor scores of factors that are significantly different among the three clusters. The significant factors include managerial performance MF1, operational performance PF1, PF2 and PF3, Technology improvement TF2, and the disclosure on environmental information CF1 and CF2. Table 13 also shows the results of Duncan tests where Cluster 2 stands between Cluster 1 and Cluster 3. In some aspects such as PF2, PF3, TF2 and CF1, there is no significant difference between Cluster 1 and Cluster 2. On the other hand, in MF1, PF1 and CF2, there is no difference between Cluster 2 and Cluster 3. Above all, Cluster 1 is very different from Cluster 3 in all aspects. The results imply that there is a significant difference between the two groups of local companies although they all have got the ISO certification. Since the differences exist in many aspects, the strategies of the two groups are different. According to the literatures, the companies’ approach of Cluster 1 can be named strategic type while Cluster 3 may be
reactive type. The results essentially coincide with the conclusion in the literature suggesting that the corporations with more strategic approach in ISO-14000 implementation obtain better environmental performance. In addition, the technology improvements for the companies in the strategic group (Group I) focus more on green design and process change. The willingness of disclosing environmental information is also stronger. Finally, when we look into the companies in the cluster 1, it includes many companies that have won the environmental-awareness awards from local government and recognized as benchmark in environment-friendly companies in Taiwan.
6. Conclusions
Taiwan industry has gained significant environmental performance in the implementation process of ISO-14000. In regard to managerial performance, organizational improvement is the most significant benefit while cost reduction is the least. In regard to operational performance, ordinary pollution reduction and energy conservation are the most significant benefit while green process management is the least. In regard to the environmental cost evaluation, more effort was put on conventional cost, the cost on pollution prevention, and contingent liability cost estimation. Other environmental cost such as cost for green design and product development and hidden cost have not caused much attention. Regarding technology improvement, more improvement on pollution reduction and waste disposition are made while less effort on green product design and recycling are made. In regards to willingness of information disclosure, local industries are more comfortable in releasing environmental performance figures and environmental policy to the public than disclosing regulation violation, accidents and environmental cost.
Corporate strategies are categorized based on their efforts on environmental cost estimation where the efforts represent companies’ recognition and weighting on the environmental cost and risk. Three groups are obtained using the cluster analysis. The companies with the strategic approach putting more effort on the environmental cost estimation obtain better environmental performance. The strategic group puts more effort on green product design and process development in terms of technology improvement and the group is also more willing to disclose their environmental information. Many companies in the strategic group are already the leaders in the business sustainability and can be seen as benchmark for the local industries.
7.Refer ences
1.Anderson, Dan R., ”Incorporating Risk Management Into Environmental Management Systems”, CPCU Journal, Vol. 52, No. 2, pp. 115-125, 1999.
2.Ang, B., Hsu, M. and Liu, C. “Environmental Management in Food Production Industry”,
Technology Management Journal, 4, 1, 147-174, 1999.
3.Aragon-Correa, J. A., “Strategic Proactivity and Firm Approach to the Natural Environment,” Academy of Management Journal, Vol. 41, No. 5, pp. 556-567, 1998.
4.Barth, M. B., M. F. McNichols and G. P. Wilson, “Factors Influencing Firms’ Disclosures about Environmental Liabilities,” Review of Accounting Studies, No. 2, pp. 35-64, 1997.
5.Beets, S. D. and C. C.Souther, “Corporate Environment Reports: the Need for Standards and an Environmental Assurance Service,” Accounting Horizons, Vol. 13, No. 2, pp.
129-145, 1999.
6.Berry, M. A. and D. A. Rondinelli, “Proactive Corporate Environment: a New Industrial Revolution,” The Academy of Management Executive, Vol. 12, No. 2, pp. 38-50, 1998.
7.BMDP Statistical Software, Inc., BMDP Statistical Software Manual, Release 7, Vols. 1
and 2, Los Angeles: BMDP Statistical Software. 1992
8.Botosan, C.A., “Disclosure Level and the Cost of Equity Capital,” Accounting Review, Vol.
72, pp 323-350, 1997.
9.Callan, S. J. and J. M. Thomas, Environmental Economics and Management: Theory, Policy, and Applications, Irwin, Chicago, 1996.
10. CBCSD, “Environmental Performance and Stock Value,” Chinese Business Council for
Sustainable Development, 1998.
11. Chen, H., Hsu, M.L. and Liu, C “Factors of Environmental Performance Evaluation,”
Technology Management Journal, 2, 1, 179-205 (in Chinese).
12. Chin, Kwai-sang and Kit-fai Pun, “Factors Influencing ISO 14000 Implementation in Printed Circuit Board Manufacturing Industry in Hong Kong,” Journal of Environmental Planning & Management, Vol. 42, No. 1, pp. 123-134, 1999.
13. Cormier, D. and M. Magnan, “Corporate Environmental Disclosure Strategies: Determinants, Costs and Benefits,” Journal of Accounting, Auditing & Finace, Vol. 14, No.
4, pp. 429-451, 1999.
14. Freedman, M., and C. Wasley, “The Association between Environmental Performance and Environmental Disclosure in Annual Reports and 10Ks,” Advances in Public Interest Accounting, Vol. 3, pp. 183-193, 1990.
15. Hart, S.L., “A Natural Resource-based View of the Firm,” Academy of Management Review, No. 20, pp986-1014, 1995.
16. Huang, C.C. and Liu, I. C. “Environmental Accounting System: What We need”, Taiwan Economics Research, 21, 10, 42-48, 1998.
17. Hill and Jones, “Strategic Management, “ Houghton Mifflin Co., Boston, 1996.
18. Ho, S.W. “ISO14000 in Taiwan: A Survey,” Master Thesis, Cheng Kung University,
Taiwan, 1999.
19. Ilinitch, A. Y., N. S. Soderstrom and T. E. Thomas, “Measuring Corporate Environmental Performance,” Journal of Accounting and Public Policy, Vol. 17, No. 4/5,
pp. 383-408, 1998.
20. Jackson, S. L., “Monitoring and Measurement System for Implementing ISO 14001,”
Environmental Quality Management, Vol. 6, No. 3, pp. 33-41, 1997.
21. Klassen, R. D., “The Impact of Environmental Technologies on Manufacturing Performance,” Academy of Management Journal, Vol. 42, No. 6, pp. 599-615, 1999.
22. Klassen, R. D. and C. P. McLaughlin, “The Impact of Environmental Management on Firm Performance,” Management Science, Vol. 42, No. 8, pp. 1199-1214, 1996.
23. Klaus, B., Chakrabarti, A. and Kirchgeorg, M., “Corporate Strategies in Environmental Management”, Research Technology Management, 42, 4, 26-30.
24. Ku, Y. “Overlook on Environmental Management in Taiwan,” Environmental Management Report, 1, 1, 1998.
25. Lally, A. P., “ISO14000 and environmental cost accounting: The gateway to the global market”, Law and Policy in International Business, Vol. 29, No. 4, pp. 501-538, 1998.
26. Lau, R.S.M and S. Ragothaman, “Strategic Issues of Environmental Management”,
Business Review, Vol. 56, No. 2, pp. 1-7, 1997.
27. Maxwell, J., S. Rothenberg, F. Briscoe and A. Marcus, “Green Schemes: Corporate Environmental Strategy and Their Implementation,” California Management Review, Vol.
39, No. 3, pp. 118-120, 1997.
28. Piasecki, B. W., Fletcher, K. A. and Mendelson, F. J., Environmental Management and Business Strategy, Wiley publishers, New York, 1999.
Policies— an Integrative Framework,” California Management Review, Vol. 39, No. 1, pp.
106-122, 1996.
30. Steger, U., “Environmental Management Systems: Empirical Evidence and Further Perspectives,” European Management Journal, Vol. 18, No. 1, pp. 23-37, 2000.
31. Vastag, G., S. Kerekes and D. A. Rondinelli, “Evaluation of Corporate Environmental Management Approaches: a Framework and Application,” International Journal of Production Economics, Vol. 43, No. 2、3, pp. 193-211, 1996.
32. Watson, S. A., “The Business Implications of Implementing ISO 14000,”
Environmental Quality Management, Vol. 6, No. 1, pp. 51-62, 1996.
33. Wen J.D. and Chen M.K. “Implementation of ISO14000 in Taiwan,” Chung Shan Management Review, 6, 1, 195-219, 1998.
Table 1 Responses of the survey
Sectors No. of certified companies No. of responses Return rate mechanical 45 11 24% electrical 51 20 39% materials 19 8 42% chemicals 163 52 32% automobiles 19 13 68% Household and necessity 25 21 84% Electronics and communication 168 51 30% others 37 14 38% total 527 190 36%
Table 2 T-test for managerial performance
variables Mean Std.
Dev. t
Significance level
M1 Fulfill environmental regulation 3.841 0.663 17.434 ***
M4 Change employees’ environmental concept 3.784 0.631 17.142 ***
M22 Promote public image 3.774 0.714 14.943 ***
M6 Achieve higher environmental goal 3.697 0.656 14.652 ***
M7 Reduce fine 3.568 0.929 8.434 ***
M5 Shorten respond time for incidence 3.545 0.668 11.238 ***
M2 Improve the organization structure 3.466 0.770 8.339 ***
M3 Cooperation among organizations 3.386 0.748 7.095 ***
M9 Reduce accidents 3.355 0.967 5.064 ***
M8 Reduce the complain from local residents 3.335 1.071 4.291 ***
M25 Increase customers satisfaction 3.326 0.869 5.175 ***
M10 Reduce regulation violation and legal cases 3.254 1.106 3.158 **
M24 Increase export competitiveness 3.203 1.072 2.592 ***
M16 Reduce investment on pollution prevention
equipment 3.168 0.894 2.570 *
M17 Increase the profit from environmental
improvement 3.047 0.870 0.750
---M14 Reduce waste disposal cost 2.958 1.010 -0.575
---M23 Increase domestic competitiveness 2.955 1.009 -0.613
---M15 Reduce cost of raw materials 2.884 0.893 -1.792
---M26 Win environmental related awards 2.794 1.082 -2.602
---M19 Reduce the maintenance cost 2.643 0.846 -5.802
---M21 Increase market share 2.626 1.035 -4.945
---M18 Reduce insurance, loan cost 2.339 0.945 -9.623
---M12 Benefit from new technology development 2.336 0.971 -9.397
---M20 Reduce labor cost 2.304 0.925 -10.34
---M13 Benefit from new products development 2.304 0.981 -9.755
---M11 Reduce tax payment 2.282 1.037 -9.495
Table 3 Factor analysis for managerial performance Factor Loadings (Biquartimax) Variables MF1 MF2 MF3 MF4 M11 0.732 M12 0.819 M13 0.816 M14 0.565 M15 0.622 M16* 0.445 M17 0.623 M18 0.798 M19 0.682 M20 0.734 M21 0.656 0.452 M1*** 0.712 M2*** 0.629 M3*** 0.602 M4*** 0.590 M5*** 0.547 M6*** 0.646 M7*** 0.717 M8*** 0.857 M9*** 0.793 M10** 0.884 M22*** 0.590 M23 0.656 M24*** 0.753 M25*** 0.663 Factors
Increase profit Organizational improvement
Reduce risk and liability Promote image and competitiveness Eigen value 9.66 2.45 1.65 1.61 Variances % 37.16 9.42 6.33 6.21 Accumulated variances % 37.16 46.58 52.91 59.12 Cronbach’s α 0.9109 0.7853 0.9018 0.7981 note:***:p<0.001 **:p<0.01 *:p<0.05
Table 4 T-test for operational performance Variables
Mean Std Dev. t Significance
level P18 Increase the waste going through proper
treatment 3.693 0.705 13.424 ***
P6 Reduce solid waste 3.606 0.766 10.869 ***
P5 Reduce water pollution emission 3.604 0.741 11.168 ***
P4 Reduce air pollution emission 3.572 0.789 9.918 ***
P3 Increase water saving 3.532 0.759 9.631 ***
P1 Increase energy saving 3.376 0.750 6.883 ***
P14 Use more recycled materials 3.374 0.948 5.397 ***
P7 Reduce waste disposal cost 3.249 0.882 3.855 ***
P10 Reduce noise 3.233 0.936 3.419 ***
P20 Reduce stench 3.189 1.048 2.434 *
P8 Reduce toxic materials 3.168 1.089 2.076 *
P16 Increase the materials that can be recycled 3.165 0.900 2.513 *
P2 Recover energy 3.137 0.894 2.092 *
P17 Reduce raw materials 3.037 0.878 0.583
---P9 Reduce hazardous waste 2.986 1.130 ---
---P21 Reduce release of hot air 2.984 1.003 -0.221
---P15 Reduce package materials 2.976 1.014 ---
---P19 Reduce defective products 2.891 0.962 ---
---P12 Prolong product lifetime 2.676 1.027 ---
---P11 Reduce radiate waste 2.586 1.086 ---
---P13 Increase process automation 2.535 0.984 ---
Table 5 Factor analysis for operational performance Factor Loadings ( Varimax) Variables PF1 PF2 PF3 P8* 0.749 P9 0.808 P10*** 0.635 P11 0.763 P20* 0.648 P21 0.635 P1*** 0.746 P2* 0.633 P3*** 0.816 P4*** 0.638 P5*** 0.705 P6*** 0.745 P7*** 0.576 P14*** 0.494 P12 0.712 P13 0.607 0.610 P15 0.812 P16* 0.748 P17 0.716 P19 0.661 Factors Reduction of special pollution Reduction of general pollution and energy saving Process improvement Eigen value 10.08 1.80 1.33 Variances % 49.43 8.99 6.64 Accumulative variances % 49.43 58.42 65.06 Cronbach’s α 0.8958 0.8890 0.8956 註:***:p<0.001 **:p<0.01 *:p<0.05
Table 6 Cluster analysis for environmental cost and risk
Evaluation
Clusters description Variables Number of
companies %
E1 cost for product development 91 47.9
EC1
Environmental cost for product and
technology development
E2 cost for process development 104 54.7
E3 cost for training 150 78.9
E4 Cost for introducing new
management system and tool 133 70
E5 Cost for waste disposal 156 82.1
E6 Cost for inspection, monitor, and
analysis 144 75.8
E13 Cost for air pollution prevention 158 83.2
E14 Cost for waster pollution prevention 165 86.8 EC2
Conventional cost and pollution prevention cost
E15 Cost for outsourcing waste disposal 168 88.4
E8 Cost due to regulation violation 116 61.1
E9 Cost for energy use due to
environmental activities 107 56.3
E10 Compensation due to accidents 116 61.1
E11 Repair or construction of
environmental related facilities 113 59.5
EC3 Contingent
liability cost
E12 Repair and maintenance cost of
equipment for prevention 129 67.9
E7 Cost for risk analysis 86 45.3
E16 Cost for dealing with local residents’
protest 74 38.9
EC4 Hidden cost
Table 7 T-test for technology improvement
Variables Mean Std.Dv. t Significance
level
T15 Outsource waste disposal 3.777 0.788 13.513 ***
T8 Equipment for water pollution prevention 3.468 0.849 7.559 ***
T7 Equipment for air pollution prevention 3.404 0.896 6.183 ***
T9 Equipment for waste disposal 3.402 0.877 6.276 ***
T12 Process change for waste reduction 3.393 0.886 6.070 ***
T11 Waste volume reduction 3.340 0.915 5.099 ***
T13 Reduce defects and scraps 3.310 0.907 4.676 ***
T16 Change package design 3.301 0.953 4.325 ***
T2 Change process to save energy 3.278 0.897 4.223 ***
T6 Recycle solid waste 3.255 1.015 3.431 ***
T14 Introduce new process with low emission 3.177 0.955 2.534 *
T4 Energy-saving illumination 3.141 0.944 2.048 *
T5 Resource recycling equipment 3.070 1.015 0.937
---T17 Green product design 3.040 1.050 0.522
---T1 Introduce energy-saving equipment 2.964 0.978 ---
---T10 Extra technician 2.801 1.052 ---
---T18 Change composition of products 2.796 1.023 ---
---T19 Introduce software for environmental
management 2.750 1.031 ---
---T3 Co-generation 2.309 1.176 ---
Table 8 Factor analysis for technology improvement Factor Loadings (Varimax) Variables TF1 TF2 TF3 TF4 T2*** 0.678 T7*** 0.684 T8*** 0.696 T12*** 0.777 T13*** 0.644 T14* 0.507 0.548 T16*** 0.781 T17 0.840 T18 0.813 T19 0.485 T9*** 0.456 0.623 T15*** 0.781 T1 0.561 T3 0.561 T4* 0.728 T5 0.643 T10 0.487 Factors Pollution prevention and emission control Green design and process Waste disposition Energy saving and recycling
Eigen value
8.32 1.39 1.24 1.01Variances %
43.76 7.32 6.52 5.33 Accumulative variances % 43.76 51.09 57.61 62.94 Cronbach’s α 0.8757 0.8443 0.7645 註:***:p<0.001 **:p<0.01 *:p<0.05Table 9 T-test for the inclination of environmental information disclosure
Variables Mean St.
Dv. t
Significance level
C5 Employees’ health and safety records 3.521 0.873 8.163 ***
C7 Auditing results from a third party 3.489 1.011 6.621 ***
C1 Environmental policy and goal 3.446 0.949 6.416 ***
C9 Environmental management information
system 3.235 0.926 3.473 ***
C3 Quantitative objective on environmental
performance 3.230 0.938 3.353 ***
C4 Planning and schedule for achieving goal 3.228 0.892 3.495 *** C2 Quantitative information on environmental
performance 3.218 0.903 3.288 ***
C10 Open the facilities for outside observers 3.043 1.109 0.532
---C8 Accidents and other incidents 2.866 1.079 -1.694
---C11 Environmental cost 2.784 1.021 -2.860
---C6 Violation or other legal issues 2.658 1.058 -4.425
Table 10 Factor analysis for environmental information disclosure Factor Loadings ( Varimax)
variables CF1 CF2 C1*** 0.803 C2*** 0.864 C3*** 0.880 C4*** 0.827 C5*** 0.704 C7*** 0.628 C6 0.658 C8 0.802 C9*** 0.682 C10 0.667 C11 0.789
Factors Environmental policy
and performance
Environmental cost, violation and accidents
Eigen values 6.49 1.10 Variances % 59.03 69.03 Accumulative variances % 59.03 10.00 Cronbach’s α 0.9186 0.8561 註:***:p<0.001 **:p<0.01 *:p<0.05
Table 11 Comparisons on the significant and not significant factors Factors
Constructs
significant not significant
Managerial performance
*Organizational improvement *Reduction of risk and fine *Companies’ image and
competitiveness
*Increase profit
Operational performance
*Reduction of general pollution and energy saving
*Reduction of special pollution *Improvement on process control
and management Efforts on
environmental cost evaluation
*Conventional cost and pollution prevention
*Contingent liability cost
*Cost for product and process development
*Hidden and future cost Technology
improvement
*Pollution prevention and emission reduction
*Waste disposal
*Green product design and process
*Energy saving and recycling Inclination on
environmental information disclosure
*Environmental policy and environmental performance
*Violation, accidents, and environmental cost
Table 12 Cluster analysis based on the efforts on environmental cost evaluation
Clusters Cluster 1 Cluster 2 Cluster 3 F P Duncan test
ECS1: Product & process develop cost Mean (SD*) 1.31 (2.21) 1.63 (1.51) -2.79 (0.77) 132.58 0.000 1 2 3 ECS2: Conventional &
pollution prevention cost
Mean (SD*) 2.79 (0.53) 2.30 (0.89) 0.53 (1.93) 53.16 0.000 1 2 3 ECS3: Contingent liability
cost Mean (SD*) 2.29 (0.96) -1.88 (1.13) -2.05 (1.42) 262.97 0.000 1 2 3 ECS4: Future and hidden
cost Mean (SD*) 2.53 (1.00) 0.52 (1.95) -0.98 (1.91) 66.58 0.000 1 2 3 *SD: Standard deviation.
Table 13 Comparison on the factor scores and ANOVA results
Factors Group1 Strategic Group 2 Medium Group 3 Reactive p-level (ANOVA) Duncan test (p< 0.1) MF1 Increase profit 0.42 -0.07 -0.35 0.000 *** 1 2 3 PF1
Special pollution reduction 0.33 -0.15 -0.16
0.017 ** 1 2 3
PF2
General pollution reduction and energy saving
0.11 0.14 -0.26
0.086 * 1 2 3
PF3
Improvement on product and process
0.09 0.13 -0.18
0.077 * 1 2 3
TF2
Green design and process 0.25 0.07 -0.36
0.004 ** 1 2 3
CF1
Disclosure of environmental policy and performance
0.23 0.06 -0.30
0.015 ** 1 2 3
CF2
Environmental cost, accidents and violation
0.35 -0.22 0.16
0.004 ** 1 2 3