Chapter 7: Figures and Tables
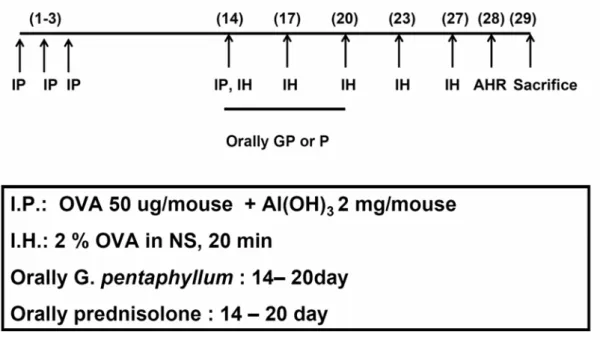
Figure 1. OVA allergen sensitization and challenge procedures in IH3 model. Mice were injected intraperitioneally (IP) with OVA on days 1-3 and 14. Mice were then challenged by the inhalation (IH) of OVA allergen on days 14, 17, and 20 (IH3). G.
pentaphyllum extracts (GP, 5g/kg) or prednisolone (P, 25mg/kg) was orally
administrated once per day between days 14-20. Airway hyperresponsiveness (AHR) was determined on day 21 and mice were sacrificed on day 22 for other tests.
Figure 2. OVA allergen sensitization and challenge procedures in IH5 model. Mice were injected intraperitioneally (IP) with OVA on days 1-3 and 14 and then
challenged by inhalation (IH) of OVA allergen on days 14, 17, 20, 23, and 27. G.
pentaphyllum extracts (GP, 5g/kg) or prednisolone (P, 25mg/kg) was orally administrated once per day between days 14-20. AHR was determined on day 28 and mice were sacrificed on day 29.
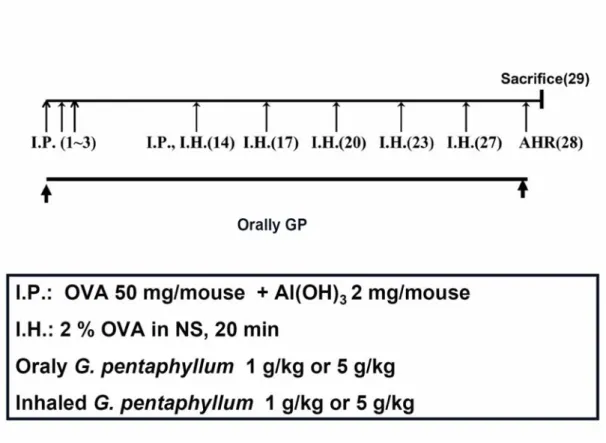
Figure 3. OVA allergen sensitization and challenge procedures (IH 5 model) to evaluate the prevention effects of orally administrated G. pentaphyllum extracts (GP, 1.75g/kg) for one month. Mice were injected intraperitioneally (IP) with OVA on days 1-3 and 14. Mice were then challenged by inhalation (IH) OVA allergen on days 14, 17, 20, 23, and 27. AHR was determined on day 28 and mice were sacrificed on day 29. This treatment model was designated as the T-A model.
Figure 4. OVA allergen sensitization and challenge procedures to evaluate the preventive and therapeutic effect of long-term administration of G. pentaphyllum extracts (GP, 1.75g/kg) in OVA-sensitized mice.Mice were injected
intraperitioneally (IP) with OVA on days 1-3 and 14. Mice were then challenged by inhalation (IH) OVA allergen on days 14, 17, 20, 23, and 27. AHR was determined on day 28 and mice were sacrificed on day 29. This treatment model was
designated as the T-B model.
Figure 5. OVA allergen sensitization and challenge procedures to evaluate the therapeutic effect of G. pentaphyllum extracts (GP, 1.75g/kg) in OVA-sensitized mice. Mice were injected intraperitioneally (IP) with OVA on days 1-3 and 14 and challenged by inhalation (IH) OVA allergen on day 14, 17, 20, 23, and 27. G.
pentaphyllum extracts (5g/kg or 1g/kg) were orally administrated once per day
during days 1-28. IH G. pentaphyllum group (was named IPIH ) inhaled 5g/kg G.
pentaphyllum seven times on day on day 14, 16, 18, 21, 23, 25, and 27. Day 28 tested AHR was determined on day 28 and mice were sacrificed on day 29. This treatment model was designated as the T-C model.
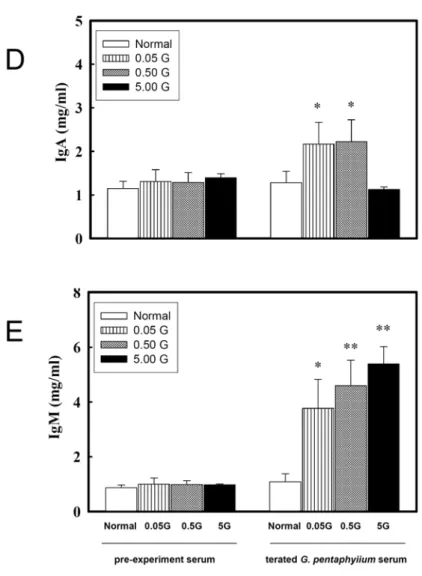
Figure 6. Higher serum levels of immunoglobulin were induced with
intraperitoneal injection of G. pentaphyllum extracts. Mice serum was collected from mice before or after the injection of G. pentaphyllum for 5 consecutive days (n=6). The mice were designated as Normal, 0.05G, 0.50G, and 5.00G groups for various doses (0, 0.05, 0.50, or 5.00 g/kg/day) of G. pentaphyllum extract,
respectively. The concentration of IgG (A), IgG1 (B), IgG2a (C), IgA (D), and IgM
(E) were determined with ELISA. Data are presented as mean ± standard error (SE).
* indicates p<0.05, and ** indicates p<0.01, when compared to the serum level in Normal group.
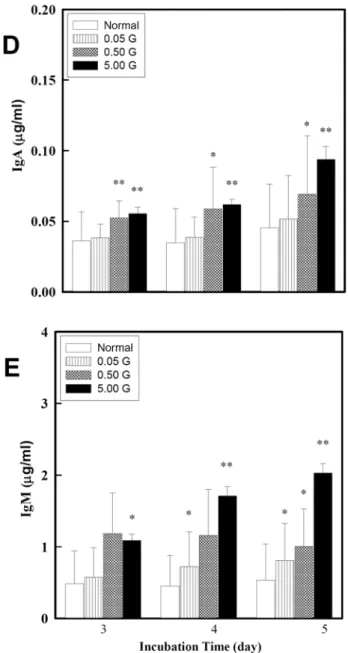
Figure 7. G. pentaphyllum enhanced antibodies production from spleen cells.
Spleen cells (5x10⁵ cells/ml) were incubated with 1 μg/ml of LPS. The supernatants were collected after the cultures for 3, 4, and 5 days. The concentration of IgG (A), IgG1 (B), IgG2a (C), IgA (D), and IgM (E) were determined with ELISA. Date were presented as mean ± SE. * indicates p<0.05, and ** indicates p<0.01, when compare to the Normal group.
Figure 8. G. pentaphyllum enhanced the production of Th1-associated cytokines from activated spleen cells. Spleen cells (1 x 10⁶ cells/ml) were incubated with 1 μg/ml of Con A for 2 days. Culture supernatants were collected and the
concentrations of IFN-γ (A) and IL-2 (B) were measured by ELISA. Date are presented as mean ± SE. * indicates p<0.05, and ** indicates p<0.01, when compared to the Normal group.
Figure 9. G. pentaphyllum enhanced the production of Th2-associated cytokines from activated spleen cells. Spleen cells (1 x 10⁶ cells/ml) were incubated with 1 μg/ml of Con A for 2 days. Culture supernatants were collected and the concentrations of IL-4 (A) and IL-10 (B) were measured by ELISA. Date are presented as mean ± SE. * indicates p<0.05, and ** indicates p<0.01, when compared to the Normal group.
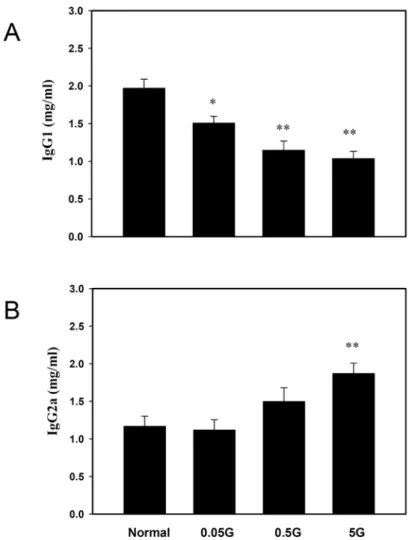
Figure 10. Oral administration of G. pentaphyllum (GP) extracts induced IgG1 (A) and IgG2a (B) secretion in serum. Sera were collected from mice after oral
administration of GP extracts for 5 consecutive days (n=11 in each group, except n=12 in 5G group). The mice were designated as Normal, 0.05G, 0.50G, and 5.00G groups for various doses (0, 0.05, 0.50, or 5.00 g/kg/day) of GP extract given, respectively. The concentrations of IgG1 and IgG2a were determined with ELISA.
Data are presented as mean ± standard error (SE). * indicates p<0.05, and **
indicates p<0.01 compared to the serum level of Normal group.
Figure 11. G. pentaphyllum influenced immunoglobulin production from activated spleen cells. Spleen cells (5 x 10⁶ cells/ml) were incubated with 1 μg/ml of LPS for 5 days. Supernatants were collected and the concentrations of IgG1 (A) and IgG2a (B) were measured with ELISA. Data are presented as mean ± SE. * indicates
p<0.05, and ** indicates p<0.01, compared to the Normal group.
Figure 12. G. pentaphyllum enhanced production of Th1-associated cytokines from activated spleen cells. Spleen cells (5 x 10⁶ cells/ml) were incubated with 1 μg/ml of Con A for 2 days. Culture supernatants were collected and the concentrations of IFN-γ (A) and IL-2 (B) were measured with ELISA. Data are presented as mean ± SE. * indicates p<0.05, and ** indicates p<0.01, compared to the Normal group.
Figure 13. G. pentaphyllum influenced production of Th2-associated cytokines from activated spleen cells. Spleen cells (5 x 10⁶ cells/ml) were incubated with 1 μg/ml of Con A for 2 days. Culture supernatants were collected and the
concentrations of IL-4 (A) , IL-5 (B) and IL-10 (C) were measured with ELISA.
Data are presented as mean ± SE. * indicates p<0.05, and ** indicates p<0.01, compared to the Normal group.
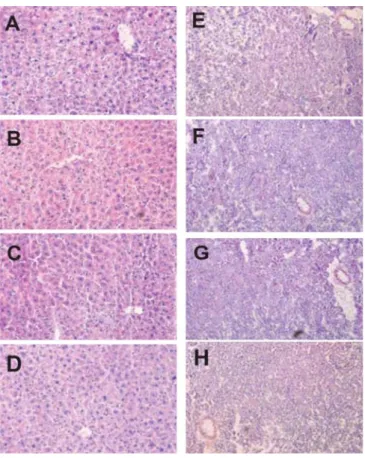
Figure 14. HE stain of liver and kidney slides from mice received various doses of G. pentaphyllum extracts. Sections were magnified to x 200. From (A) to (D) were liver sections of Normal, 0.05G, 0.5G, and 5G group, respectively. From (E) to (H) were kidney sections of Normal, 0.05G, 0.5G, and 5G group, respectively.
Figure 15. G. pentaphyllum extracts decreased airway hyperresponsiveness (AHR) to various methacholine doses in IH3 model. Penh values present the bronchi constriction when mice inhaled methacholine (6.25 to 50 mg/ml). N group (n=8,
◆), OVA group (n=9, ●), GP group (n=9, ■), and P group (n=8, ▲). Data are presented as mean ± SE. * indicates p<0.05, ** indicates p< 0.01, when compared to OVA group.
Figure 16. G. pentaphyllum extracts decreased the percentages of eosinophils in BALF of OVA-sensitized mice in IH3 model. The percentages of eosinophils were counted based on the morphology of 500 BALF cells from mice of Normal (N), OVA-sensitized (OVA), treated with G. pentaphyllum extracts (GP, 5 g/kg/day) or prednisolone (P, 25mg/kg) group. Data are presented as mean ± SE. * indicates p<0.05, ** indicates p< 0.01, when compared to OVA group.
Figure 17. Reduced serum OVA-specific IgG1 (A), IgG2a (B), and IgE (C)
antibodies in mice treated with G. pentaphyllum extracts in IH3 model. Serum from mice of different groups in the IH3 models was examined by ELISA. The units of
OVA-IgG1 were determined based on a constructed standard curve of previously pooled serum. OVA-IgE was diluted 5-fold and given as OD490nm readings. Data are presented as means ± SE. * indicates p<0.05, ** indicates p< 0.01, when compared to the OVA group.
Figure 18. G. pentaphyllum extracts modulated cytokine production from
OVA-activated spleen cell cultures in the IH3 model. The concentrations of IFN-γ (A), IL-4 (B), IL-5 (C), and IL-13 (D) were determined by ELISA. Data are presented as means ± SE. Eight mice in each group of N or P group and 9 mice were used in OVA or GP group. * indicates p<0.05, ** indicates p< 0.01, when compared to OVA group.
Figure 19. G. pentaphyllum extracts decreased airway hyperresponsiveness (AHR) to various methacholine doses in IH5 model. Penh values present the bronchi constriction when mice inhaled methacholine (6.25 to 50 mg/ml). N group (◆), OVA group (●), GP group (■), and P group (▲). Data are presented as means ± SE.
n=11 in each group except n=9 in GP group. * indicates p<0.05, ** indicates p<
0.01, when compared to OVA group.
Figure 20. G. pentaphyllum extracts decreased the percentages of eosinophils in BALF of OVA-sensitized mice in IH5 model. The percentages of eosinophils were counted based on the morphology of 500 BALF cells from mice of Normal, OVA-sensitized (OVA), treated with G. pentaphyllum extracts (GP, 5 g/kg/day) or prednisolone (P, 25mg/kg) group. Data are presented as means ± SE. n=11 in each group, except n=9 in GP group. * indicates p<0.05, ** indicates p< 0.01, when compared to OVA group.
Figure 21. Reduced serum OVA-specific IgG1 (A) or IgE (C) and enhanced IgG2a (B) antibodies in mice treated with G. pentaphyllum extracts in IH5 model. (n=11 in each group, except n=9 in GP group).The concentrations of serum antibodies were examined by ELISA. The units of OVA-IgG1 were determined based on a
constructed standard curve of previously pooled serum. OVA-IgG2a was diluted 2000-folds and OVA-IgE was diluted 5-fold and given as OD490nm readings. * indicates p<0.05, ** indicates p< 0.01, when compared to OVA group.
Figure 22. G. pentaphyllum extracts modulated cytokine production from
OVA-activated spleen cell cultures in the IH5 model. The concentrations of IFN-γ (A), IL-4 (B), IL-5 (C), and IL-13 (D) were measured with ELISA. Data are presented as means ± SE (n=11 for each group, except n=9 in the GP group). * indicates p<0.05, ** indicates p< 0.01, when compared to the OVA group.
Figure 23. G. pentaphyllum extracts reduced Th2-type cytokine concentration in BALF of mice in the IH5 model. The levels of IL-5 (A) and IL-13 (B) were determined with ELISA. Data are presented as means ± SE (n=11 for each group, except n=9 in the GP group). * indicates p<0.05, ** indicates p< 0.01, when compared to the OVA group.
Figure 24. Histopathologic analysis of lung sections stained with H&E (original magnification: x 100) in IH5 model. (A): N group (B) OVA group (C) GP group, and (D) P group.
Figure 25. AHR in T-A model. The preventive effect of G. pentaphyllum extracts was examined in OVA-induced asthmatic mice.Penh values present the bronchi constriction when mice inhaled methacholine (6.25 to 50 mg/ml). Normal group (N) (◊, n=3), OVA-sensitive mice group (OVA) (○, n=3), prednisolone group (P) (□, n=3), 5 g/Kg G. pentaphyllum group (G1) (∆, n=6). Data are presented as means ± SE.
Figure 26. The changes of eosinophils in the BALF of mice receiving oral administration of G. pentaphyllum extracts in T-A model. The percentages of eosinophils were counted based on the morphology of 500 BALF cells. Normal group (N) (n=3), OVA-sensitive mice group (OVA) (n=3), prednisolone group (P) (n=3), 5 g/Kg G. pentaphyllum group (G1) (n=6). Data are presented as means ± SE.
Figure 27. Changes of serum OVA-specific IgG1 (A), IgG2a (B), or IgE (C) antibodies in T-A model. The units of OVA-IgG1 were determined based on a constructed standard curve of previously pooled serum. OVA-IgG2a was diluted 2000-folds and OVA-IgE was diluted 5-fold and given as OD490nm readings.
Normal group (N)(n=3), OVA-sensitive mice group (OVA) (n=3), prednisolone group (P) (n=3), 5 g/Kg G. pentaphyllum group (G1) (n=6). Data are presented as means ± SE.
Figure 28. G. pentaphyllum extracts changed cytokine productions from
OVA-activated spleen cell cultures in T-A model. The concentrations of IFN-γ (A), IL-4 (B), IL-5 (C), and IL-13 (D) were measured with ELISA. Normal group (N) (n=3), OVA-sensitive mice group (OVA) (n=3), prednisolone group (P) (n=3), 5 g/Kg G. pentaphyllum group (G1) (n=6). Data are presented as means ± SE.
Figure 29. AHR in T-B model. The efficacy of long-term administration of G.
pentaphyllum extracts on AHR of OVA-induced asthmatic mice was examined.
Penh values present the bronchi constriction when mice inhaled methacholine (6.25 to 50 mg/ml). Normal group (N) (◊, n=3), OVA-sensitive mice group (OVA) (○, n=3), prednisolone group (P) (□, n=3), 5 g/Kg G. pentaphyllum group (G2) (∆, n=6). Ddata are presented as means ± SE. * indicates p<0.05, ** indicates p< 0.01, when compared to OVA group.
Figure 30. The changes of eosinophils in the BALF of mice receiving oral administration of G. pentaphyllum extracts in T-B model. The percentages of eosinophils were counted based on the morphology of 500 BALF cells. Normal group (N) (n=3), OVA-sensitive mice group (OVA) (n=3), prednisolone group (P) (n=3), 5 g/Kg G. pentaphyllum group (G2) (n=6). Data are presented as means ± SE.
Figure 31. Reduced serum OVA-specific IgG1 (A) or IgE (C) and enhanced IgG2a (B) antibodies in mice treated with G. pentaphyllum extracts in T-B model.
Antibodies were analyzed with ELISA. The units of OVA-IgG1 were determined based on a constructed standard curve of previously pooled serum. OVA-IgG2a was diluted 2000-folds and OVA-IgE was diluted 5-fold and given as OD490nm
readings. Normal group (N) (n=3), OVA-sensitive mice group (OVA) (n=3), prednisolone group (P) (n=3), 5 g/Kg G. pentaphyllum group (G2) (n=6). Data are presented as means ± SE.
Figure 32. G. pentaphyllum extracts changed cytokine productions from
OVA-activated spleen cell cultures in T-B model. The concentrations of IFN-γ (A), IL-4 (B), IL-5 (C), and IL-13 (D) were measured with ELISA. Normal group (N) (n=3), OVA-sensitive mice group (OVA) (n=3), prednisolone group (P) (n=3), 5 g/Kg G. pentaphyllum group (G2) (n=6). Data are presented as means ± SE.
Figure 33. AHR in T-C model with the administration of G. pentaphyllum extracts during the OVA-sensitization and challenge period of time. Penh values present the bronchi constriction when mice inhaled methacholine (6.25 to 50 mg/ml). Normal group (N) (◆, n=9), OVA-sensitive mice group (OVA) (●, n=9), 1 g/Kg G.
pentaphyllum group (GP1) (▲, n=9), 5 g/Kg G. pentaphyllum group (GP5) (▆, n=8), and IH 5 g/Kg G. pentaphyllum group (GPIH) (●, n=4). Data are presented as means ± SE. * indicates p<0.05, ** indicates p< 0.01, when compared to OVA group.
Figure 34. The changes of total and different cell populations in the BALF of mice receiving G. pentaphyllum extracts in the T-C model. The percentages of leukocytes were counted based on the morphology of 500 BALF cells. Normal group (N) (n=9), OVA-sensitive mice group (OVA) (n=9), 1 g/Kg G. pentaphyllum group (GP1) (n=9), 5 g/Kg G. pentaphyllum group (GP5) (n=8), IH 5 g/Kg G.
pentaphyllum group (GPIH) (n=4). Data are presented as means ± SE.
0 20 40 60 80 100
Eosinophils
N OVA GP1 GP5 GPIH (%)
p=0.001 p=0.001 p=0.631
% of eosinophils
Figure 35. The changes of eosinophils in the BALF of mice receiving G.
pentaphyllum extracts in T-C model. The percentages of eosinophils were counted
based on the morphology of 500 BALF cells. Normal group (N, n=9),
OVA-sensitive mice group (OVA, n=9), 1 g/Kg G. pentaphyllum group (GP1, n=9),5 g/Kg G. pentaphyllum group (GP5, n=8),IH 5 g/Kg G. pentaphyllum group (GPIH, n=4), Data are presented as means ± SE.
Figure 36. Reduced serum OVA-specific IgG1 (A) or IgE (C) and enhanced IgG2a (B) antibodies in mice treated with G. pentaphyllum extracts in T-C model.
Antibodies were analyzed with ELISA. The units of OVA-IgG1 were determined based on a constructed standard curve of previously pooled serum. OVA-IgG2a was diluted 2000-folds and OVA-IgE was diluted 5-fold and given as OD490nm
readings. Normal group (N, n=9), OVA-sensitive mice group (OVA, n=9), 1 g/Kg G.
pentaphyllum group (GP1, n=9), 5 g/Kg G. pentaphyllum group (GP5,, n=8), IH 5 g/Kg G. pentaphyllum group (GPIH, n=4). Data are presented as means ± SE.
Figure 37. G. pentaphyllum extracts changed cytokine productions from
OVA-activated spleen cell cultures in T-C model. The concentrations of IFN-γ (A), IL-4 (B), IL-5 (C), and IL-13 (D) were determined with ELISA. Normal group (N, n=9), OVA-sensitive mice group (OVA, n=9), 1 g/Kg G. pentaphyllum group (GP1, n=9),5 g/Kg G. pentaphyllum group (GP5, n=8),IH 5 g/Kg G. pentaphyllum group (GPIH, n=4), Data are presented as means ± SE.
Table 1. The ALT and AST levels in BALB/c mice receiving G. pentaphyllum extracts 5 consecutive days (n=2).