Effect of arginine on angiogenesis induced by human colon cancer:
in vitro and in vivo studies
Chiu-Li Yeha,c, Man-Hui Paib, Cheng-Chung Lic, Yu-Ling Tsaia, Sung-Ling Yehc,⁎
aInstitute of Nutrition and Health Sciences, Chia-Nan University of Pharmacy and Science, Tainan, Taiwan
bDepartment of Anatomy, Taipei Medical University, Taipei, Taiwan
cSchool of Nutrition and Health Sciences Taipei Medical University, Taipei, Taiwan
Received 3 November 2008; received in revised form 13 January 2009; accepted 4 March 2009
Abstract
This study investigated the effect of arginine (Arg) supplementation on angiogenesis in human colon cancer. The in vitro study investigated the effects of different Arg levels and inducible nitric oxide (iNO) synthase inhibitor on angiogenic protein expressions stimulated by SW480 cells. The results showed that the production of vascular endothelial growth factor (VEGF), basic fibroblast growth factor with 100 and 1000μmol/L Arg and matrix metalloproteinase (MMP)-2 with 1000μmol/L Arg was lower than that with 0 and 50 μmol/L Arg. Inhibition of iNO resulted in higher angiogenic protein expressions comparable with groups with low Arg administration, indicating that Arg administration at levels similar to or higher than physiological concentrations reduced the progression of colon cancer, and iNO may partly play a role in reducing angiogenesis. The in vivo study used a human colon cancer xenograft model in nude mice. Mice were inoculated with 1×10⁷SW480 cells and assigned to two groups. The control group was fed a semipurified diet, while the experimental group was supplied an Arg-supplemented diet. After 5 weeks, tumors were harvested and spleens were excised for further analysis. Results showed that the MMP-2, MMP-9 and VEGF receptor levels in tumors were significantly lower, whereas tumor NO levels and spleen natural killer (NK) cell activities were higher in the Arg group than in the control group. These results were consistent with the in vitro study that dietary Arg supplementation inhibits the progression of colon cancer possibly by increasing NO secretion and consequently enhancing NK cell activity.
© 2010 Elsevier Inc. All rights reserved.
Keywords: Arginine; SW480; Nude mice; Angiogenic protein; Inducible nitric oxide; Natural killer cell
1. Introduction
Arginine (Arg) is a nonessential amino acid for healthy adults with plasma concentrations of approximately 100μmol/L[1]. Arg has been shown to possess numerous useful physiological properties. The significant effects of Arg on nitrogen metabolism and immune function were shown by animal experiments and studies in humans [2–4]. Arg is considered to be an essential amino acid for patients with catabolic conditions[5,6]. Arg is the substrate of nitric oxide synthase (NOS) and the precursor of nitric oxide (NO). NO can act as a signal transducer and cellular messenger in homeostasis and host defense.
Previous studies showed that NO plays critical roles in the antipatho- gen and tumoricidal responses of the immune system[7,8]. However, NO has also been implicated as a deleterious agent in various pathophysiological conditions including cancer[9,10]. The Arg NO- mediated modulatory effect on various cancers remains controversial.
Cancer was the leading cause of death in Taiwan in 2007. Colorectal cancer (CRC) is ranked second in mortality among cancer patients in Taiwan. Therefore, developing strategies to decrease the incidence of
CRC and improve its prognosis by changing the diet or certain dietary components have become important issues of study. Arg is often used in immunonutrition regimens. A previous study showed that immune-enhancing diets containing Arg reduced the infection rate in postoperative head, neck and esophageal cancer patients[11]. Arg- supplemented formulae may be recommended for cancer patients. A study by Ma et al.[12]showed that Arg given during the initiation phase significantly reduced colorectal tumor production and crypt cell proliferation in rats. They also found that Arg treatment restrained the inhibitor of apoptosis protein expression in patients with colorectal adenocarcinoma, and this effect may have been related to the increased serum NO concentration [13]. Because reduced plasma Arg concentrations are often present in cancer patients[14], and the role of Arg-derived NO in angiogenesis and tumor growth has not been clearly clarified, we designed these in vitro and in vivo studies to investigate the effects of Arg and/or Arg-derived NO on the development of a human colorectal adenocarcinoma cell line (SW480). The aims of this study were to investigate (a) the effect of different Arg concentrations (0, 50, 100 and 1000 μmol/L) on the progression of colon cancer cells, (b) the role of inducible NO (iNO) production in tumor angiogenesis and (c) the effect of dietary Arg on the development of colorectal tumor in a xenograft model of nude Journal of Nutritional Biochemistry 21 (2010) 538–543
⁎ Corresponding author. Tel.: +886 2 27361661x6547.
E-mail address:sangling@tmu.edu.tw(S.-L. Yeh).
0955-2863/$– see front matter © 2010 Elsevier Inc. All rights reserved.
doi:10.1016/j.jnutbio.2009.03.005
mice. We analyzed several angiogenic factors including alpha (v) beta (3) (αvβ3), platelet endothelial cell adhesion molecule-1 (PECAM-1), vascular endothelial growth factor (VEGF), VEGF receptor (VEGFR), basic fibroblast growth factor (bFGF) and matrix metalloproteinase (MMP). Since increased production of NO is associated with the target cell killing ability of natural killer (NK) cells[15], the effect of dietary Arg on splenocyte NK cell activity in colorectal tumor-implanted nude mice was also evaluated.
2. Materials and methods
2.1. Cell culture
The SW480 human colorectal adenocarcinoma cell line was purchased from the Food Industry Research and Development Institute (Hsinchu, Taiwan) and cultured in L-15 medium supplemented with 10% fetal bovine serum (FBS) and a penicillin/
streptomycin mixture. Adherent monolayer cultures were maintained at 37°C in a mixture of 5% CO2and 95% air. Cells were routinely trypsinized (0.05% trypsin/EDTA) and subcultured in flasks. Human umbilical vein endothelial cells (HUVECs) were isolated from an umbilical cord vein according to the method of Jaffe et al.[16]. The umbilical vein was cannulated, washed with phosphate-buffered saline (PBS) and perfused with PBS containing 0.1% collagenase for 10 min at 37°C in 5% CO2. HUVECs were collected and established as a primary culture in medium-199 (M-199) containing 20% fetal calf serum, 20 mM NaHCO3, 25 mM HEPES, antibiotics (100 U/
ml penicillin and 100μg/ml streptomycin), 10 IU/ml heparin sodium and 15 mg/L endothelial cell (EC) growth factor at 37°C in 5% CO2and 95% humidity. Cells were serially passaged two to three times for the experimental assay. HUVECs (1×10⁵cells/
well) from second subcultures were grown on fibronectin-coated inserts (3-μm pore size, 6.4 mm, Becton Dickinson, Franklin Lakes, NJ) until the monolayer was confluent.
2.2. In vitro study
HUVECs and SW480 cells were incubated in M-199 (with 20% heat-inactivated FBS) with different concentrations of Arg and 1400W as shown: (a) 0μmol/L Arg, (b) 50 μmol/L Arg, (c) 100 μmol/L Arg, (d) 1000 μmol/L Arg, (e) 100 μmol/L Arg+10 μmol/L 1400W and (f) 1000μmol/L Arg+10 μmol/L 1400W for 24 h. The viability of HUVECs and SW480 after incubation was more than 95% as confirmed by trypan blue staining.
2.2.1. Measurements of MMP-2, MMP-9, VEGF and bFGF in the supernatant
HUVECs were placed in the upper chamber and SW480 cells were placed in the lower chamber of a transwell apparatus unit. After the SW480 cell–HUVEC interaction had proceeded for 6 h, solutions in the upper chambers of the transwells were collected and centrifuged at 1200 rpm for 10 min for further analysis. Concentrations of MMP-2, MMP-9, VEGF and bFGF were measured using commercially available enzyme-linked immunosorbent assay (ELISA) kits. Antibodies specific for human MMP-2, MMP-9, VEGF and bFGF were coated onto the wells of the microtiter strips provided (R&D Systems, Minneapolis, MN, USA). Procedures followed the manufacturer's instructions.
2.2.2. Measurements of CD51/CD61 expression by HUVECs
HUVEC surface expressions ofαvβ3 (CD51/CD61) were measured after the SW480 cell–HUVEC interaction had proceeded for 6 h in the transwell co-culture system. After removing the supernatant, HUVECs were washed twice with PBS, and the pellets were incubated with iced medium containing 2 mM EDTA to detach adherent ECs. Then, the pellets were incubated with 100μl M-199 (FBS free, containing 2 mM EDTA) for a further 30 min at 4°C with the addition of fluorescein isothiocyanate-conjugated mouse anti-human CD51 and phycoerythrin-conjugated mouse anti-human CD61 (Serotec, Oxford, UK). The suspension was collected into a tube and resuspended in 500μl PBS (containing 0.3 ml of 350 mM formaldehyde). The fluorescence intensity of a 5×10³cell population was counted and analyzed by flow cytometry (Coulter, Miami, FL, USA).
Results are presented as the percentages of CD51/CD61-presenting cells in 5×10³ECs.
2.2.3. Migration assay
HUVECs (1×10⁵cells/well) from second subcultures were grown on fibronectin- coated inserts (8-μm pore size, 6.4 mm, Becton Dickinson), which were then placed in a 24-well plate until the monolayer was confluent. They were then incubated in M-199 (with 20% heat-inactivated FBS) with different concentrations of Arg and 1400W as described above for 24 h. The viability of HUVECs after incubation wasN95% as confirmed by trypan blue staining. SW480 cells (1×10⁵cells/100μl/well) were grown in L-15 (with 10% heat-inactivated FBS) with different concentrations of Arg and 1400W in a 24-well plate. Subsequently, HUVECs were washed twice with PBS and cultured with various concentrations of Arg and 1400W (without FBS) and 100μl of supernatant obtained from SW480 cells cultured for 3 h. The supernatant of the cancer cells was placed in the lower chamber of the transwell. After that, HUVECs were allowed to migrate and fall into the lower chamber for 3 h. HUVECs were quantified by a microscopic counter in a hemocytometer[17].
2.3. In vivo study
2.3.1. Animals
Male, 4-week-old ICR nu/nu mice were purchased from the National Laboratory Animal Center (Taipei, Taiwan). The mice were housed in a specifically designed pathogen-free isolation facility and maintained in a temperature- and humidity- controlled room with a 12-h light–dark cycle. The study protocol was approved by the Animal Care Committee of Taipei Medical University, Taipei, Taiwan. The care of the laboratory animals was in full compliance with the Guide for the Care and Use of Laboratory Animals (National Research Council, 1985) as reviewed by the animal care and use committee.
2.3.2. Tumor cell inoculation and study protocol
Nude mice (N=20) were weighed and anesthetized, followed by inoculation with 1×10⁷SW480 cells in a total volume of 100μl of culture medium in the left flank. Mice were allowed to recover and were randomly assigned to a control group or an Arg group of 10 animals each. The control group was fed a common semipurified diet, and the Arg group was supplied an identical diet except that part of the casein was replaced by Arg, which provided 2% of the total energy intake (Table 1). This amount of Arg was previously found to enhance the immune response in rodents[3,18,19]. The diets were sterilized and stored at−20°C in bags. The body weight was recorded weekly, and growth rates of the tumors were determined by weekly measurement of two diameters of the tumor with a vernier caliper. After receiving the respective diets for 5 weeks, mice were anesthetized by ethanol and sacrificed by cardiac puncture. Blood samples were collected in tubes containing heparin for analysis. Spleens were excised for further NK cell activity assay. Tumors were immediately harvested and stored at−70°C for further analysis.
2.3.3. Measurement of tumor volume
Tumors were measured with a microcaliper, and the ellipsoid tumor volume was calculated using the following formula: volume=length×width×height×π/6.
2.3.4. VEGF, VEGF-R, MMP-2 and MMP-9 levels in tumors
Tumor homogenates were prepared by adding 1 ml of 0.1 M Tris–HCl (pH 7.5) containing 10 mM CaCl2 solution using a homogenizer. The homogenates were centrifuged to discard cell debris. The supernatant was used for the analysis of MMP-2, MMP-9, VEGF and VEGFR concentrations in tumors using commercially available ELISA kits. Antibodies specific for human MMP-2, MMP-9 and VEGF and for mouse VEGFR were coated onto the wells of the microtiter strips provided (R&D Systems). Protein concentrations of homogenates were measured by Lowry's method. The MMP-2, MMP- 9, VEGF and VEGFR levels in tumors were expressed as per gram of protein. Procedures followed the manufacturer's instructions
2.3.5. Analysis of tumor PGE2and NO2−/NO3−concentrations
NO is highly unstable in solution and cannot readily be assayed. However, NO is converted to stable nitrite and nitrate ions in an aqueous solution. After conversion of nitrate to nitrite using nitrate reductase, nitrite concentrations were measured using the Griess reagent. Concentrations of NO2−/NO3−in tumor homogenates were determined with a commercial kit (Assay Designs, Ann Arbor, MI, USA). PGE2
concentrations were measured by ELISA. The surfaces of the microtiter plates were precoated with an antibody specific for PGE2, and acetylcholinesterase covalently coupled to PGE2was used as the enzymatic tracer (R&D Systems). Procedures followed the manufacturer's instructions. Levels of PGE2 and NO2−/NO3−were expressed as picograms and millimolar per gram of protein in the tumor.
Table 1
Composition of the experimental diets (in grams per kilogram)
Component Control Arg
Soybean oil 100 100
Casein 200 158
Arg 0 20.9
Salt mixturea 35 35
Vitamin mixtureb 10 10
Methyl cellulose 31 31
Choline chloride 1 1
Methionine 3 3
Corn starch 620 641.1
a The salt mixture contained the following (in milligrams per gram): calcium phosphate diabasic, 500; sodium chloride, 74; potassium sulfate, 52; potassium citrate monohydrate, 20; magnesium oxide, 24; manganese carbonate, 3.5; ferric citrate, 6;
zinc carbonate, 1.6; cupric carbonate, 0.3; potassium iodate, 0.01; sodium selenite, 0.01;
and chromium potassium sulfate, 0.55.
b The vitamin mixture contained the following (in milligrams per gram): thiamin hydrochloride, 0.6; riboflavin, 0.6; pyridoxine hydrochloride, 0.7; nicotinic acid, 3;
calcium pantothenate, 1.6;D-biotin, 0.05; cyanocobalamin, 0.001; retinyl palmitate, 1.6;
DL-α-tocopherol acetate, 20; cholecalciferol, 0.25; and menaquinone, 0.005.
2.3.6. CD31 immunocytochemistry
For the demonstration of CD31 immunoreactivity, consecutive frozen sections (at a thickness of 10μm) were obtained using a Bright Cryostat (Bright, Huntingdon, UK) at
−20°C and preincubated in a blocking solution containing 10% normal goat serum (NGS) and 0.3% H2O2in 0.1 M phosphate buffer for 1 h to block endogenous peroxidase activity and the nonspecific binding of antibodies. Sections were then incubated with a mouse monoclonal primary antibody against CD31 (AbD Serotec, Martinsried, Planegg, Germany), diluted 1:100 in 0.1 M phosphate buffer, for 24 h at 4°C. After washing in buffer, sections were next incubated in biotinylated goat anti-mouse immunoglobulin G (diluted 1:300, Chemicon, Temecula, CA, USA) for 1 h at room temperature. After reaction with the peroxidase-linked avidin–biotin complex (Vector, Burlingame, CA, USA) for 1 h at room temperature, a diaminobenzidine solution kit (Vector) was used to detect CD31 immunoreactivity. Hematoxylin (Sigma, St. Louis, MO, USA) nuclear staining was also applied to contrast the cell nucleus with cytoplasm. All tissue sections were mounted on gelatin-coated slides using Permount (Fisher, Fair Lawn, NJ, USA), examined with a Zeiss Axiophot light microscope equipped with a digital camera (Carl Zeiss, Germany) and photographed.
2.3.7. The NK cell activity assay
Splenocytes were harvested by mechanically dispersed and filtered through a 100- μm-pore-size nylon cell strainer to produce a single cell suspension. Erythrocytes were lysed using sterile distilled water for 15 s and immediately neutralized to isotonic cell suspensions. After washing with PBS three times (300×g for 5 min), splenocytes were resuspended in RPMI-1640 (Gibco BRL, Grand Island, NY, USA). The NK cell activity of splenocytes was assessed by a flow cytometry assay[20], using target cells from the mouse Moloney leukemia cell line, YAC-1. Briefly, splenocytes were adjusted to 4×10⁶ cell/ml with RPMI-1640 medium as effector cells. YAC-1 cells, as target cells, were washed with Hanks' balanced salt solution and adjusted to 2×10⁶cells/ml. Target cells at 200μl were labeled with 2 μl of DiOC18membrane dye (3 mM) (Molecular Probes, Eugene, OR, USA) at 37°C for 20 min. The effector splenocytes and labeled target cells were mixed at different ratios (40:1, 20:1, 10:1 and 5:1) and were co-cultured in a 5%
CO2humidified incubator at 37°C for 2 h. The supernatants were removed, and the same volume of propidium iodide nuclear dye (0.2 mg/ml, Molecular Probes) was added to stain dead cells. The splenocyte-mediated cytotoxicity was determined by flow cytometry (Becton Dickinson FACS CaliburTM). During data acquisition, a“live”
gate was set in the FL1 histogram on the green fluorescent target cells in order to discriminate effector and target cells. At least 5000 target cells per sample were collected. The percent specific cytotoxicity was determined by subtracting the percentage of dead cells in the incubated targets alone from the percentage of killed target cells in the test samples.
2.4. Statistical analysis
Data are expressed as the mean±S.D. Results are representative of three independent experiments in the in vitro study. Differences among groups were analyzed by analysis of variance using Duncan's test. Student's t test was used to analyze the significance of differences between mean values in the animal study. P valueb.05 was considered statistically significant.
3. Results 3.1. In vitro study
3.1.1. VEGF, bFGF, MMP-2 and MMP-9 secreted by ECs and/or SW480 cells
Levels of VEGF and bFGF in the supernatant of the transwell apparatus were lower with 100 and 1000μmol/L Arg than with 0 and 50μmol/L Arg and the groups with 1400W. VEGF levels with 0 and 50 μmol/L Arg and bFGF with 50 μmol/L Arg were lower than those groups with 1400W. MMP-2 and MMP-9 concentrations were lower in the 1000-μmol/L Arg group than in the groups with 0 and 50 μmol/L Arg and the groups with 1400W. MMP-2 levels with 50 and 100μmol/L Arg and MMP-9 with 100μmol/L Arg were lower than those groups with 1400W. There were no differences in bFGF, MMP-2 and MMP-9 levels among 0μmol/L Arg and groups with 1400W (Table 2).
3.1.2. CD51/CD61 expression by HUVECs
CD51/CD61 expression by ECs was lower with 50, 100 and 1000 μmol/L Arg when stimulated with SW480 than with 0 μmol/L Arg, and levels with 100 and 1000μmol/L Arg were even lower than that with 50 μmol/L Arg. There were no differences in CD51/CD61 expressions among 0 μmol/L Arg and the groups with 1400W administration (Fig. 1).
3.1.3. Migration of HUVECs stimulated by SW480
HUVEC migration was lower with 50, 100 and 1000 μmol/L Arg than with 0μmol/L Arg, and migration extents with 100 and 1000 μmol/L Arg were even lower than that with 50 μmol/L Arg. However, the reduced EC migration in the Arg-supplemented groups was abrogated when 1400W was administered (Fig. 2)
3.2. In vivo study
3.2.1. Body weight and tumor size of the mice
There were no differences in the initial body weights and weights after feeding the diets for 5 weeks (data not shown). The tumor size of the Arg group was significantly lower than that of the control group at the end of the experiment (583±445 mm3 vs. 1069±543 mm3, Pb.05).
3.2.2. NO, MMP-2, MMP-9, VEGF, VEGF-R and PGE2levels in tumor homogenates
The MMP-2, MMP-9 and VEGFR levels were significantly lower, whereas NO levels were higher in the Arg group than in the control group. No differences in VEGF and PGE2concentrations were observed between the Arg and the control group (Table 3).
3.2.3. Splenocyte NK cell activity
Spleen NK cell activities in mice fed Arg were significantly higher than those of control mice (Arg: 18.7±3.1% vs. control: 13.1±3.9%, Pb.05).
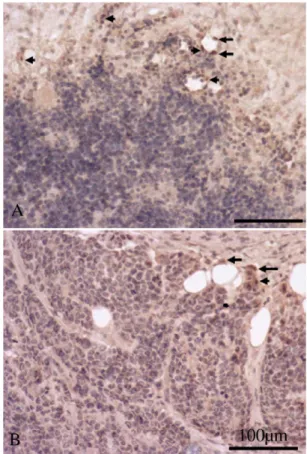
3.2.4. CD31 expression in tumors
The immunocytochemical findings of tumor tissues with hema- toxylin staining showed that the brown CD31-immunoreactive cells with stained nucleus were distributed randomly in the control group, and most of them were found in the vicinity of blood vessels (Fig. 3A).
There were only a few cells that had CD31 immunoreactivity in tumors of mice fed Arg, and these CD31-positive cells were frequently observed in the periphery of the blood vessels (Fig. 3B). The arrows point to CD31-positive cells with brown cytoplasm and hematoxylin- stained nuclei. As shown in Fig.3, the CD31-positive cells exhibited less immunoreactive intensities in mice fed Arg than those fed the control diet.
4. Discussion
Supplemental Arg has been demonstrated to improve the immunologic response in both in vivo and ex vivo studies. Most in vitro studies have used exogenous NO to investigate the effect of NO on the progression of tumor cells. Studies investigating the effects of Arg-derived NO on angiogenesis are rare. To understand whether Arg concentrations may affect the progression of colon cancer cells, we treated ECs and SW480 cells with different Arg concentrations, Table 2
Effects of various concentrations of Arg and 1400W (an iNOS inhibitor) on the VEGF, bFGF, MMP-2 and MMP-9 concentrations in the supernatant
VEGF (pg/ml)
bFGF (pg/ml)
MMP-2 (ng/ml)
MMP-9 (ng/ml) Arg 0μmol/L 100.4±1.1a 170.7±5.8 16.67±0.7 10.24±0.6 Arg 50μmol/L 102.7±2.4a 142.1±6.2a 10.01±1.2a 9.54±0.2 Arg 100μmol/L 89.67±1.6b 120.5±3.6b 9.01±1.4a 8.03±0.3a Arg 1000μmol/L 87.0±2.6b 123.2±2.4b 3.44±1.8b 6.16±0.3b Arg 100μmol/L+1400W 117.0±3.2 163.8±5.6 15.4±2.2 11.81±0.6 Arg 1000μmol/L+1400W 116.3±3.2 178.9±6.1 16.2±2.0 11.96±0.8 Results are representative of triplicate measurements. Data are presented as the mean±S.D.
a Significantly differs from groups with 1400W.
b Significantly differs from Arg 0 and 50μmol/L and groups with 1400W.
including low (50μmol/L), approximately physiological (100 μmol/L) and high (1000 μmol/L) Arg levels to observe EC–SW480 cell interactions. In the present in vitro study, we found that Arg administration at levels similar to or higher than physiological concentrations decreased angiogenesis of colon cancer cells.
Angiogenesis is a prerequisite for tumor growth and metastasis.
Vascular EC proliferation, migration and capillary formation are stimulated by angiogenic growth factors[21]. VEGF is a mitogen specific for ECs. Levels of VEGF have been positively associated with angiogen- esis as judged by microvessel counts[22]. bFGF acts synergistically with VEGF in stimulating capillary growth [23]. Degradation of the extracellular matrix is crucial for malignant tumor growth, invasion and angiogenesis. MMPs are a family of zinc-dependent neutral endopeptidases collectively capable of degrading essentially all matrix components. MMP-2 and MMP-9 degrade components of basement membranes and are believed to be crucial for invasion by malignant tumors[24]. In this study, we found that all of these proteins, except MMP-9, secreted by ECs and/or SW480 cells were lower with 100 and 1000μmol/L Arg than those with 0 and 50 μmol/L Arg. These findings paralleled those of the effects of Arg on EC cell migration andαvβ3 expression. Integrinαvβ3 (CD51/CD61) is a glycoprotein membrane receptor. ECs exposed to growth factors or those undergoing angiogen- esis in tumors express high levels of αvβ3 [25]. Previous studies suggested thatαvβ3 may serve as a useful diagnostic or prognostic indicator of tumors[26]. The results observed in this study suggest that
low Arg levels result in higher angiogenic protein expressions, whereas normal or higher than physiological Arg levels decrease angiogenesis.
Angiogenesis involves basement membrane degradation, EC attach- ment, migration and proliferation. In this study, we found that EC migration extents with 100 and 1000μmol/L Arg were lower than that with 0 and 50μmol/L Arg, indicating that normal or higher than physiological Arg treatment decreased EC migration in vitro. In this study, we also found that concomitant with the administration of an iNO synthase (iNOS) inhibitor, the beneficial effects of decreasing angiogenic protein and ECαvβ3 expressions as well as the decreased EC migration observed with physiological and high Arg administration were abolished. These findings provide evidence for a modulatory role of iNO in colon cancer cell–EC interactions.
The results of the animal study are consistent with those of the in vitro study, in that we found that dietary Arg supplementation Table 3
NO, MMP-2, MMP-9, VEGF, VEGFR and prostaglandin E2(PGE2) concentrations in tumor homogenates
Arg group Control group
NO (mM/g protein) 13.08±0.31 ⁎ 7.37±1.77
MMP-2 (ng/g protein) 251.4±10.5 ⁎ 286.7±7.5
MMP-9 (ng/g protein) 2.128±1.56 ⁎ 4.34±1.47
VEGF (pg/g protein) 10.34±2.47 9.31±1.89
VEGFR (pg/g protein) 279.6±129.3 ⁎ 640.1±89.7
PGE2(pg/g protein) 26.09±7.4 25.1±7.6
Data are presented as the mean±S.D.
⁎ Significantly differs from the control group at Pb.05.
Fig. 3. Expression of CD31-immunoreactive cells in mice fed the control diet (A) and Arg diet (B). Most CD31-immunoreactive cells were found close to blood vessels. Cell nuclei were contrast-stained with hematoxylin. The arrows point to CD31-positive cells with brown cytoplasm and hematoxylin-stained nuclei. Note that there were more immunopositive cells in mice fed the control diet. The scale bar represents 100μm in Panels A and B.
Fig. 1. Expression of CD 51/CD61 by ECs induced by SW480 cells. *Significantly differs from the 0- and 50-μM Arg groups and the groups with 1400W.+Significantly differs from the other groups (Pb.05).
Fig. 2. Effect of different Arg levels and an iNOS inhibitor (1400W) on SW480 cell- stimulated migration of HUVECs. *Significantly differs from the 0- and 50-μM Arg groups and the groups with 1400W.+Significantly differs from the other groups (Pb.05).
exhibited a smaller tumor size and lower angiogenic protein expressions in xenograft nude mice with CRC. In addition to MMP-2, MMP-9 and VEGF, we also analyzed VEGFR and PGE2in the tumors.
VEGF activates VEGFR expressed by vascular ECs. VEGFR activation plays an important role in tumor angiogenesis[27]. PGE2is a product of arachidonic acid metabolism, modulates vascular reactivity and may contribute to physiological neovascularization as well as tumor- associated angiogenesis [28]. In this study, we found that MMP-2, MMP-9 and VEGFR concentrations in tumors were lower in the Arg group than in the control group. These results were comparable with PECAM-1 expression by ECs. PECAM-1/CD31 is a member of the immunoglobulin gene superfamily of cell adhesion molecules. It is highly expressed on the surface of ECs [29]. PECAM-1 plays an important role in survival, migration and functional organization of ECs during vascular development and angiogenesis[30]. In this study, we found fewer CD31-immunoreactive cells in mice fed Arg than those fed the control diet. These results indicated that dietary Arg supplementation reduced angiogenesis in colon cancer implanted in nude mice. Our result is consistent with a previous report that Arg supplementation in tumor-bearing hosts inhibits tumor growth[31].
However, Park et al.[32]described an increase in tumor proliferation markers in patients with breast cancer treated with dietary Arg supplements. The discrepancies among studies may have resulted from the types of cancer cells, the potentiation of other genotoxic agent present or the environmental exposure of tissues to various concentrations and durations of NO.
NO has multifaceted roles in cancer. In this study, we observed that NO levels in tumors were higher in the Arg group than in the control group, which was inversely correlated with the expressions of angiogenic proteins. A study by Ma et al. [13] found that L-Arg administration suppressed colorectal tumorigenesis, and this effect was thought to be related to increased serum NO concentrations. Our data support the description of NO possibly inhibiting the progression of colorectal adenocarcinoma cells in xenograft nude mice. A previous study showed that the SW480 cell line has high iNOS expression[33].
High NO levels in the cellular microenvironment induce cytostasis and cytotoxicity in tumor cells[34]. This result was similar to a report by Scott et al.[35]that iNOS plays an antineoplastic role in a mouse model of familial adenomatous polyposis. However, our study was incon- sistent with a previous report by Yerushalmi et al.[36], who found that iNO derived from Arg promotes colonic tumorigenesis in congenital multiple intestinal neoplastic mice. The contradictory results related to iNOS involvement in colonic carcinogenesis may have resulted from different animal models. In their experiment, elevated dietary Arg increased colonic NO and peroxynitrite concentrations, which can cause DNA damage resulting in mutagenesis and tumor initiation[36].
In our study, dietary Arg supplementation may have resulted in endogenous NO production by tumor cells and host cells, which may consequently have reduced tumor progression. In addition, NK cell function may also play an important role in nonspecific immunity when nude mice are implanted with tumor cells.
NK cells constitute a subtype of cytotoxic lymphocytes with large granules. The function of NK cells is to play an important role in tumoricidal and antimicrobial activities of mononuclear phagocytes [37]. A previous study found that Arg supplementation of human volunteers increased the killing capacity of NK cells[38]. A study by Xiao et al. [39]also found that the addition of L-Arg led to dose- dependent NO generation, which paralleled NK cell activity, indicating that NO is a mediator of tumor cell killing by NK cells.
In this study, we also observed that concomitant with higher NO levels, NK cell activity increased when Arg was administered to nude mice. This result is consistent with reports by others that Arg supplementation in tumor-bearing hosts inhibits the growth and dissemination of immunogenic tumors by up-regulating NK cell function[31,40,41].
In summary, the in vitro study showed that Arg administration at levels similar to or higher than physiological concentrations decreased angiogenic protein production and reduced EC migration.
Inactivation of iNO resulted in higher angiogenic protein andαvβ3 expressions, indicating that iNO at least plays a partial role in decreasing angiogenesis in the presence of SW480 cells. The in vivo study also showed that dietary Arg supplementation resulted in lower angiogenic protein levels and higher NO secretion and NK activity in xenograft nude mice with colon cancer, suggesting that Arg supplementation inhibits the progression of colon cancer possibly by increasing NO secretion and consequently enhancing NK cell activity.
Acknowledgments
This study was supported by Research Grant NSC95-2320-B-038- 034-MY2 from the National Science Council, Taipei, Taiwan.
References
[1] de Jonge WJ, Marescau B, D'Hooge R, De Deyn PP, Hallemeesch MM, Deutz NE, et al. Overexpression of arginase alters circulating and tissue amino acids and guanidino compounds and affects neuromotor behavior in mice. J Nutr 2001;131:2732–40.
[2] Kirk SJ, Regan MC, Wasserkrug HL, Sodeyama M, Barbul A. Arginine enhances T-cell responses in athymic nude mice. J Parenter Enteral Nutr 1992;16:429–32.
[3] Gianotti L, Alexander JW, Pyles T, Fukushima R. Arginine-supplemented diets improve survival in gut-derived sepsis and peritonitis by modulating bacterial clearance. The role of nitric oxide. Ann Surg 1993;217:644–53.
[4] Daly JM, Reynolds J, Thom A, Kinsley L, Dietrick-Gallagher M, Shou J, et al. Immune and metabolic effects of arginine in the surgical patient. Ann Surg 1988;208:
512–23.
[5] Evoy D, Lieberman MD, Fahey 3rd TJ, Daly JM. Immunonutrition: the role of arginine. Nutrition 1998;14:611–7.
[6] De-Souza DA, Greene LJ. Pharmacological nutrition after burn injury. J Nutr 1998;128:797–803.
[7] Fukumura D, Yonei Y, Kurose I, Saito H, Ohishi T, Higuchi H, et al. Role in nitric oxide in Kupffer cell-mediated hepatoma cell cytotoxicity in vitro and ex vivo.
Hepatology 1996;24:141–9.
[8] Cifone MG, Festuccia C, Cironi L, Cavallo G, Chessa MA, Pensa V, et al. Induction of the nitric oxide-synthesizing pathway in fresh and interleukin 2-cultured rat natural killer cells. Cell Immunol 1994;157:181–94.
[9] Mordan LJ, Burnett TS, Zhang LX, Tom J, Cooney RV. Inhibitors of endogenous nitrogen oxide formation block the promotion of neoplastic transformation in C3H 10T1/2 fibroblasts. Carcinogenesis 1993;14:1555–9.
[10] Gottke M, Chadee K. Exogenous nitric oxide stimulates mucin secretion from LS174T colonic adenocarcinoma cells. Inflamm Res 1996;45:209–12.
[11] Casas-Rodera P, Gomez-Candela C, Benitez S, Mateo R, Armero M, Castillo R, et al.
Immunoenhanced enteral nutrition formulas in head and neck cancer surgery: a prospective, randomized clinical trial. Nutr Hosp 2008;23:105–10.
[12] Ma Q, Williamson KE, O'Rourke D, Rowlands BJ. The effects ofL-arginine on crypt cell hyperproliferation in colorectal cancer. J Surg Res 1999;81:181–8.
[13] Ma Q, Wang Y, Gao X, Ma Z, Song Z.L-Arginine reduces cell proliferation and ornithine decarboxylase activity in patients with colorectal adenoma and adenocarcinoma. Clin Cancer Res 2007;13:7407–12.
[14] Vissers YL, Dejong CH, Luiking YC, Fearon KC, von Meyenfeldt MF, Deutz NE.
Plasma arginine concentrations are reduced in cancer patients: evidence for arginine deficiency? Am J Clin Nutr 2005;81:1142–6.
[15] Jyothi MD, Khar A. Induction of nitric oxide production by natural killer cells: its role in tumor cell death. Nitric Oxide 1999;3:409–18.
[16] Jaffe EA, Nachman RL, Becker CG, Minick CR. Culture of human endothelial cells derived from umbilical veins. Identification by morphologic and immunologic criteria. J Clin Invest 1973;52:2745–56.
[17] Languino LR, Duperray A, Joganic KJ, Fornaro M, Thornton GB, Altieri DC.
Regulation of leukocyte–endothelium interaction and leukocyte transendothelial migration by intercellular adhesion molecule 1-fibrinogen recognition. Proc Natl Acad Sci U S A 1995;92:1505–9.
[18] Yeh CL, Lee CH, Chen SC, Hou YC, Yeh SL. Effects of arginine-containing total parenteral nutrition on N balance and phagocytic activity in rats undergoing a partial gastrectomy. Br J Nutr 2005;93:267–72.
[19] Shang HF, Wang YY, Lai YN, Chiu WC, Yeh SL. Effects of arginine supplementation on mucosal immunity in rats with septic peritonitis. Clin Nutr 2004;23:561–9.
[20] Chang L, Gusewitch GA, Chritton DB, Folz JC, Lebeck LK, Nehlsen-Cannarella SL.
Rapid flow cytometric assay for the assessment of natural killer cell activity.
J Immunol Methods 1993;166:45–54.
[21] Rose DP, Connolly JM. Regulation of tumor angiogenesis by dietary fatty acids and eicosanoids. Nutr Cancer 2000;37:119–27.
[22] Dobbs SP, Hewett PW, Johnson IR, Carmichael J, Murray JC. Angiogenesis is associated with vascular endothelial growth factor expression in cervical intraepithelial neoplasia. Br J Cancer 1997;76:1410–5.
[23] Asahara T, Bauters C, Zheng LP, Takeshita S, Bunting S, Ferrara N, et al. Synergistic effect of vascular endothelial growth factor and basic fibroblast growth factor on angiogenesis in vivo. Circulation 1995;92:II365–71.
[24] Vihinen P, Kahari VM. Matrix metalloproteinases in cancer: prognostic markers and therapeutic targets. Int J Cancer 2002;99:157–66.
[25] Brooks PC, Clark RA, Cheresh DA. Requirement of vascular integrin alpha v beta 3 for angiogenesis. Science 1994;264:569–71.
[26] Sipkins DA, Cheresh DA, Kazemi MR, Nevin LM, Bednarski MD, Li KC. Detection of tumor angiogenesis in vivo by alphaVbeta3-targeted magnetic resonance imaging.
Nat Med 1998;4:623–6.
[27] Ebos JM, Lee CR, Bogdanovic E, Alami J, Van Slyke P, Francia G, et al. Vascular endothelial growth factor-mediated decrease in plasma soluble vascular endothe- lial growth factor receptor-2 levels as a surrogate biomarker for tumor growth.
Cancer Res 2008;68:521–9.
[28] Messina EJ, Weiner R, Kaley G. Prostaglandins and local circulatory control. Fed Proc 1976;35:2367–75.
[29] Albelda SM, Oliver PD, Romer LH, Buck CA. Endo CAM a novel endothelial cell–cell adhesion molecule. J Cell Biol 1990;110:1227–37.
[30] Dimaio TA, Wang S, Huang Q, Scheef EA, Sorenson CM, Sheibani N. Attenuation of retinal vascular development and neovascularization in PECAM-1-deficient mice.
Dev Biol 2008;315:72–88.
[31] Swaffar DS, Ang CY, Desai PB, Rosenthal GA. Inhibition of the growth of human pancreatic cancer cells by the arginine antimetaboliteL-canavanine. Cancer Res 1994;54:6045–8.
[32] Park KG, Heys SD, Blessing K, Kelly P, McNurlan MA, Eremin O, et al.
Stimulation of human breast cancers by dietary L-arginine. Clin Sci (Lond) 1992;82:413–7.
[33] Radomski MW, Jenkins DC, Holmes L, Moncada S. Human colorectal adenocarci- noma cells: differential nitric oxide synthesis determines their ability to aggregate platelets. Cancer Res 1991;51:6073–8.
[34] Yim CY, Bastian NR, Smith JC, Hibbs Jr JB, Samlowski WE. Macrophage nitric oxide synthesis delays progression of ultraviolet light-induced murine skin cancers.
Cancer Res 1993;53:5507–11.
[35] Scott DJ, Hull MA, Cartwright EJ, Lam WK, Tisbury A, Poulsom R, et al. Lack of inducible nitric oxide synthase promotes intestinal tumorigenesis in the Apc(Min/
+) mouse. Gastroenterology 2001;121:889–99.
[36] Yerushalmi HF, Besselsen DG, Ignatenko NA, Blohm-Mangone KA, Padilla- Torres JL, Stringer DE, et al. The role of NO synthases in arginine- dependent small intestinal and colonic carcinogenesis. Mol Carcinogen 2006;45:93–105.
[37] Trinchieri G. Biology of natural killer cells. Adv Immunol 1989;47:187–376.
[38] Park KG, Hayes PD, Garlick PJ, Sewell H, Eremin O. Stimulation of lymphocyte natural cytotoxicity byL-arginine. Lancet 1991;337:645–6.
[39] Xiao L, Eneroth PH, Qureshi GA. Nitric oxide synthase pathway may mediate human natural killer cell cytotoxicity. Scand J Immunol 1995;42:505–11.
[40] Reynolds JV, Daly JM, Shou J, Sigal R, Ziegler MM, Naji A. Immunologic effects of arginine supplementation in tumor-bearing and non-tumor-bearing hosts. Ann Surg 1990;211:202–10.
[41] Brittenden J, Park KG, Heys SD, Ross C, Ashby J, Ah-See A, Eremin O.L-Arginine stimulates host defenses in patients with breast cancer. Surgery 1994;115:
205–12.