Evaluation of the Applicability of the Weibull Probability Density Function with Different Approaches for Diameter
Distributions of Plantations of Four Conifer Species
Kai-Luo Huang,1) Chao-Huan Wang,2) Tian-Ming Yen,1,3) Long-En Li1)
【Summary】
The purpose of this research was to quantify diameter distributions of stands using the Weibull probability density function for 4 conifers, namely China fir (Cunninghamia lanceolata), Japanese cedar (Cryptomeria japonica), Taiwan red cypress (Chamaecyparis formosensis), and Taiwania (Taiwania cryptomerioides). These 4 conifers are widely planted in mountain areas of Taiwan, and we focused on plantation forests. The study area included all of Taiwan, and the data were from a system of permanent sample plots of the National Forest Management Plan Revision. We utilized the Weibull function to model diameter distributions based on 3 approaches of the maximum like- lihood estimator (MLE) and 2 percentile estimators [PE(I) and PE(II)]. After examining the good- ness-of-fit for the observed data and the Weibull distribution estimated using the 3 approaches with the Kolmogorov-Smirnov (K-S) test, we found that PE(II) was superior to the other approaches, and the respective pass rates of samples were 100, 96.6, 85.5, and 97.2% for China fir, Japanese ce- dar, Taiwan red cypress and Taiwania. A similar trend of pass rates of samples indicated that PE(II)
> PE(I) > MLE for each species. The results implied that PE(II) was the best estimator among the 3 approaches for these 4 conifers.
Key words: Weibull probability density function, conifer plantations, maximum likelihood estima- tors, percentile estimators.
Huang KL, Wang CH, Yen TM, Li LE. 2015. Evaluation of the applicability of the Weibull prob- ability density function with different approaches for diameter distributions of plantations of four conifer species. Taiwan J For Sci 30(1):1-13.
1)Department of Forestry, National Chung-Hsing Univ., 250 Kuokuang Rd., South District, Taichung 40227, Taiwan. 國立中興大學森林系,40227台中市南區國光路250號。
2)Department of Forestry and Natural Resources, National Ilan Univ., 1, Shenlung Rd, Sec. 1, Yilan 26047, Taiwan. 國立宜蘭大學森林暨自然資源學系,26047宜蘭市神農路一段1號。
3)Corresponding author, e-mail:[email protected] 通訊作者。
Received October 2014, Accepted January 2015. 2014年10月送審 2015年1月通過。
研究報告
評估不同方法推估之Weibull函數在四種針葉樹 人工林直徑分布之適用性
黃凱洛1) 王兆桓2) 顏添明1,3) 李隆恩1)
摘 要
本研究旨在探討應用Weibull機率密度函數應用於臺灣四種主要針葉樹種-杉木、柳杉、紅檜及臺 灣杉林分直徑分布之適用性。此四種針葉樹過去廣泛地栽植於臺灣各地區,本研究主要以此四種針葉 樹人工林為研究對象,研究區域分布於整個臺灣,所採用之資料主要來自於國有林事業區森林經營計 畫檢訂調查之永久樣區系統,林分直徑分布建模係採用最大概似法(the maximum likelihood estimator, MLE)和兩種百分位數法[the percentile estimators, PE(I) and PE(II)]配適Weibull機率密度函數,建模 後以Kolmogorov-Smirnov測驗檢測觀測值和由三種方法模擬所得之Weibull分布之適合度,所得結果 以PE(II)模擬結果最佳,其樣本通過檢測比例在杉木、柳杉、紅檜及臺灣杉分別為100、96.6、85.5及 97.2%。此外研究結果也發現三種推估方法在模擬不同樹種呈現一致性趨勢,即樣本通過檢測比例:
PE(II) > PE(I) > MLE,此結果顯示PE(II)之推估結果最適合四種樹種之直徑分布。
關鍵詞:Weibull機率密度函數、針葉樹人工林、最大概似法、百分位數法。
黃凱洛、王兆桓、顏添明、李隆恩。2015。評估不同方法推估之Weibull函數在四種針葉樹人工林直徑 分布之適用性。台灣林業科學30(1):1-13。
INTRODUCTION
Diameter at breast height (DBH) is one of most important variables for measuring trees and is usually regarded as a standard variable to present tree diameter because DBH is easy to measure and is well cor- related with other tree characteristics, such as tree height, crown width, tree volume, biomass (foliage, branches, and stems), and carbon storage (Hush et al. 1982, Avery and Burkhart 1983, Clutter et al. 1983, Yen et al.
2009). Since DBH is a standard measure of tree diameter, the stand diameter distribution implies DBH distributions within stands. It is a valid expression to show tree size distribu- tions within stands (Bailey and Dell 1973, Cao et al. 1982, Clutter et al. 1983, Davis et al. 2001, Cao 2004, Yen et al. 2010). Quan-
tifying diameter distributions is an important task for making decisions by forest manag- ers; it can be correlated with stand growth, stand density management, and economic and ecological values of forests (Bailey and Dell 1973, Clutter et al. 1983, Davis et al. 2001).
Quantifying diameter distributions of stands usually adopts the probability density function (PDF) as a model, and many well- known PDFs have been proposed to fit stand diameter distributions, such as the gamma distribution (Nelson 1964), beta distribution (Clutter and Bennett 1965), and Weibull dis- tribution (Bailey and Dell 1973). Among these PDFs, the Weibull function is widely utilized to characterize various forests because it pos- sesses many advantages, including that the
model is flexible and can fit various diameter distributions, the parameters have geometrical meanings, and its cumulative density function (CDF) can be easily converted from the PDF (Bailey and Dell 1973, Cao et al. 1982, Hyink and Moser 1983, Yen 1999a, b, Yen et al.
2010). We also found that many research re- ports developed diameter distributions for dif- ferent forest types using the Weibull function, including natural forests (Lee and Chen 1991, Lee and Jong 1996), planted forests (Yen 1999a, b, Li and Yen 2010), and bamboo for- ests (Yen et al. 2010). Their results indicated that this model possesses an excellent ability to describe various forest types. On the other hand, the parameters of the Weibull function can be estimated using various approaches, e.g., maximum likelihood estimators (MLEs) and percentile estimators (PEs). Interestingly, we also found that these 2 approaches have individual advantages, and might be suitable for different forest types (Bailey 1974, Abern- ethy 1981, Cao et al. 1982, Clutter et al. 1983, Zarnoch and Dell 1985, Nanang 1998, Yen 1999a, b, Yen et al. 2010). Although many research reports fit diameter distributions of stands with the Weibull function in Taiwan, most such research was limited to a regional area, and a large-scale scope of all of Taiwan was rarely addressed.
The importance of plantations arises from current forest management practices in Taiwan because many limits are imposed on natural forests, such as emphasizing conser- vation and prohibiting cutting for commercial uses (Yen et al. 2013). Compared to natural forests, many environmental, ecological, and economic goals can be widely programmed in plantation forests. Traditional targets of man- made forest management focused on timber production, and in consequence, China fir (Cunninghamia lanceolata), Japanese cedar (Cryptomeria japonica), Taiwan red cypress
(Chamaecyparis formosensis), and Taiwania (Taiwania cryptomerioides) are 4 important conifers with a large number of plantations in Taiwan (Huang et al. 2011). Numerous research reports studied the growth and yield for these 4 conifers because they possess excellent wood properties, high productivity, and commercial value (e.g., Hwang 1977, Chiu and Lo-Cho 2002, Yen et al. 2009, Huang et al. 2011). Beyond traditional timber production, we also found that many studies focused on assessing carbon sequestration by these conifers due to their high productivity (e.g., Lin et al. 2003, Yen et al. 2004, 2009, Yen and Huang 2006, Yen and Wang 2013).
On the other hand, most growth and yield studies focused on regional areas for these 4 conifers, and few addressed a larger scale.
This study focused on these 4 major conifer plantations distributed throughout Taiwan. Most man-made forests result from planting forests, and this is a common phe- nomenon in Taiwan with plantation forests covering approximately 420,000 ha in Taiwan (TFB 1995, Yen et al. 2013). Moreover, this forest type plays an important role in timber production, environmental protection, carbon storage, and other ecological services (Yen and Wang 2013). Quantifying diameter dis- tributions of stands can help assess the cur- rent status and future development of forests.
Therefore, it is an important task for manag- ing plantation forests.
This study developed diameter distribu- tions of plantations of 4 major Taiwanese co- nifer species with the Weibull function based on different approaches. The purposes of this study were to: (1) fit diameter distributions of stands with the Weibull function based on the MLE and PE methods, (2) compare the estimation ability between the MLE and PE methods, and (3) assess the applicability of the Weibull function among these 4 species.
MATERIALS AND METHODS Study areas
The study was conducted in plantations of 4 major Taiwanese conifer species, namely China fir, Japanese cedar, Taiwan red cypress, and Taiwania. The study area was located in Taiwan (22°30’N to 24°51’N, 120°39’E to 121°42’E) and at elevations of 410~2680 m.
These 4 conifers are dominant in man-made forests that occupy a broad area in Taiwan.
Data on these plantations were obtained from the National Forest Management Plan Revi- sion (NFMPR) of Taiwan, and all plantations belong to the Taiwan Forestry Bureau (TFB).
The NFMPR is an important task for deci- sion-making in forest management because it provides current growing stocks of forests for the TFB. The NFMPR is based on a system of permanent sample plots (PSPs) that contains 3188 PSPs distributed throughout Taiwan and covers most important forest types, including natural forests and man-made forests (Huang et al. 2011, TFB 2014). The system of PSPs was established by the TFB in 1997, and the first survey was completed in 2002 (Huang et al. 2011). The PSP has 2 main plot-sizes that contain 0.02 and 0.05 ha for man-made forests. As the stands consist of small trees and tree sizes are homogeneous, the PSP was suggested to adopt a small size (0.02 ha);
otherwise, a large PSP (0.05 ha) was adopted (Huang et al. 2011, TFB 2014). Records of the PSP survey contain detailed measures of DBH and tree height for each tree, and the PSP is repeatedly surveyed every 5 yr. The second survey was also completed, and the data of these 2 periods were obtained in this study. Because only a slight difference in the diameter distributions was shown between the 2 periods in each PSP, we selected the latter survey as samples for our analysis.
This study extracted data from 18, 88,
55, and 36 PSPs for China fir, Japanese cedar, Taiwan red cypress, and Taiwania, respective- ly. Detailed distributions of the PSPs of the 4 conifers are shown in Fig. 1.
Methods
The 3-parameter Weibull function was utilized to predict diameter distributions of the 4 conifer plantations based on the PSPs.
This function and its CDF type are defined in equations (1) and (2) (Bailey and Dell 1973):
f(x) = ( )
[ ]
c-1exp{-[ ]
c} and (1)F(x) = 1 - exp{-
[ ]
c}; (2)where x is the DBH; and a, b, and c are lo- cation, scale, and shape parameters of the Weibull function.
We adopted the MLE and PE to esti- mate parameters of the Weibull function. In general, when using the MLE to estimate the Weibull function, one needs to determine the location parameter, a, at the beginning stage of the process (Bailey 1974). This parameter was estimated based on a method proposed by Zanakis (1979) and is defined as:
â = ; (3)
where xi is the ith ordered value in the plot, and n is the number of trees.
As the parameter a is determined, we should calculate each DBH - â of trees for stands and let x’i = DBHi – â. After this transformation, the Weibull function can be regarded as a 2-parameter Weibull function.
The process of the MLE needs to define the maximum likelihood equations (L) as equa- tion (4), then take the logarithm of equation (4), and differentiate with respect to b and c, respectively, as equations (5) and (6). (Bailey and Dell 1973, Bailey 1974, Cao 2004, Lei 2008):
L(x’; b, c) = Πni=1 f(x’i; b, c) = Πni=1 ( )c-1
exp[-( )c], (4)
= 0, and (5)
= 0; (6)
where x’i is the ith ordered value of DBH- â, â is defined as in equation (3), and b and c are parameters of the Weibull function.
Parameters b and c can be solved from equations (5) and (6) according to the New- ton–Raphson method. For the detailed pro- cess of the MLE, please refer to Bailey (1974), Cao (2004), and Lei (2008).
On the other hand, the PE is based on special percentages of the CDF of the stand diameter distributions to predict the Weibull function, and 2 kinds of PE methods were used in this study, namely PE(I) and PE(II).
The former adopts the 24th, 63rd, and 93rd percentiles of the stand diameter distribu- tions (X.24, X.63, and X.93) as a basis to recover parameters of the Weibull function, and this approach was proposed by Abernethy (1981).
The latter only uses the 24th and 93rd percen- tiles subjected to the location parameter which is obtained, and these 2 percentages were proposed by Dubey (1967). PE(II) determines the location parameter the same as in equa- tion (3). According to the CDF of the Weibull Fig. 1. Distribution of samples of 4 conifers examined in this study (Huang et al. 2011).
function as shown in equation (2), relation- ships between the p-percentile value of the diameter distributions Xp and parameters of the Weibull function can be expressed as Xp = a + b {[-ln (1-p)]1/c}, where p represents the p-percentile of the diameter distributions, and a, b, and c are parameters of the Weibull func- tion (Clutter et al. 1983). Therefore, DBH at the 24th, 63rd, and 93rd percentiles of the stand diameter distributions can be expressed by the following equations (Clutter et al. 1983):
X.24 = a + b {[-ln (.76)]11/c}, (7) X.63 = a + b {[-ln (.37)]1/c} ≈ a + b, and (8) X.93 = a + b {[-ln (.07)]1/c}; (9) where Xp is the DBH at the p-percentile of the diameter distributions, and a, b, and c are pa- rameters of the Weibull function.
Since ln (.37) is approximately -1, equ- ation (5) can be simplified to a + b. In other words, the b value is revealed to be appro- ximately equal to the 63rd percentile of the stand diameter distributions when a = 0 (Bailey and Dell 1973, Clutter et al. 1983). The PE(I) solution of parameters a, b, and c is based on equations (7)~(9). Parameter c can be solved iteratively by the formula of (X.24 – X.63)/(X.93 – X.63) = [equation (7) - equation (8)] / [equation (9) - equation (8)]. Once the c value is deter- mined, the b value can be solved by equations (7)~(9), and then the a value is calculated as a = X.63 – b (Clutter et al. 1983). However, PE(II) only uses equations (7) and (9) to solve parameters b and c when parameter a is deter- mined as in equations (3). Parameter c can be solved based on equations (7) and (9) when parameter a is known. Once parameters a and c are obtained, parameter b can be solved from equations (7) and (9). PE(I) differs from PE(II) in the order of solving parameters, with the former beginning with parameter c, followed by parameters b and a; while the latter begins with parameter a, followed by parameters c and b. According to these rules,
parameters of the Weibull function were obtained for PE(I) and PE(II), and for the de- tailed processes, please refer to Dubey (1967), Abernethy (1981), and Clutter et al. (1983).
A goodness-of-fit test for the observed data and the Weibull distribution used the Kolmogorov-Smirnov (K-S) test to examine when the parameters were estimated from the data. The K-S statistic is based on the CDF of the data and the Weibull distribution and calculates its maximum differences as the criterion for examination (Sokal and Rohlf 1981). Because the Weibull distribution was predicted using 3 approaches (the MLE, PE(I), and PE(II)), each sample needs to com- pare the Weibull distributions with different approaches. We adopted α = 0.05 as a signifi- cance level for the K-S test for all samples.
RESULTS AND DISCUSSION Stand characteristics of samples for the 4 conifers
We found higher values for Japanese ce- dar and lower values for Taiwan red cypress for most stand characteristics except for the tree number ha-1 compared to the other spe- cies (Table 1). As to the special percentiles of DBH, the order was X.93 > X.63 > X.24 for all species. Because X.24, X.63, and X.93 were calculated from the DBH at the 24th, 63rd, and 93rd percentiles of the diameter distributions, it was expected that the larger percentiles pos- sessed larger values of the DBH. Moreover, we also found that values of the mean DBH were lower than the 63rd diameter distribution (X.63), regardless of species.
Parameters estimated from the 3 appro- aches for the 4 species
We estimated the parameters of the Weibull function with different approaches and found that the parameters varied with
the approaches except for parameter a with the MLE and PE(II) approaches (Table 2).
Because the same method [equation (3)] was used to estimate parameter a, the same results were obtained. The parameters imply a special meaning for the Weibull distribution where parameters a, b, and c indicate the initial lo- cation (the smallest tree), scale, and shape, respectively (Bailey and Dell 1973). Higher values of parameter a were found with PE(I) for China fir and Japanese cedar compared to the other approaches (Table 2). We found the smallest b values for Japanese cedar, Taiwan red cypress, and Taiwania with the MLE ap- proach, however for China fir it was with the PE(I) approach. Bailey and Dell (1973) pointed out that parameter c determines the shape of the Weibull distribution, and the dis- tribution types show positively skewed distri- butions when 1 < c < 3.6. We found smaller c values with the MLE approach for all species.
The range of c values was 1 < c < 3.6 for all species regardless of the approach, implying that most of the stand diameter distributions were positively skewed. Moreover, simulated samples were not equal among approaches for each species in Table 2, because all samples
could be simulated by the MLE and PE(II) approaches, but some samples could not be estimated by the PE(I) approach. Two main types were found in these failed samples for which parameter c of the samples could not successfully be solved by equations (7)~(9), and a negative value was estimated for pa- rameter a of those samples. The process of solving parameters begins with parameter c, followed by parameter b, and then parameter a for PE(I). Because parameter a is influenced by the other parameters, this is probably why a negative value was obtained. However, parameter a indicates the smallest DBH of the stands (Bailey and Dell 1973). Therefore this parameter should be a positive value. If a negative value was estimated for certain samples, then those samples were eliminated in this step. The pass ratios of PE(I) varied with species; for instance, the respective pass ratios were 44.4, 60.0, 63.6, and 72.2% for China fir, Japanese cedar, Taiwan red cypress and Taiwania (Table 2).
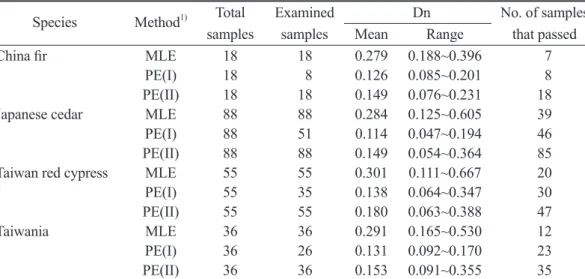
The K-S test for examining the 3 appro- aches for 4 species
We used the K-S test to examine diameter Table 1. Stand characteristics of sample number, age, mean diameter at breast height (DBH), mean tree height, and the 24th, 63rd, and 93rd percentiles (X) of the diameter distributions for 4 conifer species
Stand characteristics Species
China fir Japanese cedar Taiwan red cypress Taiwania
Sample number 18 88 55 36
Age (yr) 32.2±10.91) 41.7±13.3 23.3±7.7 26.0±8.0
Tree number (stems ha-1) 1345±875 1146±586 1122±478 1268±641
Mean DBH (cm) 21.1±5.2 28.8±7.8 19.2±4.4 22.0±5.5
Mean tree height (m) 11.4±2.2 16.1±3.3 9.7±2.6 11.8±3.6
Baseal area (m2 ha-1) 45.8±27.1 73.3±33.8 35.3±18.9 54.9±33.7
X.24 16.7±4.1 22.8±7.0 15.0±3.9 17.2±5.0
X.63 22.7±5.7 31.2±8.4 20.6±4.8 24.0±6.2
X.93 29.1±7.8 40.5±10.9 26.7±5.8 31.4±8.3
1)Mean±standard deviation.
distributions of stands with the 3 approaches (Table 3) and calculated the ratios of samples that passed to total samples as an indicator
(Rps/ts) (Fig. 2). In general, the PE(II) ap-
proach was superior to the other approaches, and this approach had higher Rps/ts values for all species; for instance, respective Rps/ts
values for China fir, Japanese cedar, Taiwan red cypress, and Taiwania were 100, 96.6, 85.5, and 97.2%. Ranges of Rps/ts values were 33.3~44.3 and 44.4~63.9% for the MLE and PE(I) approaches for all species. We also found the same trend for each species, that is, the Rps/ts of PE(II) > PE(I) > MLE.
In a previous study, site index curves were established for these 4 conifers based on the same database (Huang et al. 2011).
The potential productivity of plantations can be assessed following this site index system, and in this study, we fit diameter distributions for these 4 conifers. Quantifying diameter
distributions of plantation forests can help in understanding the stand structure and manag- ing forests. We also found that various sta- tistical methods were adapted to examine the observed data and the Weibull distribution for forests, such as the K-S test, the Anderson- Darling statistic, and the error index (Cao 2004). Among those methods, the K-S test is widely utilized to test the Weibull distribution in forestry (e.g., Nanang 1998, Cao 2004, Li and Yen 2010), because the K-S test pos- sesses many advantages, such as its simple performance and sensitivity when comparing differences in skewness and dispersion (Sokal and Rohlf 1981). Therefore, we chose the K-S test as a method to examine the observed data and the Weibull distribution estimated by the 3 approaches. From the results of this test, we found that 3 approaches can be obviously dis- tinguished by the K-S test, and the PE(II) ap- proach was suitable for the 4 conifer planta- Table 2. Estimated parameters of the Weibull function in each permanent sample plot (PSP) from 3 approaches for 4 species
Species Approaches1) Simulated Parameters
samples2) a b c
China fir MLE 18 9.39±3.613) 10.33±4.43 1.54±0.70
PE(I) 8 12.92±3.99 8.86±1.92 1.55±0.58
PE(II) 18 9.39±3.61 12.72±4.55 2.33±0.70
Japanese cedar MLE 88 12.26±5.25 14.63±8.13 1.88±0.92
PE(I) 51 13.54±10.60 16.53±8.79 2.17±1.24 PE(II) 88 12.26±5.25 18.15±8.39 2.35±0.86
Taiwan red cypress MLE 55 9.56±4.49 8.25±3.77 1.66±0.72
PE(I) 35 9.06±5.64 10.62±6.26 1.93±0.87
PE(II) 55 9.56±4.49 10.28±3.83 2.04±0.72
Taiwania MLE 36 9.16±4.21 11.21±5.37 1.68±0.86
PE(I) 26 8.47±6.98 14.34±7.28 2.72±1.83
PE(II) 36 9.16±4.21 14.07±5.94 2.37±0.90
1)MLE, maximum likelihood estimator; PE(I), percentile estimator (I); and PE(II), percentile estima- tors (II).
2)Simulated samples indicate that the data were successfully predicted by the method. Because some samples failed to be predicted by the PE(I) approach, numbers of simulated samples are not equal for the same species.
3)Mean±standard deviation.
tions compared to the other approaches. This approach will be taken into consideration when developing whole-stand models based on stand diameter distributions.
Examples of the simulation effects for different approaches
In order to show relationships between the observed data and the Weibull distribu-
tion with different approaches, 2 samples of Japanese cedar and China fir were used for illustration (Fig. 3). The first sample (Japanese cedar) showed that diameter distributions passed the K-S examination with the PE(I) and PE(II) approaches but failed to pass for the MLE approach. Parameters a, b, and c were respectively predicted to be 8.20, 12.59, and 1.83 for the MLE; 12.34, 9.79, and 2.29 Table 3. The Kolmogorov-Smirnov test for examining 3 approaches for 4 species
Species Method1) Total Examined Dn No. of samples
samples samples Mean Range that passed
China fir MLE 18 18 0.279 0.188~0.396 7
PE(I) 18 8 0.126 0.085~0.201 8
PE(II) 18 18 0.149 0.076~0.231 18
Japanese cedar MLE 88 88 0.284 0.125~0.605 39
PE(I) 88 51 0.114 0.047~0.194 46
PE(II) 88 88 0.149 0.054~0.364 85
Taiwan red cypress MLE 55 55 0.301 0.111~0.667 20
PE(I) 55 35 0.138 0.064~0.347 30
PE(II) 55 55 0.180 0.063~0.388 47
Taiwania MLE 36 36 0.291 0.165~0.530 12
PE(I) 36 26 0.131 0.092~0.170 23
PE(II) 36 36 0.153 0.091~0.355 35
1) MLE, maximum likelihood estimator; PE(I), percentile estimator (I); and PE(II), percentile estima- tors (II).
Fig. 2. Ratios of samples that passed to total samples among the 3 approaches for each species. MLE, maximum likelihood estimator; PE, percentile estimator.
for the PE(I); and 8.20, 14.29, and 3.34 for the PE(II) approach (the significance level Dn
= 0.1491 for the K-S test). The second sample (China fir) showed that diameter distributions only passed the K-S examination with the PE(II) approach, while the other approaches failed. Parameters a, b, and c were respective- ly predicted to be 9.18, 7.10, and 1.20 for the MLE; -44.74, 65.80, and 11.85 for the PE(I);
and 9.18, 10.29, and 1.83 for the PE(II) ap- proach (the significance level Dn = 0.2147 for the K-S test). We also found that parameter a had a negative value when the PE(I) approach was used. This is unreasonable, because this
parameter indicates the DBH of the smallest tree. Therefore, we do not suggest the PE(I) approach when parameter a is a negative value.
We also found that many research studies focused on estimating the Weibull function with different approaches for diameters of stands worldwide. For instance, Zarnoch and Dell (1985) evaluated the MLE and PE as es- timators to estimate the Weibull function for diameters of stands and found that the former had superior smaller biases but larger vari- ances than the latter. They also pointed out that both of these approaches can adequately Fig. 3. Two samples of Japanese cedar and China fir which illustrate the simulation
effects between observed data and the Weibull distribution with different approaches, (a) diameter distributions of the Japanese cedar samples that passed the Kolmogorov-Smirnov (K-S) examination for the percentile estimator (PE(I) and PE(II) approaches); (b) among diameter distributions of China fir samples, for which only the PE(II) approach passed the K-S examination. DBH, diameter at breast height.
estimate diameter distributions of pine planta- tions (Zarnoch and Dell 1985). Nanang (1998) assessed the MLE, PE, and moment estima- tors (MEs) to estimate the Weibull distribu- tion for neem (Azadirachia indica) plantations and found that the MLE and ME approaches were superior to the PE approach after exami- nation by the K-S test. Lei (2008) compared the MLE, ME, and least-squares regression method (LSM) to estimate the Weibull distri- bution for China pine (Pinus tabulaeformis) and used the mean square error and sample size as criteria to compare these methods. The results showed that the ME approach was su- perior to the others for estimating the Weibull distribution. However, our study revealed that the PE(II) approach was most suitable for the 4 conifer plantations. Overall, an interesting result was the variation in the suitability of approaches with different tree species.
CONCLUSIONS
The importance of plantations arises from current forest management practices because many environmental, ecological, and economic targets are widely programmed in plantation forests. A large number of man- made forests of approximately 420,000 ha are distributed around Taiwan. Among these man-made forests, China fir, Japanese ce- dar, Taiwan red cypress, and Taiwania are 4 important conifers and are widely planted in mountain areas with good economic and eco- logical values. We also found that numerous research studies focused on growth and yield estimates of these 4 conifers, especially on a regional scale, whereas, few studies addressed larger scales. Quantifying diameter distribu- tions of stands is a valid expression to show distributions of tree sizes and can provide fun- damental information for different aspects of forest management. The Weibull function is
widely utilized to fit diameter distributions of stands, and their simulation effects may vary with different approaches. This study used the Weibull function to estimate diameter distri- butions for the 4 conifers based on PSP data, and these PSPs were distributed throughout Taiwan. Three approaches were chosen to estimate the parameters of the Weibull func- tion for these 4 conifer plantations, and we found that the PE(II) approach was superior to the other approaches after examining the goodness-of-fit using the K-S test. Respective pass rates of samples were 100, 96.6, 85.5, and 97.2% for China fir, Japanese cedar, Tai- wan red cypress, and Taiwania. This indicates that the PE(II) approach is the best estimator, regardless of species, and this approach will be taken into consideration when developing whole-stand models based on stand diameter distributions in the future.
ACKNOWLEDGEMENTS
The authors would like to thank the Tai- wan Forestry Bureau, Council of Agriculture, Taiwan, for financial supporting this study under contract no. 101AS-13.4.2-FB-e1.
LITERATURE CITED
Abernethy NC. 1981. Predicted and projected diameter distributions of thinned old-field slash pine plantations. [master’s thesis]. Athens, GA:
School of Forest Research, Univ. of Georgia.
129 p.
Avery TE, Burkhart HE. 1983. Forest mea- surements. New York, NY: McGraw-Hill. 331 p.
Bailey RL. 1974. Computer program for quan- tifying diameter distributions with the Weibull function. For Sci 20:299.
Bailey RL, Dell TR. 1973. Quantifying diam- eter distribution with the Weibull-function. For Sci 19:97-104.
Cao QV. 2004. Predicting parameters of a Weibull function for modeling diameter distri- bution. For Sci 50:682-5.
Cao QV, Burkhart HE, Lemin RC, Jr. 1982.
Diameter distributions and yields of thinned loblolly pine plantations. Blacksburg, VA:
School of Forestry and Wildlife Resources, Virginia Polytechnic Institute and State Univ.
Publication FWS-1-82. 62 p.
Chiu CM, Lo-Cho CN. 2002. Studies on stand density of young red cypress (Chamae- cyparis formosensis Matsum.) plantations. Tai- wan J For Sci 17(2):205-17. [in Chinese with English summary].
Clutter JL, Bennett FA. 1965. Diameter dis- tributions in old-field slash pine plantations.
GA For Res Counc Rep 13:9.
Clutter JL, Fortson JC, Pienaar LV, Brister GH, Bailey RL. 1983. Timber management: a quantitative approach. New York, NY: J Wiley.
333 p.
Davis LS, Johnson KN, Bettinger PS, How- ard TE. 2001. Forest management. 4th ed.
New York, NY: McGraw-Hill. 804 p.
Dubey SD. 1967. Some percentile estimators for Weibull parameters. Technometrics 9:119- 29.
Huang KL, Wang CH, Yen TM. 2011. Es- tablishing site index curves for four main Tai- wanese coniferous plantations. Q J Chin For 44:553-66. [in Chinese with English summary].
Hush B, Miller C, Beers T. 1982. Forest men- suration. New York, NY: Krieger Publishing.
402 p.
Hwang KK. 1977. Studies on the growth of planted forest of red cypress. Q J Chin For 10(2):95-109. [in Chinese with English sum- mary].
Hyink DM, Moser JW. 1983. A generalized framework for projecting forest yield and stand structure using diameter distributions. For Sci 29:85-95.
Lee JS, Chen CT. 1991. Study on the stand
structure and composition of species in natural forests of Cho-Kou watershed. Annu Taiwan Mus 34:11-32. [in Chinese with English sum- mary].
Lee JS, Jong SS. 1996. A study on the stand structure of natural forest in Ta-Hsueh-Shan area. Bull Exp For Natl Chung Hsing Univ.
18:43-57. [in Chinese with English summary].
Lei Y. 2008. Evaluation of three methods for estimating the Weibull distribution parameters of Chinese pine (Pinus tabulaeformis) J For Sci 54:566-71.
Li LE, Yen TM. 2010. Thinning effects on stand and tree levels of Taiwan red cypress (Chamaecyparis formosensis Matsum.) 4 years after thinned. Q J Chin For 43:249-60. [in Chi- nese with English summary].
Lin KC, Wang CP, Huang CM, Horng FW, Chiu CM. 2003. Estimates of biomass and car- bon storage in two Taiwania plantations of the Liukuei Experimental Forest. Taiwan J For Sci 19:225-32. [in Chinese with English summary].
Nanang DM. 1998. Suitability of the normal, log-normal and Weibull distributions for fitting diameter distributions of neem plantations in northern Ghana. For Ecol Manage 103:1-7.
Nelson TC. 1964. Diameter distribution and growth of loblolly pine. For Sci 10:105-15.
Sokal RR, Rohlf JF. 1981. Biometry: the principles and practice of statistics in biologi- cal research. 2nd ed. San Francisco, CA: WH Freeman. 859 p.
TFB. 1995. The third national forest resources and land use in Taiwan. Taipei, Taiwan: Tai- wan Forestry Bureau (TFB). 258 p. [in Chinese with English summary].
TFB. 2014. Taiwan Forestry Bureau. Available at http://www.forest.gov.tw. Taipei, Taiwan:
Taiwan Forestry Bureau (TFB). Accessed Oc- tober 2014.
Yen TM. 1999a. Comparisons of direct and indirect estimation methods for stand structure of Chamaecyparis formosensis plantations. Q J
Chin For 32:347-56. [in Chinese with English summary].
Yen TM. 1999b. Constructing aerial photo volume tables by percentile estimators. Q J Chin For 32:233-47. [in Chinese with English summary].
Yen TM, Ai LM, Li CL, Lee JS, Huang KL.
2009. Aboveground carbon contents and stor- age of three major Taiwanese conifer species.
Taiwan J For Sci 24(2):91-102.
Yen TM, Huang KL. 2006. Estimating above- ground carbon storage by China-fir (Cun- ninghamia lanceolata) trees. Taiwan J For Sci 21(2):273-80. [in Chinese with English sum- mary].
Yen TM, Ji YJ, Lee JS. 2010. Estimating bio- mass production and carbon storage for a fast- growing makino bamboo (Phyllostachys maki- noi) plant based on the diameter distribution model. For Ecol Manage 260:339-44.
Yen TM, Lee JS, Huang KL, Liu CC. 2004.
Tree growth and biomass of a mature China- fir (Cunninghamia lanceolata) plantation. Q J Chin For 37(2):157-64. [in Chinese with Eng- lish summary].
Yen TM, Lee JS, Li CL, Chen YT. 2013.
Aboveground biomass and vertical distribution of crown for Taiwan red cypress 20 years after thinning. Dendrobiology 70:109-16.
Yen YM, Wang CT. 2013. Assessing carbon storage and carbon sequestration for natural forests, man-made forests, and bamboo forests in Taiwan. Int J Sust Develop World 20:455-60.
Zanakis SH. 1979. A simulation study of some simple estimators for the three-parameter Weibull distribution. J Stat Comput Simulat 9:101-16.
Zarnoch SJ, Dell TR. 1985. An evaluation of percentile and maximum likelihood estimators of Weibull parameters. For Sci 31:260-8.