No. 34, June 2007, pp. 1-36
Is Taiwan's Lowest-low Fertility Reversible Via Socio-economic
Development?
+Chao-Nan CHEN
*and Paul Ke-Chih LIU
**+ Acknowledgement: This paper was original presented at International Conference on "Low- est-Low Fertility and Responses: The French Experience and East Asia Real type," sponsored by the Research Center for Humanities and Social Science, Academia Sinica, Taipei, Taiwan, October 27-28, 2005.
We are grateful for Professor FM Huang's helpful assistance in solving programming prob- lems.
* Professor, Institute of Healthcare Administration, Asia University; Adjunct Research Fellow, Institude of Economic, Academia Sinica
** Corresponding Research Fellow, Institute of Economic, Academia Sinica Received: 2006/11/10; accepted: 2007/03/12
Abstract
In this study, we assume that socio-economic development is the underlying mechanism for population changes. In the past 50 years, Taiwan has experienced drastic socio-economic changes and rapid population change. Simultaneous equations are thus used to integrate the effect of Taiwan's socio-economic factors on the projection of its age-specific fertility rate (ASFR). The estimated ASFR is then used to make population projections for Taiwan in the period 2004-2033. The results of our low and medium projections are close to the official (CEPD) medium-high projection for the same time period. The results of the high projection for both studies are rather similar too. Specifically, if Taiwan's socio-economic development grows at a high variant, its fertility would rebound to replacement level by 2033. If it follows the medium variant, fertility would rise to 1.6 births per woman. But if Taiwan's future socio-economic development grows sluggishly as in the assumed low variant case, Taiwan's fertility would remain at a lowest-low level.
Key words: Lowest-low fertility, population projection, socio-economic development
Toward the prevalence of lowest-low fertility among developed and some developing societies, two perspectives have been proposed. One is that period total fertility rate (PTFR) is distorted because of delayed marriage (Bongaarts and Feeney 1998; Bongaarts 2001). The other one states that the lowest-low fertility is a temporary phenomenon caused by a high unemployment rate and economic recession (Knodel et al. 1996).
Although they attribute current lowest-low fertility to different causes, we consider both causes to reflect the influence of social economic development. If factors of economic development are properly considered in the estimation of PTFR, we will have a more reliable picture about fertility change.
Taiwan has experienced not only drastic social economic changes but also a lowest-low fertility level since 1998. The period total fertility rate in Taiwan fell from 1.77 in 1997 to 1.46 in 1998. It then decreased from 1.56 in 1999 to 1.23 in 2003, with the exception of a slight rebound to 1.68 in 2000 because of the year of the dragon. It has been shown that the the tempo effect caused by delayed marriage is -0.4 births for Taiwan in the period 1985-89 (Bongaarts 2001). In the past 20 years, Taiwan has also experienced a slowdown in economic growth. Its GDP growth rate decreased from 8.5% in 1983 to 3.3% in 2003.
In response to the concerns about lowest-low fertility, the Council of Economic Planning and Development (CEPD, 2006) made a series of population projections based on United Nations' projections for developed societies and Taiwan's own population trend. The projections' TFR assumptions range from a low level of 0.74 to a high level of 2.1. In view of the recent, drastic fertility change, 1.6 is referred to as the medium-level projection, implying that this is the expected or most likely course for Taiwan's population trend. Overall speaking, these projections are based on
the a priori experience of other developed countries. They thus may serve as benchmarks for future possible courses of population change. As no mechanism underlying these projections is specified, it is difficult to assess which projection is the most likely course.
In this study, simultaneous equations are used to integrate the effect of social economic factors on age-specific fertility rates (ASFRi). The thus estimated ASFRi is used to make population projections. Since CEPD's projections are based on the a priori experience of other developed countries, they may serve as benchmarks. Comparing our projection with CEPD's, we may obtain an answer to the question "Is Taiwan's lowest-low fertility reversible?" More specifically, we would like to know whether, when factors of social economic development are properly considered in population projections, Taiwan will have a fertility approaching the replacement level. The rest of this paper is arranged as follows: (1) Literature review, (2) Taiwan's demographic and social development trend, (3) The estimation of ASFRi, (4) The results of the projection, and (5) Summary and discussion.
I. Literature Review
In the 1970s, classical demographic transition theorists and United Nations demographers found that fertility decline was associated with socio-economic development. When long-term fertility transition has been completed, socio-economic changes can go no further and then a threshold of replacement fertility will prevail in the long run (United Nations 1973, 1974).
A recent study has cast doubt upon the above conclusion. Bongaarts (2001) found that, on the contrary, "below-replacement fertility is now the
norm in the developed world, but it is also observed in a small but growing number of populations elsewhere, in particular in those Southeast Asia countries where economic development has been extremely rapid in recent decades" (Bongaarts 2001: 262-263). Bongaarts further proposes that two types of factors caused by social economic development are linked to fertility change. The first one is factors enhancing fertility relative to desired family size, and the other, factors reducing fertility. The former includes desired family size, unwanted fertility, replacement of deceased children, and sex preference. In post-transition countries, most of these factors have limited effect. Unwanted fertility is small because of effective birth control. A further reduction in infant and child mortality is limited, as mortality is already very low. Gender preference will presumably decline as societies develop and increasingly treat boys and girls equally. However, the effect of desired family size is debatable. One school of thought proposes that replacement fertility is a theoretical threshold that has little or no meaning for individual couples building their families, and below- replacement fertility is expected to be the norm in post-transitional societies (Demeny 1997). On the contrary, some analysts believe that the current low levels of post-transitional fertility are a temporary phenomenon (Knodel et al. 1996). This perspective is supported by data on desired family size, which has remained near or above two children in all societies for which measures are available.
Factors reducing fertility relative to desired family size include rising age of childrearing, involuntary family limitation, and competing preferences. Delay in marriage and the timing of child rearing may distort period total fertility, which is referred to as the tempo effect. There are various ways to adjust TFR for the tempo effect (Bongaarts and Feeny 1998). It has been reported that the tempo effect can be as high as -0.4 births
(Bongaarts 2001). As societies move into the post-transitional phase, better education and high female labor participation rate may delay females' age at marriage and childrearing and even females' marriage preference. In addition, high divorce will increase the period of involuntary fertility, but the decrease of breast feeding has a decreasing effect on fertility. These effects are partly reflected in the proportion of currently married women.
In societies where births out of wedlock are not well accepted, not only later marriage but also less marriage is critical to the level of fertility. After a careful analysis of factors about values, institutions, and behaviors, Retherford et al. (2001) conclude that in Japan a key factor has been the near-complete erosion of the institution of arranged marriage, which has not been fully compensated by the emergence of volunteer associations and other social institutions where single men and women with similar interests can readily meet each other. A similar finding was also noted in Taiwan (Chen 2005).
Overall speaking, female labor force participation is related to social economic development and serves as an important factor in fertility.
Previous research shows that there is a negative relationship between fertility and the female labor force participation rate. It is striking to note that the relationship is reversed in the findings of some recent empirical research, both longitudinal and cross-sectional (Buts 1979; Macunovich 1995, 1996; Namkee et al. 2002; Adsera 2004). This finding lends support to the possible reversal of low fertility back to a replacement or even higher level in the post-transitional phase. In brief, factors related to female labor force participation deserve our serious consideration in fertility estimation.
Among them, education and change in industrial composition are the two most important factors.
In brief, there are multiple factors influencing fertility. The
multiplicity itself gives rise to the difficulty of estimating fertility. Their causal interrelationships make fertility estimation even more complicated.
In this study, simultaneous equations are used to tackle the problems.
Ⅱ. The Trend of Taiwan's Fertility and Social Development
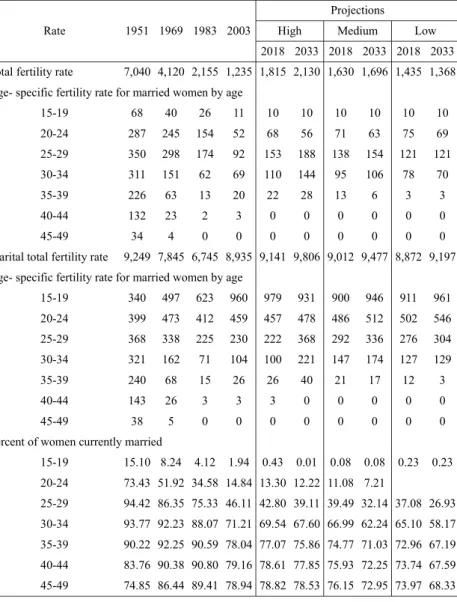
Taiwan's fertility has started to decline since 1951. Based on demographic characteristics of fertility decline, it can be divided into three stages, i.e. the traditional stage, the modern stage, and the post-transitional stage. In the traditional stage, Taiwan's total fertility rate fell from 7.0 births per woman in 1950 to 4.1 births in 1969. In the modern stage, it further fell to 2.2 births per woman by 1983. In the post-transitional stage, it not only continued to decline but remained at the lowest-low level in the later part of this stage. By 2003, it was a mere 1.2 births per woman (see Table 1).
The drastic fertility decline was accompanied by accelerating socio- economic development. The relationship between fertility decline and social and economic development may provide a solid basis for a systematic investigation into fertility decline. Therefore demographic characteristics and social development of the three fertility stages deserve a brief description.
(1) The traditional stage (1951-1968)
Consistent with the experience of other developed societies, Taiwan's mortality decline preceded fertility decline. The available data show that Taiwan's mortality started to decline in 1905. In this phase, mortality decline was largely concentrated among young age groups. The survival rate to age 20 years had increased from 0.583 in 1920 to 0.843 in 1951. This
Table 1. Fertility rates and percent of currently married for transition turning point and projection years, 1951-2033, Taiwan
Rate 1951 1969 1983 2003
Projections
High Medium Low
2018 2033 2018 2033 2018 2033 Total fertility rate 7,040 4,120 2,155 1,235 1,815 2,130 1,630 1,696 1,435 1,368 Age- specific fertility rate for married women by age
15-19 68 40 26 11 10 10 10 10 10 10
20-24 287 245 154 52 68 56 71 63 75 69
25-29 350 298 174 92 153 188 138 154 121 121
30-34 311 151 62 69 110 144 95 106 78 70
35-39 226 63 13 20 22 28 13 6 3 3
40-44 132 23 2 3 0 0 0 0 0 0
45-49 34 4 0 0 0 0 0 0 0 0
Marital total fertility rate 9,249 7,845 6,745 8,935 9,141 9,806 9,012 9,477 8,872 9,197 Age- specific fertility rate for married women by age
15-19 340 497 623 960 979 931 900 946 911 961
20-24 399 473 412 459 457 478 486 512 502 546
25-29 368 338 225 230 222 368 292 336 276 304
30-34 321 162 71 104 100 221 147 174 127 129
35-39 240 68 15 26 26 40 21 17 12 3
40-44 143 26 3 3 3 0 0 0 0 0
45-49 38 5 0 0 0 0 0 0 0 0
Percent of women currently married
15-19 15.10 8.24 4.12 1.94 0.43 0.01 0.08 0.08 0.23 0.23 20-24 73.43 51.92 34.58 14.84 13.30 12.22 11.08 7.21
25-29 94.42 86.35 75.33 46.11 42.80 39.11 39.49 32.14 37.08 26.93 30-34 93.77 92.23 88.07 71.21 69.54 67.60 66.99 62.24 65.10 58.17 35-39 90.22 92.25 90.59 78.04 77.07 75.86 74.77 71.03 72.96 67.19 40-44 83.76 90.38 90.80 79.16 78.61 77.85 75.93 72.25 73.74 67.59 45-49 74.85 86.44 89.41 78.94 78.82 78.53 76.15 72.95 73.97 68.33 Sources:
(1) Statistics for 1951-2003 was adopted from the Ministry of the Interior, R. O. C., 2003 Taiwan- Fukien Demographic Fact Book.
(2) Statistics for 2013-2003 projected by the authors.
implies that the number of surviving children at 20 years old decreased from 6.9 children to 4.9 children. If we assume that in this period the desired family size was four, which is similar to the result of a 1965 fertility survey (Freedman et al. 1994), then the number of surviving children substantially exceeded the desired family size in most of this phase. In response to the pressure of an increasing number of unwanted children, married women of higher socio-economic status started to limit their family size in the late 1950s. Soon the government launched a nationwide family planning program in 1964, with an emphasis on older women who had already reached their desired family size. As a result, there was a drastic decrease in fertility for women aged 30 and above (see Table 1).
Concurrently, the government had promoted labor-intensive industry to siphon the agricultural surplus working force of unmarried young men and women from rural to urban areas. In the period 1951-69, the female workforce employed in non-agricultural sectors increased from 26% to 61%
(see Table 1). The successful transition is attributable to many factors, but the government policies promoting development of education and human resources were the most instrumental ones. More specifically, in this period the government on one hand expanded universal six-year primary education to nine years in 1968, and on the other hand emphasized on vocational education and skill training in order to provide an adequate workforce for the primary stage of industrialization (Liu 1992). Under the influences of social development, both PTFR and desired number of children (DSC) started to decline, and the gap between excess fertility and the desired family size of four had been narrowed down.
(2) The Modern Stage (1969-1983).
As the agricultural surplus labor was becoming exhausted in the late
1960s, married women who had completed childbearing started to re-enter the labor market and brought more and more women to non-agricultural sectors. In general, women were at first mostly relegated to static jobs with scant earnings in labor-intensive industries. When the government upgraded the industries to become capital-intensive in the early 1980s, women employed in white collar jobs increased from 14% in 1969 to 26%
in 1983. At the same time the proportion of higher education for the population aged 15 and over had also increased from 5% to 11% (Table 1).
In the process, Taiwan was transformed from a developing society into an industrialized urban society. By 1983 women employed in non-agriculture increased to 84% of total employed women and the population living in urban areas increased to 70%. The per capita annual income increased eightfold, from NT$ 12,800 to 103,100 (equivalent to US$ 320-2,570).
In response to this rapid progression, the average age at first marriage for women steadily increased to 25 years, and the desired family size fell to 2.8 children by 1983 (see Table 1). On the other hand, the total fertility rate declined rapidly and met the prevailing desired family size for a brief period around the early 1970s. In this period fertility decline was mainly the contribution of women aged 20-30. Although fertility of the youngest cohort, aged 15-19, increased substantially, its proportion of being married was negligible and had a limited effect on PTFR (see Table 2).
(3) The post-transitional stage (1984-2003)
During the period 1984-2003, there was a drastic change in per capita annual income and fertility. At first, income continued to increase from NT
$ 103,100 in 1984 to NT$ 399,000 in 2000. It then dipped to NT$ 387,000 in 2001 and slowly recovered to NT$ 402,000 in 2003. After the completion of the fertility transition in 1983, the total fertility rate virtually
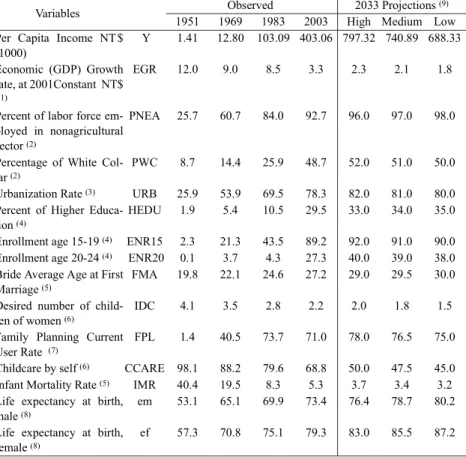
Table 2. Indicators of Social and Economic Development at Fertility Transition Turning Point and Projected Years : Taiwan, 1951-2033
Variables Observed 2033 Projections(9)
1951 1969 1983 2003 High Medium Low Per Capita Income NT $
(1000)
Y 1.41 12.80 103.09 403.06 797.32 740.89 688.33
Economic (GDP) Growth rate, at 2001Constant NT$
(1)
EGR 12.0 9.0 8.5 3.3 2.3 2.1 1.8
Percent of labor force em- ployed in nonagricultural sector(2)
PNEA 25.7 60.7 84.0 92.7 96.0 97.0 98.0
Percentage of White Col- lar(2)
PWC 8.7 14.4 25.9 48.7 52.0 51.0 50.0
Urbanization Rate(3) URB 25.9 53.9 69.5 78.3 82.0 81.0 80.0 Percent of Higher Educa-
tion(4)
HEDU 1.9 5.4 10.5 29.5 33.0 34.0 35.0
Enrollment age 15-19(4) ENR15 2.3 21.3 43.5 89.2 92.0 91.0 90.0 Enrollment age 20-24(4) ENR20 0.1 3.7 4.3 27.3 40.0 39.0 38.0 Bride Average Age at First
Marriage(5)
FMA 19.8 22.1 24.6 27.2 29.0 29.5 30.0
Desired number of child- ren of women(6)
IDC 4.1 3.5 2.8 2.2 2.0 1.8 1.5
Family Planning Current User Rate (7)
FPL 1.4 40.5 73.7 71.0 78.0 76.5 75.0
Childcare by self(6) CCARE 98.1 88.2 79.6 68.8 50.0 47.5 45.0 Infant Mortality Rate(5) IMR 40.4 19.5 8.3 5.3 3.7 3.4 3.2 Life expectancy at birth,
male(8)
em 53.1 65.1 69.9 73.4 76.4 78.7 80.2
Life expectancy at birth, female(8)
ef 57.3 70.8 75.1 79.3 83.0 85.5 87.2
Sources: Statistics for 1951-2003 were adapted from:
(1) Directorate-General of Budget, Accounting and Statistics, R. O. C., National Income of the Re- public of China, Taiwan Area, 2004.
(2) Directorate-General of Budget, Accounting and Statistics, R. O. C., Yearbook of Manpower Sur- vey Statistics, 2004.
(3) Council for Economic Planning and Development, R. O. C., Urban and Regional Development Statistics, 2004.
(4) Ministry of Education R. O. C., Educational Statistics of the Republic, 2004.
(5) The Ministry of the Interior, R. O. C., Taiwan-Fukien Demographic Fact Book.
(6) Directorate-General of Budget, Accounting and Statistics, R. O. C., 2004 Report on Women's Marriage, Fertility and Employment, Taiwan Area, for various survey years; for non survey years data were interpolated.
(7) The Institute of Family Planning KAP surveys for various survey years; for non survey years data were interpolated.
(8) The Ministry of the Interior, R. O. C., Abridged Life Tables of Taiwan-Fuchien Area, 2004.
(9) Projected by the authors.
stabilized at about 1.8 births in the period 1983-1997 (see Figure 1).
Thereafter it fell with fluctuations to the lowest-low fertility of around 1.3 births during the period 1998-2003. Meanwhile the desired surviving family size decreased steadily from 2.85 in 1983 to 2.26 in 2003. Therefore, the fertility deficit gap tended to close up gradually. Taiwan's below- replacement fertility, like all nations that completed fertility transition, was largely attributable to ongoing shifts in the timing of childbearing. The rise in timing of childbearing mainly resulted from the rise in average age at first marriage of women from 24.6 years old in 1983 to 27.2 in 2003 (see Table 1).
The above brief review of the fertility transition and its socio- economic background suggests that mortality decline is the prerequisite factor behind the onset of fertility decline. Industrialization, urbanization, female education, and non-agricultural employment are the factors which played a crucial role in subsequent stages of fertility transition in Taiwan.
The developments of these factors are closely interwoven and have profound impacts on the demographic choices. Urbanization leads to a radical change in lifestyle. Extension of education years involves changes in age at first marriage, childbearing timing, and number of births. Female employment induces prolonged single-hood, needs for childcare services, and changes in family arrangement and management.
Ⅲ. The Estimation of ASFR
iThe above discussion shows that fertility change is related to social development factors. The relationship is specified in the following equations.
!
Here we assume that ASFRiis affected by the proportion of currently married women (MARi), age-specific marital fertility (ASMFR), and percent of labor force employed in non-agricultural sectors (PNEA). PNEA is further broken down into two dummy variables. D1PNEA indicates a dummy variable for the period 1951-1970; and D2PNEA, for the period 1971-1985. The reference period is 1986-2033.
The second equation shows that percent married (MAR) is explainable by percent of higher (college and above) education (HEDU), bride's average at first marriage (FMA) and women's labor force participation rate (WLPR).
In the third equation, seven instrumental variables are used, including desired number of children for women aged 15 and above (IDC), percent of current family planning users (FPL), children cared for by self (CCARE), women's labor participation rate for the age group 15-19 (WLPR15) and the age group 20-24 (WLPR20), infant mortality rate (IMR), and per capita annual income in NT$ (Y). Finally, we use six instrumental variables to explain women's labor participation, including enrollment percent for the age group 15-19 (ENR15) and age group 20-24 (ENR20), economic growth rate (EGR), percent of white collar (PWC), and urbanization rate (URB). In total, there are 13 instrumental variables used to estimate ASFRi. Among them, only CCARE is dichotomized. Code 1 is assigned to women who care for their children by themselves; otherwise, code 0. The remaining 13 variables are integers.
As our study period was from 1951 to 2003, 52 annual observations
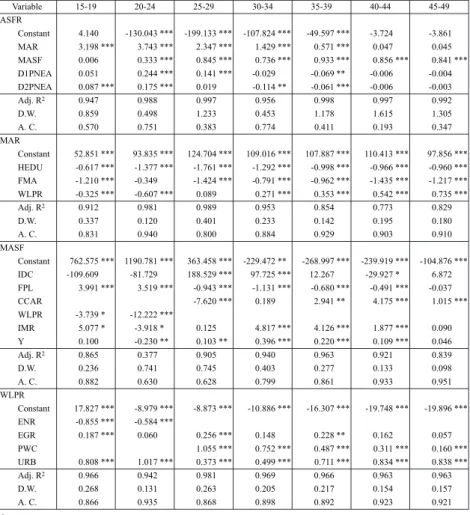
were used for the estimation of ASFRiwith a system which consisted of four stochastic equations. The system was estimated by the 3 stage least squares (3SLS) method with a second-order autocorrelation corrections model. The estimated regression coefficients are presented in Table 3.
Table 3 shows that the estimated coefficients of the four behavioral equations are satisfactory, with the exception of women aged 15-20 and 45-49. In particular, the unexpected positive signs for the coefficients of percent of labor force employed in non-agricultural sector for all age groups under 30 needs further intensive studies. Most of the estimated standard errors are small enough to give a value of t statistically significant at the 0.01 level. Some of the Durbin Watson coefficients are typically low, implying that there is no auto-correlation problem. With the exceptions mentioned above, most of the signs of the individual regression coefficients are consistent with a priori expectations.
Table 3 also shows that among the 13 instrumental variables, desired number of children is the most important one. The coefficient is much greater than the coefficients of other variables. It is also noted that the three age groups, 15-19, 20-24, and 40-44, have a negative coefficient, implying that there is a drastic decrease in ideal family size among younger cohorts and a smaller degree of decrease among the cohort aged 40-44. In addition, we also note that the proportion of being married (MARi) is the most important variable for the estimation of ASFRi. Six out of seven MARi
coefficients are positive and significant at the 0.01 level. The results indicate that a decline in marriages may be a critical issue in the future.
With the regression coefficients shown in Table 3 and the expected target set for 13 instrumental variables by the year 2033 (see Table 1), we are able to compute the projected ASFRi for the period 2004-2033. The medium projection for all 13 instrumental variables in the period 2004-2033
Table 3. Regression Coefficients Estimates for Simultaneous System of Fertility Behavior: Taiwan, 1951-2003
Variable 15-19 20-24 25-29 30-34 35-39 40-44 45-49
ASFR
Constant 4.140 -130.043 *** -199.133 *** -107.824 *** -49.597 *** -3.724 -3.861
MAR 3.198 *** 3.743 *** 2.347 *** 1.429 *** 0.571 *** 0.047 0.045
MASF 0.006 0.333 *** 0.845 *** 0.736 *** 0.933 *** 0.856 *** 0.841 ***
D1PNEA 0.051 0.244 *** 0.141 *** -0.029 -0.069 ** -0.006 -0.004
D2PNEA 0.087 *** 0.175 *** 0.019 -0.114 ** -0.061 *** -0.006 -0.003
Adj. R2 0.947 0.988 0.997 0.956 0.998 0.997 0.992
D.W. 0.859 0.498 1.233 0.453 1.178 1.615 1.305
A. C. 0.570 0.751 0.383 0.774 0.411 0.193 0.347
Constant 52.851 *** 93.835 *** 124.704 *** 109.016 *** 107.887 *** 110.413 *** 97.856 ***
HEDU -0.617 *** -1.377 *** -1.761 *** -1.292 *** -0.998 *** -0.966 *** -0.960 ***
FMA -1.210 *** -0.349 -1.424 *** -0.791 *** -0.962 *** -1.435 *** -1.217 ***
WLPR -0.325 *** -0.607 *** 0.089 0.271 *** 0.353 *** 0.542 *** 0.735 ***
Adj. R2 0.912 0.981 0.989 0.953 0.854 0.773 0.829
D.W. 0.337 0.120 0.401 0.233 0.142 0.195 0.180
A. C. 0.831 0.940 0.800 0.884 0.929 0.903 0.910
MASF
Constant 762.575 *** 1190.781 *** 363.458 *** -229.472 ** -268.997 *** -239.919 *** -104.876 ***
IDC -109.609 -81.729 188.529 *** 97.725 *** 12.267 -29.927 * 6.872
FPL 3.991 *** 3.519 *** -0.943 *** -1.131 *** -0.680 *** -0.491 *** -0.037
CCAR -7.620 *** 0.189 2.941 ** 4.175 *** 1.015 ***
WLPR -3.739 * -12.222 ***
IMR 5.077 * -3.918 * 0.125 4.817 *** 4.126 *** 1.877 *** 0.090
Y 0.100 -0.230 ** 0.103 ** 0.396 *** 0.220 *** 0.109 *** 0.046
Adj. R2 0.865 0.377 0.905 0.940 0.963 0.921 0.839
D.W. 0.236 0.741 0.745 0.403 0.277 0.133 0.098
A. C. 0.882 0.630 0.628 0.799 0.861 0.933 0.951
WLPR
Constant 17.827 *** -8.979 *** -8.873 *** -10.886 *** -16.307 *** -19.748 *** -19.896 ***
ENR -0.855 *** -0.584 ***
EGR 0.187 *** 0.060 0.256 *** 0.148 0.228 ** 0.162 0.057
PWC 1.055 *** 0.752 *** 0.487 *** 0.311 *** 0.160 ***
URB 0.808 *** 1.017 *** 0.373 *** 0.499 *** 0.711 *** 0.834 *** 0.838 ***
Adj. R2 0.966 0.942 0.981 0.969 0.966 0.963 0.963
D.W. 0.268 0.131 0.263 0.205 0.217 0.154 0.157
A. C. 0.866 0.935 0.868 0.898 0.892 0.923 0.921
MAR
Note:
* Significant at 10 percent level.
* * Significant at 5 percent level.
*** Significant at 1 percent level.
D1PNEA=D1 * PNEA where D1=1 (0 otherwise) if percent of labor force employment in non-agricultural sector in period 1951-69.
D2PNEA=D2 * PNEA where D2=1 (0 otherwise) if percent of labor force employment in non-agricultural sector in period 1970-83.
Knowledge-intensive period 1983-2003 for reference.
was projected on the basis of the extension of time trend for respective variables over the period 1951-2003. The high projection assumes that the government has made appropriate policy efforts to promote higher economic growth and to achieve the targets of other variables set for high projection. The low projection assumes that the government fails to make sufficient policy efforts as usual. It is worth noting that among the projected instrumental variables, economic growth rate plays a crucial role in determining the reversion of current Taiwan's lowest-low fertility in the future. Our projections for the economic growth rates up to 2033 slowly decline from 3.3% in 2003 to 1.8% in 2033, consistent with the range of growth rates in the majority of developed countries in the 2000s.
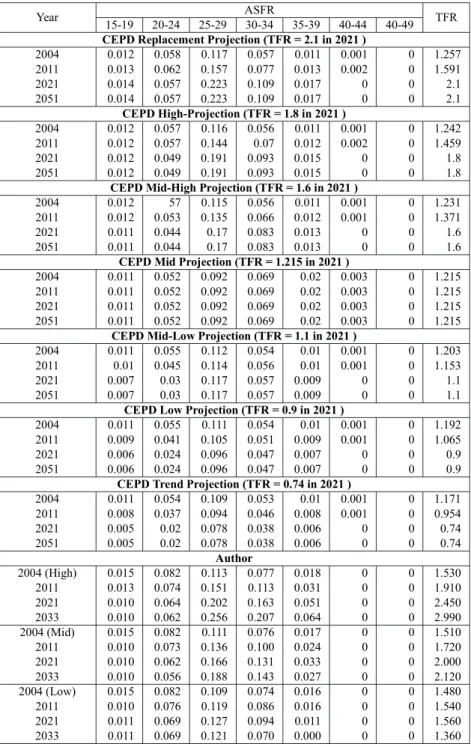
Figure 2 shows the distribution of high, medium, and low projections of ASFRi. The three levels of projection share a mostly similar pattern for the seven age groups ranging from 15-19 to 45-49. The age groups 40-44 and 45-49 have zero fertility. The three groups 20-24, 25-29, and 30-34 have the highest fertility, and the remaining two age groups, 15-19 and 35-39, are in between.
The three ASFRi projections, however, vary in fertility level and pattern of change. According to the high projection, the two high fertility groups (25-29 and 30-34) share a consistently increasing trend. The former will increase from 113.5 in 2004 to 256.1 in 2033, and thereafter from 77.4 in 2004 to 207.1 in 2033 (see Figure 2). The medium projection has a trend similar to that of the high projection for the two age groups, but at a moderate pace. The fertility for the age group 25-29 will increase from 111.5 in 2004 to 187.6 in 2033; and that for the age group 30-34, from 75.9 in 2004 to 142.7 in 2033. The low projection, however, has a different pattern of change. The fertility of the age group 25-29 will increase from 109.2 in 2004 to 126.9 in 2033. It then consistently declines to 120.8 in
!!!!!!
2033. Similarly, the fertility of the age group 30-34 will increase from 74.1 in 2004 to 94.3 in 2020 and then decline to 70.2 in 2033.
The fertility pattern for the age group 35-39 varies for the three projection levels. The high projection shows that there will be a steady increase from 18.3 in 2004 to 63.9 in 2033. The medium and low projections will have a slightly different pattern of change. The medium projection shows an increase in fertility from 17.4 in 2004 to 33.4 in 2024 and then a steady decrease to 27.5 in 2033. The low projection will experience a consistent decrease from 16.4 in 2004 to 0.0 beginning in 2028.
The pattern of fertility change for the age group 15-19 is similar for the three projections, but varies in pace. The high projection will have a decline in fertility from 15.3 in 2004 to 9.7 in 2022 and then a steady but small rebound to 9.8 in 2033. The age group's fertility for the medium projection will decline from 14.8 in 2004 to 9.8 in 2012 with a consistent rebound to 10.2 in 2033. The low projection will experience a decline from 14.5 in 2004 to 1.4 in 2009 and then also a consistent minor rebound to 10.9 in 2003.
When we sum up ASFRi, we find that our projected TFR are rather different from CEPD's TFR assumptions. Our low projection will have an increase of TFR from 1.48 in 2006 to 1.56 in 2021 and then a decline to 1.36 in 2033 (see Table 4). On the other hand, our medium and high projections will have a steady increase in TFR. TFR for our medium projections will increase from 1.51 in 2004 to 2.12 in 2033, while our high projection will have an increase of TFR from 1.53 in 2004 to 2.99 in 2033.
Table 4. ASFR Assumptions Made by CEPD
Year ASFR TFR
15-19 20-24 25-29 30-34 35-39 40-44 40-49 CEPD Replacement Projection (TFR = 2.1 in 2021 )
2004 0.012 0.058 0.117 0.057 0.011 0.001 0 1.257
2011 0.013 0.062 0.157 0.077 0.013 0.002 0 1.591
2021 0.014 0.057 0.223 0.109 0.017 0 0 2.1
2051 0.014 0.057 0.223 0.109 0.017 0 0 2.1
CEPD High-Projection (TFR = 1.8 in 2021 )
2004 0.012 0.057 0.116 0.056 0.011 0.001 0 1.242
2011 0.012 0.057 0.144 0.07 0.012 0.002 0 1.459
2021 0.012 0.049 0.191 0.093 0.015 0 0 1.8
2051 0.012 0.049 0.191 0.093 0.015 0 0 1.8
CEPD Mid-High Projection (TFR = 1.6 in 2021 )
2004 0.012 57 0.115 0.056 0.011 0.001 0 1.231
2011 0.012 0.053 0.135 0.066 0.012 0.001 0 1.371
2021 0.011 0.044 0.17 0.083 0.013 0 0 1.6
2051 0.011 0.044 0.17 0.083 0.013 0 0 1.6
CEPD Mid Projection (TFR = 1.215 in 2021 )
2004 0.011 0.052 0.092 0.069 0.02 0.003 0 1.215
2011 0.011 0.052 0.092 0.069 0.02 0.003 0 1.215
2021 0.011 0.052 0.092 0.069 0.02 0.003 0 1.215
2051 0.011 0.052 0.092 0.069 0.02 0.003 0 1.215
CEPD Mid-Low Projection (TFR = 1.1 in 2021 )
2004 0.011 0.055 0.112 0.054 0.01 0.001 0 1.203
2011 0.01 0.045 0.114 0.056 0.01 0.001 0 1.153
2021 0.007 0.03 0.117 0.057 0.009 0 0 1.1
2051 0.007 0.03 0.117 0.057 0.009 0 0 1.1
CEPD Low Projection (TFR = 0.9 in 2021 )
2004 0.011 0.055 0.111 0.054 0.01 0.001 0 1.192
2011 0.009 0.041 0.105 0.051 0.009 0.001 0 1.065
2021 0.006 0.024 0.096 0.047 0.007 0 0 0.9
2051 0.006 0.024 0.096 0.047 0.007 0 0 0.9
CEPD Trend Projection (TFR = 0.74 in 2021 )
2004 0.011 0.054 0.109 0.053 0.01 0.001 0 1.171
2011 0.008 0.037 0.094 0.046 0.008 0.001 0 0.954
2021 0.005 0.02 0.078 0.038 0.006 0 0 0.74
2051 0.005 0.02 0.078 0.038 0.006 0 0 0.74
Author
2004 (High) 0.015 0.082 0.113 0.077 0.018 0 0 1.530
2011 0.013 0.074 0.151 0.113 0.031 0 0 1.910
2021 0.010 0.064 0.202 0.163 0.051 0 0 2.450
2033 0.010 0.062 0.256 0.207 0.064 0 0 2.990
2004 (Mid) 0.015 0.082 0.111 0.076 0.017 0 0 1.510
2011 0.010 0.073 0.136 0.100 0.024 0 0 1.720
2021 0.010 0.062 0.166 0.131 0.033 0 0 2.000
2033 0.010 0.056 0.188 0.143 0.027 0 0 2.120
2004 (Low) 0.015 0.082 0.109 0.074 0.016 0 0 1.480
2011 0.010 0.076 0.119 0.086 0.016 0 0 1.540
2021 0.011 0.069 0.127 0.094 0.011 0 0 1.560
2033 0.011 0.069 0.121 0.070 0.000 0 0 1.360
Ⅳ. Population Projection
In this study, the registered population by sex and single age at mid- year 2003 is used as the base population. We also assume that there will be no immigration, emigration, war or natural disasters in the future. Numbers of children to be borne are estimated based on the three sets of estimated age-specific fertility rates described in the last section. The number of persons of each age for both sexes surviving to the next higher age a year later is estimated separately by applying survival ratios calculated from the three sets of assumed mortality rates. The corresponding male life expectancies are 76.4, 78.7, and 80.2 for high, medium, and low projections (see Table 1). The counterpart life expectancies for females are 83.0, 85.5, and 87.2.
The results of our projected population are presented in Appendices 1.1, 1.2, and 1.3. Trends of total population, number of birth, and dependency ratio are discussed in reference to CEPD's projection results as follows.
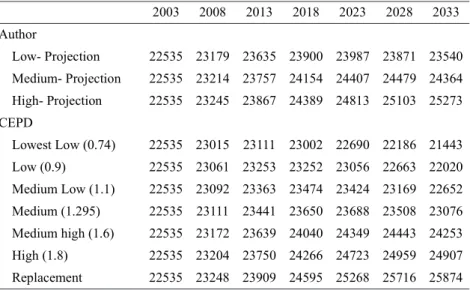
(1) The trend of total population
Our three projections have a rather different result of total population.
Our low projection shows that Taiwan's population will reach its peak in 2023 at about 24.0 million (see Table 5). It will gradually decline, thereafter. This result is in between CEPD's medium and medium-high projections. On the other hand, our medium projection has a slightly different result. It will have a peak total population around 24.5 million in 2028 and will decrease slightly by year 2033. This result is slightly greater than CEPD's medium-high projection. Finally, our high projection shares a
trend of steady increase in total population with CEPD's replacement projection in the period 2003 to 2033. By the year 2033, total population projected by our high assumptions is 25.3 million, which is 0.6 million less than CEPD's replacement estimate.
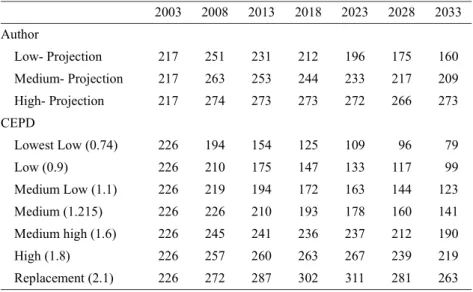
(2) Number of Births
Changes in numbers of birth are a concern for the government and demographers because they have a profound effect on population composition and labor supply. According to CEPD's lowest-low projection, Taiwan's number of births will experience a drastic steady decline from 226 thousand in 2003 to 79 thousand in the year 2033 (see Table 6). Its low to medium projection shares a steady decline trend, but at a more moderate
Table 5. Total Population for Taiwan, 2003 to 2033, Projected by CEPD and the Authors
Units: 1000 Persons 2003 2008 2013 2018 2023 2028 2033 Author
Low- Projection 22535 23179 23635 23900 23987 23871 23540 Medium- Projection 22535 23214 23757 24154 24407 24479 24364 High- Projection 22535 23245 23867 24389 24813 25103 25273 CEPD
Lowest Low (0.74) 22535 23015 23111 23002 22690 22186 21443 Low (0.9) 22535 23061 23253 23252 23056 22663 22020 Medium Low (1.1) 22535 23092 23363 23474 23424 23169 22652 Medium (1.295) 22535 23111 23441 23650 23688 23508 23076 Medium high (1.6) 22535 23172 23639 24040 24349 24443 24253 High (1.8) 22535 23204 23750 24266 24723 24959 24907 Replacement 22535 23248 23909 24595 25268 25716 25874 Source:
Council for Economic Planning and Development (CEPD), 2006.
Projections of Population of the Taiwan Area, Republic of China, 2006-2051. Taipei:
CEPD, Executive Yuan.
pace. The medium-high projection shows a rebound to 245 thousand in 2008 and thereafter a steady decline to 190 thousand in 2033. Its high and replacement projections show an increase of births until the year 2023.
Our low and medium projections show a trend of steady decline in number of births in the projection period. Our low projection includes 160 thousand births in the year 2033, which is slightly smaller than CEPD's medium-high projection. Meanwhile, the projected number of births for our medium projection is 209 thousand in the year 2033, which is between CEPD's medium-high and high projections. On the other hand, our high projection shows an increase of births from 217 thousand in the year 2003 to 288 thousand in 2008. It fluctuates slightly thereafter. By the year 2033, it will have 273 thousand births, which is 10 thousand greater than CEPD's
Table 6. Number of Taiwan Births 2003-2033, Projected by CEPD and Authors
Units: 1000 Persons 2003 2008 2013 2018 2023 2028 2033 Author
Low- Projection 217 251 231 212 196 175 160 Medium- Projection 217 263 253 244 233 217 209 High- Projection 217 274 273 273 272 266 273 CEPD
Lowest Low (0.74) 226 194 154 125 109 96 79
Low (0.9) 226 210 175 147 133 117 99
Medium Low (1.1) 226 219 194 172 163 144 123
Medium (1.215) 226 226 210 193 178 160 141
Medium high (1.6) 226 245 241 236 237 212 190
High (1.8) 226 257 260 263 267 239 219
Replacement (2.1) 226 272 287 302 311 281 263 Source:
Council for Economic Planning and Development (CEPD), 2006.
Projections of Population of the Taiwan Area, Republic of China, 2006-2051. Taipei:
CEPD, Executive Yuan.
replacement projection.
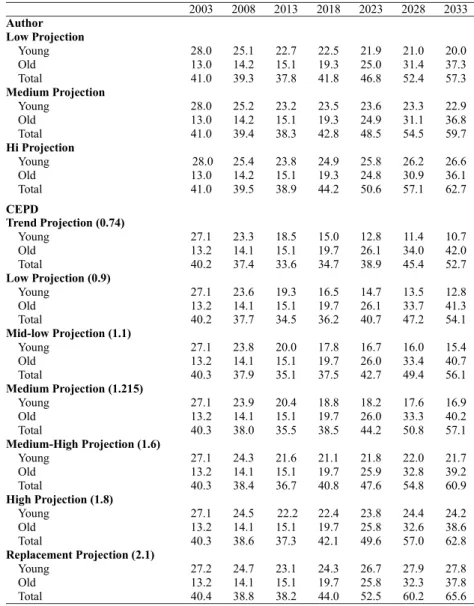
(3) Dependency Ratio
Finally, dependency ratio is used to summarize the differences between the two types of projections in age composition. Table 7 shows that our low and medium projections share a similar pattern of change in dependency ratios with CEPD's projections, with the exception of replacement projection. Young dependency ratio will consistently decline, but old dependency will increase continuously. They, however, differ slightly in size. Young dependency ratios for our low and medium projections will be 18.4 and 22.0 in the year 2033 respectively. Both of them are slightly greater than CEPD's medium-high projection. On the other hand, old dependency ratios for our low and medium projections are 39.3 and 38.5 in the year 2033 respectively. They are slightly less than CEPD's replacement (37.8) projection, and much less than CEPD's high projection (38.6) and medium-high projection (39.2). Obviously, differential dependency ratios reflect different fertility and mortality assumptions.
The change of young dependency ratio for our high projection and CEPD's replacement projection is somewhat different from other projections. They show a decline in young dependency ratio until the year 2013 and a rebound beginning in the year 2018. By 2033, our high projection will have a young dependency ratio of 26.2, which is slightly smaller than CEPD's replacement projection (27.8).
The above discussion on projections of total population, numbers of births, and dependency ratio points out that our low and medium projections are close to CEPD's medium-high projection, but our high projection is close to their replacement projection. As our projections are based on an
Table 7. Dependency Ratios of Taiwan 2003-2033 Projected by the Authors and the Council for Economic Planning and Development (CEPD)
2003 2008 2013 2018 2023 2028 2033 Author
Low Projection
Young 28.0 25.1 22.7 22.5 21.9 21.0 20.0
Old 13.0 14.2 15.1 19.3 25.0 31.4 37.3
Total 41.0 39.3 37.8 41.8 46.8 52.4 57.3
Medium Projection
Young 28.0 25.2 23.2 23.5 23.6 23.3 22.9
Old 13.0 14.2 15.1 19.3 24.9 31.1 36.8
Total 41.0 39.4 38.3 42.8 48.5 54.5 59.7
Hi Projection
Young 28.0 25.4 23.8 24.9 25.8 26.2 26.6
Old 13.0 14.2 15.1 19.3 24.8 30.9 36.1
Total 41.0 39.5 38.9 44.2 50.6 57.1 62.7
CEPD
Trend Projection (0.74)
Young 27.1 23.3 18.5 15.0 12.8 11.4 10.7
Old 13.2 14.1 15.1 19.7 26.1 34.0 42.0
Total 40.2 37.4 33.6 34.7 38.9 45.4 52.7
Low Projection (0.9)
Young 27.1 23.6 19.3 16.5 14.7 13.5 12.8
Old 13.2 14.1 15.1 19.7 26.1 33.7 41.3
Total 40.2 37.7 34.5 36.2 40.7 47.2 54.1
Mid-low Projection (1.1)
Young 27.1 23.8 20.0 17.8 16.7 16.0 15.4
Old 13.2 14.1 15.1 19.7 26.0 33.4 40.7
Total 40.3 37.9 35.1 37.5 42.7 49.4 56.1
Medium Projection (1.215)
Young 27.1 23.9 20.4 18.8 18.2 17.6 16.9
Old 13.2 14.1 15.1 19.7 26.0 33.3 40.2
Total 40.3 38.0 35.5 38.5 44.2 50.8 57.1
Medium-High Projection (1.6)
Young 27.1 24.3 21.6 21.1 21.8 22.0 21.7
Old 13.2 14.1 15.1 19.7 25.9 32.8 39.2
Total 40.3 38.4 36.7 40.8 47.6 54.8 60.9
High Projection (1.8)
Young 27.1 24.5 22.2 22.4 23.8 24.4 24.2
Old 13.2 14.1 15.1 19.7 25.8 32.6 38.6
Total 40.3 38.6 37.3 42.1 49.6 57.0 62.8
Replacement Projection (2.1)
Young 27.2 24.7 23.1 24.3 26.7 27.9 27.8
Old 13.2 14.1 15.1 19.7 25.8 32.3 37.8
Total 40.4 38.8 38.2 44.0 52.5 60.2 65.6
Source:
Council for Economic Planning and Development (CEPD), 2006.
Projections of Population of the Taiwan Area, Republic of China, 2006-2051. Taipei:
CEPD, Executive Yuan.
Note:
1. Young - Persons under 15 per 100 persons to persons 15-64 years of age.
2. Old - Persons 65 and over per 100 persons to persons 15-65 years of age.
3. Total - Persons under 15 and 65 and over per 100 persons to persons 15-66 years of age.
estimation of ASFR adjusted by social development, we thus come to the following suggestions. If Taiwan's social development is maintained at a high level in the next 30 years, our lowest-low fertility will probably be reversed to a level approaching replacement. Even if our social development remains at a low or medium level, our fertility will probably rebound to 1.6 births per woman.
Ⅴ. Summary and Discussion
Classic population theory suggests that social economic changes plays a major role in bringing fertility down to the replacement level and assumes that population growth in the long run will be near zero, implying that fertility will on average be close to the replacement level of about 2.1 (Demeny 1997; Caldwell 1982). As the fertility of many societies has dropped below the replacement level, we thus are inclined to believe that social economic factors will continue to have an effect on fertility changes in the post-replacement era. Simultaneous equations are thus used to integrate the effect of social economic factors on ASFR. The thus estimated ASFR is then used to make population projections. The results of our low and medium projections are close to CEPD's medium-high projection, but our high projection is approaching CEPD's replacement level. In other words, if we assume that social development is the underlying mechanism for population changes, different levels of social development bring about differential population changes. If Taiwan's socio-economic development grows at a high rate, its fertility would rebound to the replacement level by 2033. If it follows the medium rate, fertility would rise to 1.6 births per woman. Only if Taiwan's future socio-economic development grows as sluggishly as in the assumed low case would its fertility remain at the
lowest-low level.
In the past, higher family benefits are recommended as a useful approach to raise lowest-low fertility. France and Germany are widely cited as evidence of the impact of policy on fertility. Higher family benefits provided in France have resulted in a fertility level higher than Belgium by about 0.2 children per woman (Gauthier 2001). It has also been argued that the higher fertility observed in East Germany was a series of family policy measures introduced in 1976-77, including an extended maternity leave and a paid childcare leave (Buttner and Lutz 1990).
Yet providing incentives to have children in wedlock is costly and is not affordable for most developing countries. In this study, we find that maintaining current social economic development is also able to reverse lowest-low fertility to near replacement level. This implies that maintaining social economic development is another way for developing societies to solve the lowest-low fertility issue.
Appendex Table 1.1 Population Projections by Sex and Age for Taiwan, 2003-2033
High- Projection Units: 1000 Persons
2003 2008 2013 2018 2023 2028 2033
Both Sexes
0~4 1,326 1,485 1,670 1,790 1,879 1,953 2,058
5~9 1,587 1,324 1,483 1,668 1,789 1,877 1,952
10~14 1,614 1,585 1,322 1,481 1,666 1,787 1,875
15~19 1,658 1,610 1,580 1,318 1,477 1,662 1,783
20~24 1,985 1,651 1,603 1,574 1,313 1,472 1,657
25~29 1,873 1,975 1,643 1,596 1,567 1,308 1,467
30~34 1,829 1,862 1,965 1,635 1,588 1,560 1,302
35~39 1,898 1,815 1,849 1,951 1,624 1,578 1,551
40~44 1,903 1,877 1,796 1,830 1,932 1,609 1,564
45~49 1,720 1,873 1,848 1,769 1,803 1,906 1,589
50~54 1,406 1,680 1,831 1,808 1,733 1,769 1,872
55~59 841 1,358 1,625 1,773 1,753 1,684 1,723
60~64 802 798 1,291 1,548 1,692 1,680 1,619
65~69 668 739 738 1,197 1,440 1,584 1,580
70~74 589 583 648 650 1,060 1,290 1,429
75~79 430 464 464 520 525 873 1,074
80~84 231 283 309 313 354 371 627
85+ 132 233 305 359 396 216 243
Total 22,494 23,197 23,971 24,780 25,590 26,179 26,965
Appendex Table 1.1 Population Projections by Sex and Age for Taiwan, 2003-2033
High- Projection Units: 1000 Persons
2003 2008 2013 2018 2023 2028 2033
Male
0~4 692 761 855 917 962 998 1,045
5~9 826 691 759 854 916 961 998
10~14 843 824 690 758 853 915 960
15~19 856 840 821 687 756 850 912
20~24 1,016 850 835 816 684 752 846
25~29 952 1,009 845 829 812 680 748
30~34 926 945 1,001 838 823 806 675
35~39 963 916 935 991 830 816 799
40~44 963 948 902 921 977 819 806
45~49 866 942 928 884 903 959 805
50~54 704 839 913 901 859 879 936
55~59 417 674 803 876 866 828 850
60~64 390 391 632 756 828 821 789
65~69 321 353 355 578 695 765 765
70~74 314 274 303 308 505 613 684
75~79 237 241 213 238 245 409 506
80~84 118 151 156 140 161 170 294
85+ 60 108 146 160 152 185 209
Total 11,464 11,755 12,093 12,453 12,825 13,227 13,627