Number 6/07, July 2007
China Economic Issues
Price convergence between dual-listed A and H shares
Wensheng Peng, Hui Miao and Nathan Chow
Dual-listed A and H shares now account for 10 % of the Mainland (tradable) and Hong Kong stock market capitalisation. Large and persistent price differentials between A and H share prices have been observed, raising concerns about market segmentation within China and its implication for the efficiency of price discovery. This paper considers the issue of price convergence or divergence from a somewhat different angle. We examine the impact of price gaps on the dynamics of the corresponding A and H share prices and the wider stock markets, using a panel dataset of daily closing prices of A and H shares of 39 dual-listed companies for the period from July 2005 to June 2007.
The empirical analysis indicates that the price differentials were stationary around an average A share premium of 77%, from which a divergence would dissipate by one half in about 40 trading days. This suggests relative price convergence but not absolute price convergence (i.e. price equalizaion). The A share premium tended to reduce the corresponding A share price but raise the H share price, other things being equal. However, the relationship is found to be a nonlinear one: beyond a threshold of 100%, a larger price gap would have a diminishing dampening effect on A share prices but an increasing pulling-up effect on H share prices. This lends support to a reported trading strategy that pushes up A share price with a view to raising the A-H price gap and in turn the H share price (and profit from earlier acquired H share positions). It is noted that the large price gaps are mostly associated with shares of small market capitalisation, with which such trading strategy is more likely to succeed, owing to the small supply of such A shares and information asymmetry that disadvantages international investors.
The evidence of relative price convergence suggests some degree of arbitrage on the price gaps, and points to illicit cross-border capital flows given the restrictions on the formal channels. However, such arbitrage is partial and incomplete, and the market segmentation may induce speculative activities that exacerbate market volatility. Both concerns are likely to increase as the number of dual-listed companies rises over time. Thus, it is important to increase the linkages between the two markets by improving investor access. This would enhance the price convergence process and promote the healthy development of the financial market of the whole country.
I. Introduction
Dual-listed Mainland China shares now account for about 10% of tradable Mainland stock market capitalisation and 11% of Hong Kong stock market capitalisation. As more Mainland China companies choose to adopt the dual-listing model, this type of stocks is likely to command an increasing share of the markets. One somewhat disconcerting feature is large persistent price differentials observed. As of early June 2007, for dual-listed companies, A shares enjoyed a premium over their H share counterparts ranging from 10% to 260%, with a market capitalisation-weighted average of over 50%.
Such large price gaps for the two types of shares that enjoy the same voting rights and dividend payments highlight the segmentation of the two capital markets within China, and raise questions about the efficiency of price discovery and resource allocation in these markets. Calls have been made in both Hong Kong and the Mainland for measures to strengthen the linkages between the two markets, with a view to reducing the price gaps and developing an integrated financial market to help sustain the rapid economic growth in China (Yam, 2007a&b, and Fan 2007).
There are research efforts in understanding factors contributing to the price gaps (Chan and Kwok, 2005). Restrictions on foreign investor access to A shares and Mainland investor access to H shares, coupled with the relatively small supply of A shares, are often found to be the main reasons explaining the price differentials. Almost all dual-listed Mainland companies have issued many more H-shares than A shares, and Mainland investors by and large have no access to H shares. The resulting differential demand and the scarcity of those stocks lead to the A-share premium.
Instead of investigating the causes, this paper studies the issue from a new
perspective by considering the impact of the price gaps on A and H share price dynamics.
With the dual-listed companies accounting for an increasing market share, it is important to understand and monitor the interactions between A and H share prices and their potential impact on the wider Mainland and Hong Kong stock markets.
Are there signs of price convergence between A and H shares due to arbitrage activities through formal and informal channels? Do price premiums of A shares over H shares act as a constraining force on increase of A share prices and likewise a pulling force on H share prices? Or as some have argued, the segmentation of the markets has been exploited by some traders with an effect of exacerbating market volatility? This paper attempts to shed light on these questions by studying the price dynamics of 39 dual-listed companies using the panel data regression technique.
The rest of the paper is organised as follows.
Section II provides some stylised facts on price movements of the dual-listed stocks and articulates various hypotheses on the dynamic relationship between the A and H shares of dual-listed companies. Section III presents the econometric models used to investigate the impact of price gaps on stock price dynamics and provides the empirical results. Section IV concludes with remarks on policy implications.
II. Stylised facts and competing hypotheses
Data and stylised facts
As of early June 2007, there were 44 A and H dual-listed stocks, and our study covers 39 of these companies.1 The data used in this study was obtained from Bloomberg.
The sample consists of daily observations on closing prices of the 39 dual-listed firms from 22 July, 2005 to 8 June, 2007, with total panel data observations of 13,837.
The panel dataset is imbalanced as dates of
the initial public offering (IPO) of these companies were different. The selection of July 2005 as the starting point of the sample period is based on the following considerations. The reform of the renminbi exchange rate regime on 21 July 2005 and the share desegregation reform initiated in mid-2005, are considered to be major structural changes affecting investor confidence and the development of the Mainland stock market.2 Furthermore, some large financial firms have been listed only since 2005, and the imbalance of the panel would be a greater concern if the starting point was selected to be a much earlier date. For comparison purpose, A share prices were converted in Hong Kong dollar terms using the spot exchange rate between the renminbi and the Hong Kong dollar.
The dual-listed companies are from diverse
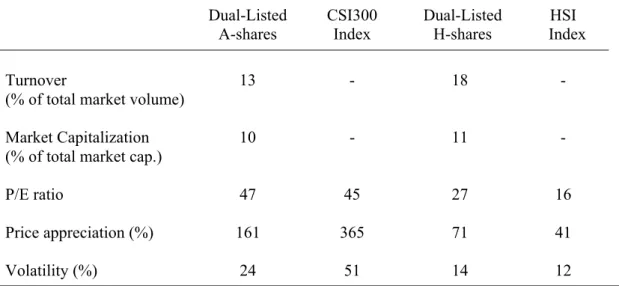
industry sectors, and there is a wide cross-sectional variation in the A-share price premium as shown in Appendix 1. Table 1 presents some stylised facts about the 39 dual-listed stocks. These stocks represent a significant proportion of trading activities in both Mainland and Hong Kong markets.
During the sample period, the dual-listed stocks accounted for 13% and 18%
respectively of the Mainland and Hong Kong stock market turnover. On a weighted-average basis (using market capitalisations as weights), the A-share prices of dual-listed companies rose by 161% during the sample period, compared to 71% for relevant H-shares. Reflecting this, dual-listed A-shares are valued much higher than their H-share counterparts with a weighted average P/E of 47 compared to 27. In the meantime, A-share prices were almost twice more volatile than the corresponding H-share prices.3
________________________
1 H shares of two companies have been suspended for trading since June 2005 and October 2006, and as a result, the A and H share price differentials are now exceedingly large. Three other companies had their A share IPOs only in May 2007. Including these stocks in the empirical study would distort the results.
2 In particular, the share redesignation reform cleared investors’ concern about the overhang of the large number of nontradable shares held by the government. The reform also helps to align the interests of majority and minority share holders, and thus alleviates concerns on corporate governance.
3 Hui and Peng (2007) argue that factors including the structure of the investor base, sectoral concentration of the listed companies and trading mechanism explain the relatively high volatility in A share prices.
Table 1 Performance of dual-listed stocks relative to market index
(Weighted by market capitalization) Dual-Listed
A-shares CSI300
Index Dual-Listed
H-shares HSI Index
Turnover -
(% of total market volume)
13 18 -
Market Capitalization -
(% of total market cap.)
10 11 -
P/E ratio 47 45 27 16
Price appreciation (%) 161 365 71 41
Volatility (%) 24 51 14 12
Note: P/E, price appreciation and volatility are calculated on a weighted average basis, using market capitalisation of individual companies as weight.
Source: Bloomberg and staff estimate, sample period from July 22, 2005 to June 8, 2007
A-shares of dual-listed comapnies on average underperformed the overall A share market but was also less volatile (as compared with the CSI 300 index). In contrast, H-shares of dual-listed companies on average outperformed the Hang Seng index and were more volatile. Specifically, almost all dual-listed H-shares outperformed the Hang Seng Index in terms of price
increase, while about 75% of the dual-listed A-shares underperformed the CSI300 index.
Therefore, these dual-listed stocks are somewhat “special” when measured against the peers in their respective home markets.
A natural question is how price movements of dual-listed A and H shares may interact with each other.
Chart 1 Relative performance of dual-listed stocks against market indice
(Annualized return, sample period: 7/2005 - 5/2007) Dual-listed A-shares over CSI300 index
-200 -100 0 100 200 300 400 500 600 700 800
Beijing North Star Co. Ltd
Guangzhou Shipyard International Co. Ltd
CITIC Bank
Datang International Power Generation Co. Ltd ppt
40
Dual-listed H-shares over HSI
-200 0 200 400 600 800 1000 1200
Guangzhou Shipyard International Co. Ltd
Jiaoda Kunji High-Tech Co. Ltd ppt
40
Source: Bloomberg and staff estimate
Arbitrage and price convergence hypothesis A and H shares of dual-listed companies are of the same voting rights and dividend payments. However, foreigners can not legally purchase A-shares outside the qualified foreign institutional investor (QFII) schemes, and formal channels of overseas portfolio investment by domestic residents are restricted to qualified domestic institutional investor (QDII) schemes. This type of ownership restriction is common in emerging markets, and generally leads to market segmentation and price differentials.
Until the recent liberalisation of the scope of QDII investment, private portfolio investment flows through the formal channels between the Mainland and Hong Kong were quite limited. However, there are other channels through which A and H share prices can be related, and interactions may limit the size of the price gaps. There are reports of Mainland and Hong Kong investors shifting funds through informal channels to trade H and A shares. The size of such trading is difficult to gauge, and A and H shares of dual-listed companies are not fungible, thus any arbitrage involved is partial and incomplete. Nevertheless, such activities should help limit the price differentials at the margin. Furthermore, for long-term value investors on the Mainland, the H-share valuation, which is determined in an open international market, would serve as an important benchmark and influence their investment decisions.
These arguments support a general convergence hypothesis under which price gaps between A and H shares induce trading activities that buy relatively low-valued shares and sell high-valued shares of the same company, leading to a long-run trend of price convergence.
Differential demand, information asymmetry and price divergence hypothesis
An alternative hypothesis stresses the differential demand for A and H shares due to capital account controls, and a divergence A and H share prices. Under this hypothesis, a given price gap would not have significant impact on the dynamics of the A and H share prices of dual-listed companies. Furthermore, there are reports that the segmentation of the two markets and differential demand have been exploited by some for hedging and speculative trading, which work against the force of arbitrage activities.
First, as stock index future trading is not allowed on the Mainland, the H-share index can be used as a proxy for hedging.
Specifically, investors who have access to both markets can buy A shares and sell the H-shares index futures at the same time to hedge against the downside risk. Other things being equal, this would raise the price differentials. The key to the success of this strategy is strong correlation between high frequency changes of A share and H share prices of dual-listed companies.
Another trading strategy that could cause price divergence takes advantage of the difference in price elasticity of Mainland and international investors. The demand by Mainland investors is less price elastic than the international investor demand, partly because of the scarcity of A shares.
The reported trading strategy is to acquire H shares of a dual-listed company first (with limited impact on prices owing to the market depth), and use a relatively small order to push up A-share prices (as A share market is shallower). It is hoped that the increase of A share prices and the resulting wider price gap over corresponding H shares would induce buying interest from international investors in the respective H shares. The trading profits arise mainly from the H-share position, but A share prices probably need to rise by much more
than corresponding H share prices in order to achieve the pulling effect.
Information asymmetry between local and overseas investors might also play a role.
For large companies, there are much research and analysis of their business prospects and valuation, and international investors are unlikely to be disadvantaged.
However, it is argued that domestic investors are better informed about the business prospects of the relatively small dual-listed Mainland companies. In this case, movements of A-share prices would lead those of corresponding H-share prices, with persistent price gaps as information asymmetry is resolved slowly. This argument of information asymmetry suggests that the above-noted speculation trading strategy has a higher chance of success in the case of shares of relatively small capitalisations. This is because for the small companies, the signalling effect of A share price movements to H share price is stronger as foreign investors have limited independent information.
Both the convergence and divergence hypotheses suggest that under the current restrictions on capital account transactions, the large price differentials between A and H shares would induce cross-border fund flows through informal channels. While some of these trading activities are for arbitrage purposes, the persistently large price gaps in recent periods raise questions about the significance of this force. Some participants take advantage of the segmentation of the A and H share markets and adopt trading strategies that may exacerbate volatility in both markets. This would not facilitate healthy development of the capital market of China as a whole. It is thus useful to assess the significance of these competing hypotheses in practice, and this is the task of the next section.
III. Empirical Analysis
Two types of empirical tests are conducted.
One is to test for unit roots in A and H share price differentials. The non-existence of a unit root suggests that the price differentials are stationary, and that A and H share prices have a trend of convergence. The estimated coefficient would have implications on the speed of convergence.
A regression is also run to test whether A and H share price gaps have significant impact on price changes of A and H shares respectively, after controlling for changes in the overall market conditions.
Panel unit root test
As the univariate unit-root test often fails to reject the null of a unit root when it is in fact false, due to its low power, one way that researchers have confronted this problem is to exploit the cross sectional dimension of data. Panel data can dramatically increase the power of the unit-root test, and in contrast to the univariate case, the test statistic in a panel context is asymptotically normal. In this study, the following equation is estimated on panel data of price gaps of the A and H shares of 39 dual-listed companies.
(1)
Where qi,t , is the logarithm of the A-H share price differential for dual-listed stock i at time t , and Δ is the first difference operator. The length of lags N, used to account for possible serial correlation in the error term as in a univariate augmented Dickey-Fuller test, can be determined by Campbell and Perron (1991)’s top-down t-test approach, which involves initially specifying a sufficiently long length of lags to the extent permitted by data and then sequentially eliminating the lags that are not significant. Central to the test of convergence is the estimated value of β. If
t i N
n
n t i n t
i i t
i q q
q ,
1
, 1
,
, =α +β + ϕ Δ +ε
Δ
∑
= −
−
β ≥ 0, the price gap qi,t is non-stationary, implying persistent or explosive price divergence. A negative value of β suggests price convergence, and its magnitude indicates the speed of convergence.
Specifically, the half-life of a shock to the price differential is computed as –ln(2)/ln(1+ β). The estimated value of αi can be used to test the hypothesis of long-run price equalization. A value of αi not significantly different from zero suggests that the price gap has a zero mean and A and H share prices of dual-listed stock i will eventually be equalised. On the other hand, a value of αi being significantly positive suggests that the A share price of dual-listed stock i will be persistently higher than its corresponding H share price. Thus, the case of β < 0 and α = 0 can be called absolute price convergence (i.e. long-term price equalisation), while the case of β < 0 and α > 0 can be termed relative price convergence (where price differentials will not diverge persistently from a certain level α ).
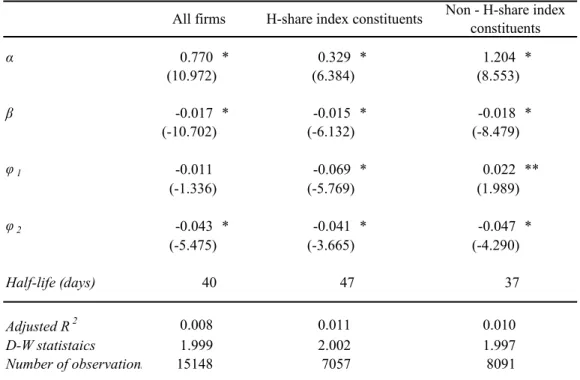
Using the critical values established by Levin and Lin (1992), the null hypothesis of a unit root for price differentials (β=0) is rejected (Table 2). The estimate of α is positive and significantly different from zero, however. This suggests that price differentials are stationary around a non-zero mean. In other words, a shock that raises the price differential will gradually die out and A and H share prices converge to a long-term average gap. The estimate of β suggests that a divergence from the long-term average price gap would
dissipate by one half in about 40 trading days.
Unit root test is also conducted by dividing the sample into H share index constituent stocks and non-constituent stocks. The index constituent stocks are generally of relatively large capitalisation and their price dynamics may be different from that of stocks of small capitalization. The large-cap stocks are generally less subject to information asymmetry issue noted above, and the long-term valuations of H and A shares are likely to be closer to each other than in the case of small-cap stocks. Two observations are made. First, the estimate of α is much smaller for the index component stocks than for non-component stocks, consistent with the observation that the A and H share price gaps of large-cap stocks are generally smaller than those of small-cap stocks. Specifically, the average price gap for the index constituent stocks is estimated to be 33%, while that for the non-constituent stocks is 120%.
Second, the estimate of β suggests that the speed of convergence following a shock to the long-term average is faster in the case of non-index constituent stocks than the constituent stocks. Specifically, half of the impact of a shock to the price gap will die out in 37 trading days for the non-index component stocks, and in 47 trading days for the component stocks. This may reflect the fact that small-cap stocks generally have larger price gaps which tend to induce stronger force of arbitrage activities.
Table 2 Price gap and rate of relative price convergence
(Sample period 25/07/2005 - 08/06/2007)
α 0.770 * 0.329 * 1.204 *
(10.972) (6.384) (8.553)
β -0.017 * -0.015 * -0.018 *
(-10.702) (-6.132) (-8.479)
φ1 -0.011 -0.069 * 0.022 **
(-1.336) (-5.769) (1.989)
φ2 -0.043 * -0.041 * -0.047 *
(-5.475) (-3.665) (-4.290)
Half-life (days) 40 47 37
Adjusted R2 0.008 0.011 0.010
D-W statistaics 1.999 2.002 1.997
Number of observations 15148 7057 8091
H-share index constituents Non - H-share index constituents All firms
Note: t-values are in ( ), ** and * indicate that coefficients are significant at the 5% and 1% levels respectively.
Source: staff estimate
Impact of price gaps on A and H share price dynamics
To examine how a given price differential may affect price dynamics of A and H shares respectively, the following regression model is employed.
(2) Where pi,t is the logarithm of daily closing price of dual-listed A-share (or H-share) at time t. qi,tis the daily A and H share price differential of stock i at time t as defined above. The lagged qi,t−1 is included to examine the impact of the price gap yesterday on A and H share price movements today. Under the convergence hypothesis, the estimate of β should be negative for A share price and positive for H share price, as the A share premium would act as a constraining force on A share price
and pulling force on H share prices so that the price gap would be stationary. A and H share price changes are affected by the overall market developments as well. To control for this, the daily percentage changes of CSI300 index and Hang Seng index are included in the A share and H share equations respectively (computed as log differences of the index and denoted as Indexj,t). αi,k is the individual effect and εt
is the disturbance term.
The panel data regression is employed.
Besides increasing the degree of freedom, the panel data technique reduces potential collinearity between the explanatory variables and improves efficiency of estimation. The estimation is based on the two-factor fixed effects model with both individual and time-specific effects.
Individual effects take into account the specificity of individual firms reflected in its
t i t t
i i
t
i q index
p, =
α
+β
, 1+γ
+ε
,Δ −
price premium, while time effects consider the overall market effect on all stocks.
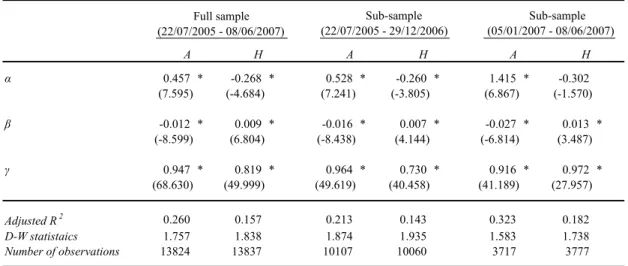
Equation (2) is first estimated for the whole sample from July 2005 to June 2007. The estimated β for A- and H-shares are of the expected signs and statistically significant,
consistent with the general arbitrage hypothesis (Table 3). That is, the A-share price premium tends to reduce A-share price, but raise the corresponding H-share price, after controlling for the effect of the overall market conditions.
Table 3 Price gap and A- and H-share price dynamics (linear model)
Full sample (22/07/2005 - 08/06/2007)
A H A H A H
α 0.457 * -0.268 * 0.528 * -0.260 * 1.415 * -0.302
(7.595) (-4.684) (7.241) (-3.805) (6.867) (-1.570)
β -0.012 * 0.009 * -0.016 * 0.007 * -0.027 * 0.013 *
(-8.599) (6.804) (-8.438) (4.144) (-6.814) (3.487)
γ 0.947 * 0.819 * 0.964 * 0.730 * 0.916 * 0.972 *
(68.630) (49.999) (49.619) (40.458) (41.189) (27.957)
Adjusted R2 0.260 0.157 0.213 0.143 0.323 0.182
D-W statistaics 1.757 1.838 1.874 1.935 1.583 1.738
Number of observations 13824 13837 10107 10060 3717 3777
Sub-sample (05/01/2007 - 08/06/2007) Sub-sample
(22/07/2005 - 29/12/2006)
Note: t-values are in ( ), * indicates that coefficients are significant at 1% level.
Source: staff estimate
It is observed that the price gaps increased sharply in the first half of 2007, reflecting the rally in the A share market. To examine whether there is a notable change in the relationship, the sample period is split into two: one is from 22 July 2005 to the end of 2006, and the other is from the beginning of 2007 to 8 June 2007. The results presented in the last two columns of Table 3 suggest that the pushing down and pulling up effects on A and H share prices respectively of a given price gap increased in the first half of 2007 as the price gaps rose to a high level. Taking the estimates literally, a price gap of 10% today would reduce A share price by 0.16% the next trading day during the period up to the end of 2006, but by 0.27% in the first half of 2007. Likewise, the same size of the price gap would increase the H share price by 0.07% in the first part of the sample period, and by 0.13% in the first half of 2007.
This suggests that there is probably a nonlinear effect whereby a larger price gap would induce more arbitrage activities through either formal or informal channels.
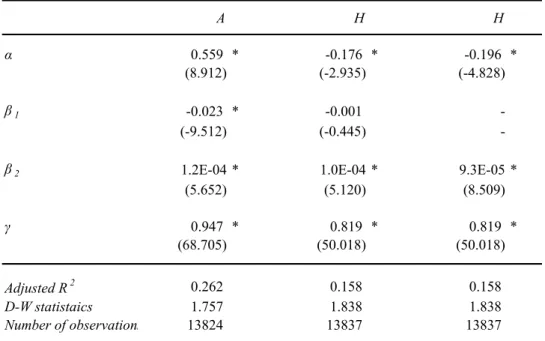
To capture the possible nonlinear effect, a term of the squared price gap is added in the regression:
(3) For the equation of A share price, the size of the estimated coefficient on the squared price gap is small but statistically significant (Table 4). This suggests that an A share price premium would reduce the A share price at an increasing rate as the premium itself increases up to a threshold. This is consistent with the convergence hypothesis, and suggests that a larger price gap would induce greater arbitrage activities.
However, beyond the threshold, the impact
t i t t
i t
i i t
i q q index
p, =α + β1 , 1+β2 , 12 +γ +ε,
Δ − −
would start to decline. Based on the estimates of β1 and β2 , Chart 2 plots the predicted nonlinear relationship between A share price premium and A share price growth rate. The threshold of the price gap that represents the turning point in the nonlinear relationship is estimated at just
above 100%.4 Take the estimate literally, the first 20% price gap would reduce A share price by 0.4% in the next trading day, compared with 1.17% in the case of 100%
price gap, and 0.03% in the case of 200%
price gap.
Table 4 Price gap and A- and H-share price dynamics (nonlinear model)
(Sample period 22/07/2005 - 08/06/2007)
A H H
α 0.559 * -0.176 * -0.196 *
(8.912) (-2.935) (-4.828)
β1 -0.023 * -0.001 -
(-9.512) (-0.445) -
β2 1.2E-04 * 1.0E-04 * 9.3E-05 *
(5.652) (5.120) (8.509)
γ 0.947 * 0.819 * 0.819 *
(68.705) (50.018) (50.018)
Adjusted R2 0.262 0.158 0.158
D-W statistaics 1.757 1.838 1.838
Number of observations 13824 13837 13837
Note: t-values are in ( ), * indicates that coefficients are significant at 1% level.
Source: staff estimate
_________________________
4 The slope of qi,t−1 equation (3) can be obtained by taking the first derivative of Δpi,t with respect to qi,t−1
(
1 ,
,
∂ −
Δ
∂
t i
t i
q
p = β1+2β2qi,t−1). The turning point is the level of qi,t−1 that gives rise
toβ1+2β2qi,t−1=0.
Chart 2 – Estimated nonlinear effect of A share premium on A share price growth rate
-1.4 -1.2 -1.0 -0.8 -0.6 -0.4 -0.2 0.0 0.2
0 20 40 60 80 100 120 140 160 180 200
-1.4 -1.2 -1.0 -0.8 -0.6 -0.4 -0.2 0.0 0.2
A over H premium A-share price
growth rate
A-share price growth rate
Increasing pace of convergence
Decreasing pace of convergence
How to explain the puzzle of the nonlinear relationship? An examination of the data show that of the 39 stocks in the sample, 13 had a price gap exceeding 100% as of early May 2007, and only three of these were H-share index constituents. Our interpretation is that these mostly small cap stocks are more subject to speculative and other forces that work against the arbitrage force. As noted earlier, one possibility is the trading strategy which aims at driving up the A share price to enlarge the A and H share price gap with a view to inducing a rise in H share price and benefiting from the earlier acquired H share position. This pushing-up effect on the A share price tends to offset the normal arbitrage that may be induced by the enlarged price gap. The relatively small supply of A shares for the small cap companies makes it easier for speculators to move A share prices. In addition, as the small cap companies are more subject to information asymmetry with the local investors enjoying an advantage, the signalling effect of the run-up in A share prices to H shares is stronger than in the case of large-cap companies.
For the equation on H share price growth rate, the lagged price gap becomes insignificant after adding the squared price gap. The equation is re-estimated after
dropping the insignificant variable and the results are presented in the last column of Table 4. The estimates suggest that as the A share price premium increases, a given change in the price gap would have an increasing pulling up effect on H share price.
Specifically, the first 20% price gap would increase H share price by 0.04%, compared with 0.93% when the price gap is 100%
(Chart 3). This is consistent with the general convergence hypothesis where a larger price gap represents greater profit opportunity, inducing more arbitrage activities. However, this result also supports the speculative trading strategy noted above. At high levels of A share price premium (which are associated mostly with small-cap stocks), there are increasing pulling-up effect on the H share price and decreasing pushing-down effect on the corresponding A share price, benefiting the traders taking long positions in both shares.
Chart 3 – Estimated nonlinear effect of A share premium on H share price growth
-0.5 0.0 0.5 1.0 1.5 2.0 2.5 3.0 3.5 4.0
0 20 40 60 80 100 120 140 160 180 200
-0.5 0.0 0.5 1.0 1.5 2.0 2.5 3.0 3.5 4.0
A over H premium H-share price
growth rate
H-share price growth rate
IV. Conclusion and policy implications To our knowledge, this research is the first attempt to use econometric tools to document price convergence of dual-listed A- and H-shares and the impact of the price gaps on A and H share price dynamics.
Based on the panel data of 39 dual-listed companies in Mainland and Hong Kong, this paper investigates the time series
properties of the dual-listed A and H share price gaps, and their impact on the dynamics of A and H share prices in their respective markets. The panel unit root tests indicate that the A-H share price differentials are stationary around a positive constant. This suggests relative price convergence (differentials do not persistently deviate from a certain level), but not absolute price convergence (no long-term price equalisation). Our estimates suggest that the simple average of the price gaps was 77% during the sample period of July 2005 to June 2007, and the time for a divergence from this gap to dissipate by one half is estimated at around 40 trading days.
Panel data regressions are also run to examine the impact of such price gaps on the dynamics of A and H share prices, using two-factor fixed-effect panel data models.
The linear model estimates suggest that the well-documented A-share premium tends to reduce A share price and raise the H share price growth rate after controlling for changes in overall market conditions. This is consistent with the convergence hypothesis under which A share price premium would increase the demand for H shares and decrease the demand for A shares, other things being equal. The estimates of the nonlinear suggest that the relationship is more complicated than what the linear model can capture. Specifically, below the threshold of a 100% price gap, an increase in the gap would have an increasing dampening effect on A share prices, but beyond the threshold, the dampening effect would diminish. The pulling-up impact on H share prices is also nonlinear, with an increasing force as the gap widens. This suggests that at high levels of the price gaps which are usually associated with small-cap stocks, the positive effect on H share prices tends to be large while the negative effect on A share prices tends to be small. This seems to provide evidence supportive of a reported speculative trading strategy that takes advantage of market segmentation and information asymmetry.
The findings have implications for policy thinking and discussion on the relationship between the Mainland and Hong Kong stock markets. First, there is evidence supporting the existence of investment activities that arbitrage on the price gaps.
Owing to the restrictions on cross-border capital flows in and out of the Mainland, much of such arbitrage activities probably go through the informal channels. As the number of dual-listed companies increases over time, the size of such illicit capital flows would rise, complicating the authorities’ analysis of fund flows and monitoring of associated risks.
Second, the segmentation of the markets with only partial and incomplete arbitrage seems to induce speculative activities that take advantage of the imbalanced supply of A and H shares of the dual-listed companies and information asymmetry between Mainland and international investors, particularly in relation to small-cap companies. Such activities work against the force of arbitrage and may increase volatility in both A and H share prices. Again, this concern will increase as the number of dual-listed companies rises. This would inhibit efficient price discovery, and also add to market volatility on both sides.
Our results support the case for furthering market integration between the Mainland and Hong Kong. By enhancing the linkages between dual-listed A- and H-shares through expansion of QDII/QFII schemes and other means of increasing convertibility between A and H shares including Exchange Traded Funds (ETF), the investors’ access to both markets will be improved, enhancing the price convergence process. This would deter illicit cross border capital flows and speculation and manipulation of stock prices that add to market volatility, and help to promote the healthy development of the financial market of the whole country.
Appendix 1 A-share Price Premium of Dual-listed Stocks and Stock Ownership
Premiums
A H A H A over H
1 Air China Ltd 9.5 36.0 10.8 6.0 79.7
2 Angang Steel Co. Ltd 15.9 15.0 18.7 16.1 16.2
3 Anhui Conch Cement Co. Ltd 16.8 27.7 56.2 43.9 28.0 4 Anhui Expressway Co. Ltd 18.1 29.7 9.3 6.8 37.8
5 Bank of China Ltd 2.1 29.9 5.8 3.8 52.7
6 Beijing North Star co. Ltd 28.2 21.0 15.4 6.0 159.5 7 Beiren Printing Machinery Holdings Ltd 28.5 23.7 11.3 4.0 182.2 8 China Eastern Airlines Corporation Ltd 8.1 32.2 9.8 3.7 162.4 9 China Life Insurance Co. Ltd 3.2 26.3 37.8 24.2 56.3 10 China Merchants Bank Co. Ltd 32.0 18.1 22.2 20.2 10.0 11 China Petroleum & Chemical Corporation 4.1 19.4 15.2 8.7 73.8 12 China Shipping Development Co. Ltd 13.6 39.0 22.3 15.3 45.7 13 China Southern Airlines Co. Ltd 22.9 26.8 9.7 4.6 110.8 14 Datang International Power Generation Co. Ltd 5.2 27.3 24.1 10.2 136.8 15 Dongfang Electrical Machinery Co. Ltd 16.9 37.8 53.4 34.5 54.7 16 Guangshen Railway Co. Ltd 25.6 20.2 9.4 6.5 44.3 17 Guangzhou Pharmaceutical Co. Ltd 20.1 27.1 14.2 8.0 77.2 18 Guangzhou Shipyard International Co. Ltd 32.5 31.8 43.9 37.5 17.0 19 Huadian Power International Corporation Ltd. 12.3 23.8 11.3 4.1 175.3 20 Huaneng Power International, Inc. 5.4 25.3 14.4 8.0 79.2 21 Industrial and Commercial Bank of China Ltd 2.7 24.9 5.6 4.1 36.7 22 Jiangsu Expressway Co. Ltd 6.0 24.3 9.4 7.5 25.7
23 Jiangxi Copper Co. Ltd 9.8 47.9 26.0 12.5 107.8
24 Jiaoda Kunji High-Tech Co. Ltd 25.3 28.8 19.4 12.8 51.5 25 Jingwei Textile Machinery Co. Ltd 37.6 29.9 10.8 5.6 95.4 26 Maanshan Iron & Steel Co. Ltd 12.5 26.8 9.1 6.1 49.5 27 Nanjing Panda Electronic Co. Ltd 12.0 36.9 11.2 4.1 175.6 28 Northeast Electric Development Co. Ltd 20.6 29.5 8.3 3.1 166.6 29 Shandong Xinhua Pharmaceutical Co. Ltd 26.1 32.8 9.2 3.2 185.3 30 Shenzhen Expressway Co. Ltd 10.0 34.3 10.0 6.2 62.3 31 Sinopec Shanghai Petrochemical Co. Ltd 10.0 32.4 14.2 5.2 176.0 32 Sinopec Yizheng Chemical Fibre Co. Ltd 5.0 35.0 13.8 3.8 262.8 33 Tianjin Capital Environmental Protection co. Ltd 22.8 24.5 9.2 4.8 90.2
34 Tsingtao Brewery Co. Ltd 18.0 50.1 25.7 19.2 34.1
35 Yanzhou Coal Mining Co. Ltd 7.3 39.8 15.7 10.1 56.3
36 ZTE Corporation 50.8 16.7 54.2 37.5 44.5
37 PING AN 7.8 34.8 62.2 45.3 37.4
38 CHONGQING IRON 16.2 31.0 8.2 3.6 127.8
39 CITIC BANK 5.9 31.8 10.9 5.9 83.4
Figures as of 13th May 2007 H-share index constituents
Ratio of outstanding A/H shares to total outstanding shares (%)
Share prices
Source: Bloomberg and staff estimate
Reference
Campbell, John. Y. and Pierre Perron (1991), “Pitfalls and Opportunities: What Macroeconomists Should Know about Unit Roots,” in O.J. Blanchard and S. Fisher (eds.) NBER Macroeconomics Annual, Vol. 6, MIT Press, Cambridge, Massachusetts.
Chan Kalok and John K.H. Kwok (2005), “Market Segmentation and Share Price Premium:
Evidence from Chinese Stock Markets”, Journal of Emerging Market Finance, 4:1, pp.43 – 61.
Fang Xinghai (2007), “Linking A and H shares,” Caijing, 10 January, 2007.
Hui Miao and Wensheng Peng (2007), “Why A Share Market Volatility is High?” China Economic Issues, June 2007.
Levin, Andrew and Chien-Fu Lin (1992), “Unit Root Tests in Panel Data: Asymptotic and Finite-Sample Properties,” mimeo, University of California, San Diego.
Yam, Joseph, “Linking the Mainland's and Hong Kong's financial markets”, Viewpoint, Hong Kong Monetary Authority, Jan 2007
Yam, Joseph, “Linking the Mainland's and Hong Kong's financial markets (II)”, Viewpoint, Hong Kong Monetary Authority, Feb 2007
About the Author
Wensheng Peng is division head, Hui Miao and Nathan Chow are manager and analyst respectively in the External Department. The authors are responsible for the views expressed in this article and any errors.
About the Series
China Economic Issues provide a concise analysis of current economic and financial issues in China.
The series is edited by the External Department.
Distribution: CE, DCEs (by hard copy)
EDs, DHs, External Department (SMs & Ms) (by e-mail)