Manuscript submitted August 4, 2005; revised manuscript received February 3, 2006. Available electronically April 11, 2006.
The polymer electrolyte membrane fuel cell 共PEMFC兲 has at-tracted worldwide interest in the development and commercializa-tion of vehicular and stacommercializa-tionary applicacommercializa-tions. These power devices operate at high efficiency with pure hydrogen but degrade when using hydrogen from hydrocarbons or methanol reforming. This de-cline of performance is caused by the deactivation of the Pt anode catalyst due to trace levels of CO as low as 10–100 ppm.1,2 Mitigat-ing such a poisonMitigat-ing effect has been an ongoMitigat-ing task which chal-lenges scientists and engineers in this field. One of the solutions is to use alloy catalysts such as Pt/Ru, Pt/Mo, and Pt/Sn, which improve CO tolerance.1,3-6This improvement is due to either a lowered CO oxidation potential or a weakened adsorption of CO on these cata-lysts. In the presence of relatively high CO concentration, an addi-tional step involving bleeding an oxidant into the anode compart-ment has been explored.2,7,8The bleeding oxidant, which can be air, oxygen, or hydrogen peroxide, chemically oxidizes CO to CO2and lowers its concentration.
Many attempts to understand the mechanism of CO poisoning have been made by the use of electrochemical technique, in situ infrared spectroscopy, and X-ray absorption spectroscopy.4-6,9In re-cent years, impedance spectroscopy has been demonstrated to be a powerful experimental technique to examine the complexity of the different processes that take place in fuel cells and to provide better insight into the reaction mechanism of the electrode system and a systematic investigation of the roles of each parameter.10 Suitable modelistic treatments have been developed for the impedance re-sponse of gas diffusion electrodes.11,12 Furthermore, the electrode structure of cathode and the kinetics of the oxygen reduction have been studied with impedance technique using an H2/O2 single cell.13-15When the impedance of a full cell共O2on cathode and H2 on anode兲 is analyzed during discharging, the impedance spectrum reveals the combined impedance of cathode and anode. In most studies, neat hydrogen oxidizes so fast that its impedance is negli-gible and the impedance spectrum of the full cell eventually equals the cathode impedance. While the anode impedance cannot be ne-glected, e.g., poisoned by CO, the studies were generally carried out in a simulated cell. For practical studies, it is necessary to set up an in situ measuring system to clarify the effect of CO poisoning on the anode. It is possible to eliminate the contribution of the cathode in PEMFC by operating it with a continuous feed of hydrogen to the cathode in a H2+ CO/H2 cell.16-18 Recently, Zhigang et al. have found that transport of CO in the fuel through the membrane to the cathode side resulted in a decline in cathode performance.19,20The effect of CO on the cathode could be ignored when the experiments were carried out in an H2+ CO/H2half-cell.
In this study, we prepared a three-electrode membrane electrode
assembly共3E-MEA兲. Cell performance and ac impedance measure-ments were performed in a three-electrode mode system to investi-gate the effect of CO gas in the operation of PEMFC. The anode and cathode impedances were studied individually during the cell dis-charging. An equivalent circuit model was proposed to explain the results of impedance analysis for the anode and cathode.
Experimental
Catalyst preparation.— Carbon powder of Vulcan XC-72 was
used as the catalyst support. Required amounts of H2PtCl6 and RuCl3共Alfa兲 were dissolved in distilled water. Different composi-tions of bimetallic catalysts were prepared by impregnating the car-bon supports with solutions of Pt and Ru stirred for 4 h. Then methanol was added to reduce Pt and Ru at 70°C for 5 h. After the reduction, the catalyst was filtered, washed with distilled water, and dried at 60°C. In this study, four atomic ratios of Pt/Ru were ob-tained as 0.12, 0.38, 1.13, and 3.33. The weight percentage of Pt in summation of Pt and carbon is 20% in all catalysts. The catalyst was observed with a transmission electron microscope. The metal ticles were uniformly dispersed on the carbon support, and the par-ticle diameter was in the range of 3–7 nm.
Gas diffusion electrode.— Catalyst mixtures were prepared by
directly mixing Pt–Ru/C catalysts with Nafion solution共5%, Ald-rich兲 at a mass ratio of carbon/Nafion 共dry兲 = 70:30. Some water was added to dilute the mixture. The mixture was stirred for 1 h, followed by sonication for 1 h. The mixture was kept under stirring prior to application onto Teflon-treated carbon paper共Electrochem兲, and the gas diffusion medium was used as the anode or cathode substrate. The electrode was dried at room temperature for 30 min and then at 135°C for another 30 min to form the gas diffu-sion electrode. All the Pt–Ru/C catalysts used for cathode had a Ru/Pt atomic ratio of 0.12. The Ru/Pt atomic ratios of Pt–Ru/C catalyst used for anode were 0.12, 0.38, 1.13, and 3.33. The Pt loading in the gas diffusion electrodes was fixed to 0.8 mg/cm2, and all the Ru loadings in the gas diffusion electrodes depended on the Ru/Pt atomic ratio. The exposure area of the electrodes was 2.5⫻ 2.5 cm2.
3E-MEA.— A platinum film of 1.0⫻ 2.5 cm2with an electrical contact strip was deposited on a Nafion 117 membrane共DuPont兲 as a pseudoreference electrode in the form Pt/Nafion assembly by im-pregnation method.21A solution of 0.02 M Pt共NH3兲4Cl2 共Aldrich兲 was first put on one side of the Nafion membrane at 40°C for 2 h to allow Pt共II兲 ions to permeate the membrane. After the Nafion mem-brane was rinsed with deionized water, a solution of 0.2 M NaBH4 共Ferak兲 was placed in contact with the Nafion membrane on the same side that had been impregnated with Pt共NH3兲4Cl2. The Pt was reduced on the membrane surface by NaBH4 at 40°C for 0.5 h. 3E-MEA was made by hot-bonding gas diffusion electrodes on the
*Electrochemical Society Active Member.
z
Pt/Nafion assemblies, as shown in Fig. 1, at 120°C for 90 s. The anode gas diffusion electrode and the deposited Pt electrode were on the same side of Nafion, and the cathode gas diffusion electrode was on the other side. The spacing between anode electrode and pseudoreference electrode was 2 mm.
Polymer electrolyte membrane fuel cell measurement.— The
3E-MEAs were tested in a single cell. The deposited Pt electrode contacted with the anode gas which diffused from the flow-field plate. The anode shared the same gas with the pseudoreference Pt electrode. This Pt electrode needed to avoid contact with the anode flow-field plate. Oxygen was the cathode gas, and neat H2, 25 ppm CO in H2, 100 ppm CO in H2, or 100 ppm CO and 2% O2in H2 was used as the anode gas. All of the gases were humidified by a humidifier, and the gas flow rates were all 100 mL/min. The tem-peratures of the cell, anode gas humidifier, and cathode gas humidi-fier were 70, 95, and 40°C, respectively.
The polarization curves of the cell 共cathode against anode兲 at steady state were collected using an electronic load共model 63010 from Chroma兲, and the anode and cathode polarization curves were measured against the pseudoreference electrode using a multimeter 共model 6001 from Prema兲 at the same time. An impedance analyzer 共PGATAT-30 from Autolab兲 was used to carry out the ac impedance measurements over the frequency range of 5 kHz–10 mHz in three-electrode mode at constant potential. The corresponding current was recorded according to polarization curve. A small signal, 10 mV in amplitude, was applied to the system throughout the experiments.
Results and Discussion
In a fuel cell, the cell potential共E兲 can be expressed by revers-ible potential共Er兲 and overpotentials 共兲22
E = Er−兩ct,c兩 − 兩mt,c兩 − 兩ct,a兩 − 兩mt,a兩 − 兩s兩 关1兴
The subscripts ct,c, mt,c, ct,a, and mt,a denote the charge-transfer
and mass-transport overpotentials at the cathode and anode, and s denotes the ohmic potential drop. The overall cell resistance, com-posed of several resistances, can be calculated from the first deriva-tion of the polarizaderiva-tion curve
Roverall⬘ =兩E/i兩 = Rct,c⬘ + Rmt,c⬘ + Rct,a⬘ + Rmt,a⬘ + Rs⬘ 关2兴 The superscript
⬘
denotes the resistances calculated from polariza-tion curves. To study the behavior of the electrode of interest, a three-electrode cell is preferable. The expressions for the potential and resistance of the working electrode areEwk= Er,wk−兩ct,wk兩 − 兩mt,wk兩 − 兩u,wk兩 关3兴
Roverall,wk⬘ =兩Ewk/i兩 = Rct,wk⬘ + Rmt,wk⬘ + Ru,wk⬘ 关4兴 The potential共Ewk兲 and reversible potential 共Er,wk兲 of the working electrode are referred to the reference electrode, andu,wkand Ru,wk
⬘
are the uncompensated overpotential and resistance between the working and reference electrodes.
Analysis with polarization curves.— The performance of a
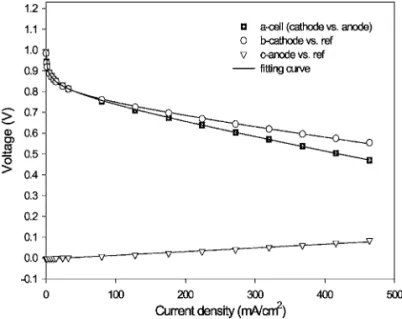
single cell with 3E-MEA was measured in the two-electrode and three-electrode modes simultaneously. Figure 2 shows the typical polarization curves of the cell共cathode vs anode兲, cathode 共vs ref-erence electrode兲, and anode 共vs reference electrode兲. The cell po-tential was confirmed to be equal to the popo-tential difference between cathode and anode at each controlled current experimentally. In the cell polarization curve, the potential decreased with increase of cur-rent density and can be fitted into the following equation
E = Eo− b log i − iRs⬘ 关5兴
where b, Rs
⬘
, and Eoare Tafel slope, electrolyte resistance, andopen-circuit potential, respectively. The second and third terms on the right refer to charge transfer on the electrodes and ion transport in the electrolyte, respectively. The corresponding impedance can be obtained from the derivation. Below 50 mA/cm2, the rapid decrease in cell potential was mainly due to charge-transfer overpotential. Between 50 and 464 mA/cm2, the linear decrease in cell potential was mainly due to ohmic resistance, and the constant slope of the curve was equal to the cell resistance Rs
⬘
. The rapid decrease of potential due to mass-transfer overpotential did not appear in the measured range of current density. On the anode polarization curve, the anode potential increased linearly with current density. This behavior depicted that the anode charge-transfer resistance was negligible and that the resistance of electrolyte between anode and pseudoreference electrodes was constant. The slope of the anode polarization curve is equal to uncompensated anode resistanceFigure 1. Schematic diagram of 3E-MEA.
Figure 2. Polarization curves for cell and individual electrodes.
A1044 Journal of The Electrochemical Society, 153共6兲 A1043-A1048 共2006兲
Ru,a
⬘
. The cathode polarization curve was close to the cell polariza-tion curve. Apparently, below 50 mA/cm2, the rapid decrease in cathode potential was due to the charge-transfer overpotential of oxygen reduction. This means the cell charge-transfer overpotential was mainly from oxygen reduction. In the range of 50–464 mA/ cm2, the linear decrease in cathode potential was mainly due to the ohmic resistance of electrolyte between cathode and pseudorefer-ence electrode, and the constant slope of curve was equal to Ru,c⬘
. Clearly, the behavior of anode or cathode can be effectively studied individually in the three-electrode cell.The influence of CO content in hydrogen on the polarization curves of cell and individual electrodes is shown in Fig. 3 and 4, respectively, with the electrode catalyst of Ru/Pt 0.12. The open-circuit potential with fuels of neat H2, CO/H2, and O2/CO/H2was 1.05 V, independent of the CO concentration in the hydrogen. This phenomenon suggested that the equilibrium potential of the anode was predominantly determined by the equilibrium of H2/H+. Com-paring the polarization curves of cell and cathode in Fig. 3 and 4, respectively, the cell potential decreased rapidly when current
den-sity increased up to 30 mA/cm2 due to charge-transfer over-potential of oxygen reduction, as described above. In the current density range of 30–120 mA/cm2, the sharp decrease in the cell potential in 25 and 100 ppm CO/H2was mainly due to the increase in anode overpotential as a result of CO poisoning. At current density higher than 120 mA/cm2, the slope with CO content de-creased to that without CO and can be rationalized by oxidation of CO on the anode. A significant improvement in the CO tolerance was observed by addition of O2 into the inlet gas of 100 ppm CO/H2.
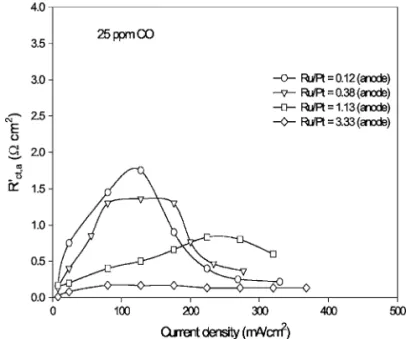
The effect of anode composition on the curve of anode charge-transfer resistance vs current density in 25 ppm CO/H2is shown in Fig. 5. The anode charge-transfer resistance共Rct,a
⬘
兲, calculated from anode polarization curves, increased with current density and de-clined after a maximum value. Above the current with the maximum charge-transfer resistance, the anode potentials were positive enough to oxide the adsorbed CO to CO2and thus, led to higher reaction rates, with smaller Rct,a⬘
, for hydrogen adsorption and oxidation. With higher atomic ratios of Ru/Pt in the anode catalysts, the effect of current density on reaction rate was weaker and the maximum values of Rct,a⬘
were smaller. These phenomena were consistent with the results, showing that addition of Ru into Pt anode catalysts was able to significantly increase the tolerance of CO. However, the atomic ratio of Ru/Pt of the prepared catalyst which gave the best performance was 3.33 in this study.Analysis with ac impedance spectra.—The electrode of the
PEMFC was porous, and only the three-phase active sites were re-active. The active sites were the junctions of catalyst, electrolyte, and gaseous reactants. An equivalent circuit model for ac impedance analysis of the electrodes was proposed as shown in Fig. 6. Ruis
the uncompensated resistance of the Nafion membrane between working and reference electrodes. Rctand RNare the charge-transfer resistance on the catalyst and the ohmic resistance of the electrolyte in the catalytic layer, respectively. Cdland CNare the capacitance on
the catalyst and carbon support, respectively.
The ac impedance spectra were obtained with constant potential mode in the frequency range of 5 kHz–0.01 Hz. The applied poten-tials were correlated to loading currents with the polarization curve. For comparison, the controlled condition was reported in terms of the corresponding current. Figure 7 shows the Nyquist plots for both cathode and anode under various currents共or potentials兲. The currents of 50, 100, 500, and 900 mA corresponded to the applied
Figure 3. Cell polarization curves with various concentrations of CO and O2 in H2.
Figure 4. Cathode and anode polarization curves with various concentra-tions of CO and O2in H2as the fuel.
Figure 5. The relationship between anode charge-transfer resistance and current density at various compositions of anode catalyst with 25 ppm CO/H2as the fuel.
cathode potentials 851, 797, 552, and 325 mV and the applied anode potentials of 1, 15, 130, and 249 mV, respectively. Each Nyquist plot in Fig. 7 shows two capacitive loops. When the loading current 共or overpotential兲 increased, the capacitive loop at low frequency shrank but the capacitive loop at high frequency remained the same. That meant that the capacitive loops at low and high frequency corresponded to the charge-transfer reaction共Rct,Cdl兲 and the ohmic resistance of the catalytic layer共RN,CN兲 in the equivalent circuit
model, respectively.
Figure 7 shows that the experimental data were well fitted to the equivalent circuit in Fig. 6, except the inductive loops at very low frequency in anode Nyquist plots as shown in Fig. 7b. The inductive loop was typical of a system with adsorbed intermediates16,17,23 and was not simulated in this study. From Fig. 7, the uncompensated resistance, Ru, was reasonably found independent of current density. The influence of the CO content in the hydrogen on the
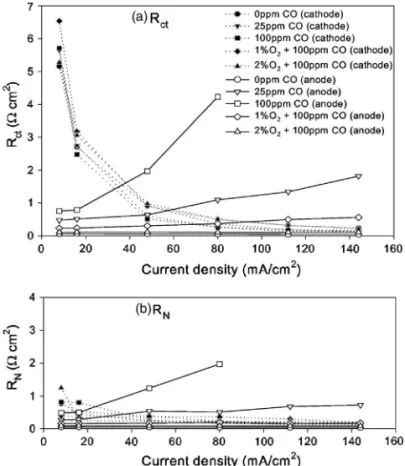
re-sistances, Rct, and RN, of cathode and anode with anode catalyst of Ru/Pt 0.12 is shown in Fig. 8. Figure 8a shows that the cathode
charge-transfer resistance Rct,cwas large in the low-current-density region and decreased rapidly with increasing current density, as commonly found on most electrodes. However, Fig. 8a also shows that the anode charge-transfer resistance Rct,a increased with cur-rent density. This behavior can be depicted from the slope of corre-sponding curves at current density lower than 120 mA/cm2 in Fig. 4. Higher concentration of CO gave stronger dependence. The addition of oxygen into CO/H2 effectively mitigated the anode charge-transfer resistance Rct,a. Therefore, the value of Rct,ain 2% O2/CO/H2was about the same as that in neat H2. The presence of CO in hydrogen weakly affected Rct,c, similar to the observation in the cathode polarization curve in Fig. 4.
For 100 ppm CO, unusual impedance spectra were observed at current densities higher than 112 mA/cm2, as shown in Fig. 9. The capacitive loop at medium frequency appeared in the second quad-rant and the low inductive loop appeared in the third quadquad-rant. Simi-lar impedance spectra were found in the corrosion studies when metals were in a transpassive dissolution region.24,25When the an-ode potential is more positive than a particular value, the passive layer on the metal surface breaks down and the anodic current in-creases rapidly. This phenomenon is similar to that in the presence of CO in this study. Generally, most of the active sites were covered with an adsorbed CO layer, in analogy to the passive layer of metals. When anode potential became more positive, adsorbed CO was oxi-dized and gave a free metal surface for hydrogen adsorption. The oxidation rate of hydrogen increased rapidly when the potential be-came more positive. In Fig. 9, the capacitive loop started to bind toward the negative real part at 112 mA/cm2, which implies that the
adsorbed CO was reacted to CO2 at current density above
112 mA/cm2. The result was confirmed in the anode polarization curve for 100 ppm CO in Fig. 4. In this polarization curve, current density increased tremendously with potential when current density was larger than 112 mA/cm2.
Figure 6. The equivalent circuit model of the electrode in this study.
Figure 7. Nyquist plots for共a兲 cathode and 共b兲 anode at various currents.
Figure 8. The resistances in the equivalent circuit vs current density with various concentrations of CO and O2in H2as the fuel:共a兲 Rctand共b兲 RN.
A1046 Journal of The Electrochemical Society, 153共6兲 A1043-A1048 共2006兲
Figure 8b shows the dependence of the ohmic resistance in the catalytic layer共RN兲 on current density. The cathode resistance RN,c,
was not affected significantly in the presence of CO in hydrogen. However, the anode resistance RN,aincreased with the concentration
of CO in hydrogen, which is a similar trend to Rct,a. This result should not be explained from the point of view of the Nafion poly-mer electrolyte in catalytic layer, because the concentration of CO was too low to affect the conductivity of the Nafion polymer elec-trolyte. A proper explanation can be based on the structure of the catalytic layer, which was porous. As a binder, the Nafion polymer electrolyte was distributed in the catalytic layer to form an electro-lyte net. Figure 6 is the equivalent circuit for the reaction behavior on a single active site. This equivalent circuit was successfully ap-plied to explain the reaction behavior of the electrode without CO poisoning. However, as the CO poisoning occurred, it failed to ex-plain the increase of ohmic resistance in the catalytic layer with current density. The reaction behavior of the electrode might be explained with the complex equivalent circuit in Fig. 10. In each Nafion polymer electrolyte channel in the catalytic layer, the ohmic resistance connected with the charge-transfer resistance in series, as shown in Fig. 10a. There were numerous Nafion polymer electrolyte channels in the catalytic layer. All of these electrolyte channels formed a proton conductive net with multiple channels and basically connected in parallel. RN and Rctin Fig. 6 may be considered the sums of the parallel connection for the ohmic and the charge-transfer resistances in each electrolyte channel in Fig. 10, respec-tively. As the CO poisoning occurred, many active sites adsorbed CO and became inactive. The Nafion polymer electrolyte connected to the inactive sites also became nonconductive, because the proton did not transport in this path to participate in any reaction. There-fore, parts of the parallel connections in the equivalent circuit dis-appeared due to the CO poisoning, as shown in Fig. 10b. Therefore,
RN,a 共the sum of parallel connection for ohmic resistance in each
electrolyte channel兲 increased with Rct,ain the presence of CO, as shown in Fig. 8.
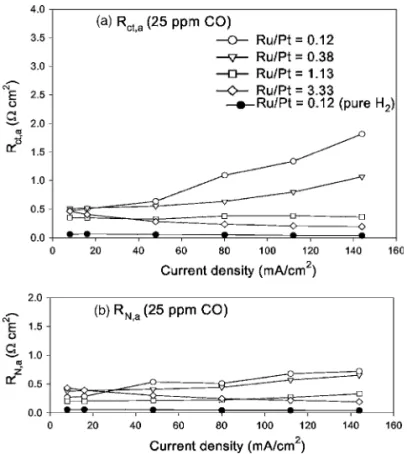
The effect of the composition of anode catalyst on the relation-ship of anode resistance vs current density in 25 ppm CO/H2 is shown in Fig. 11. The charge-transfer resistances 共Rct,a兲 and the ohmic resistances in catalytic layer共RN,a兲 were calculated from
im-pedance spectra. Figure 11 shows that Rct,aand RN,aincreased with current density due to the presence of CO. With a higher atomic
ratio of Ru/Pt in anode catalysts, the increase in the resistance was smaller. The addition of Ru into the Pt anode catalyst significantly improved of the CO tolerance.
Results from two analytical methods.— The comparison
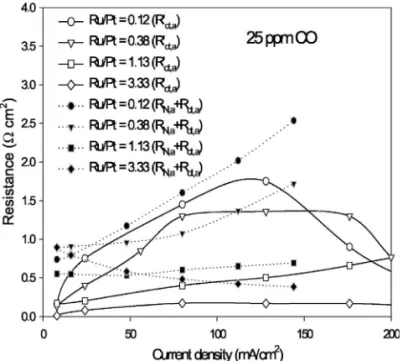
be-tween the resistances obtained from polarization curves and imped-ance spectra is shown in Fig. 12. Rct,a
⬘
is the charge-transfer resis-tance obtained from an anode polarization curve. Rct,aand RN,aarethe charge-transfer and the ohmic resistances in catalytic layer
ob-Figure 9. Anode Nyquist plots of various current densities with 100 ppm
CO/H2as the fuel. Figure 10. The equivalent circuit model of proton exchange membrane fuel cell:共a兲 neat H2as the fuel and共b兲 CO/H2as the fuel.
Figure 11. Anode resistances in the equivalent circuit vs current density with various anode compositions with 25 ppm CO/H2as the fuel:共a兲 Rct,a and共b兲 RN,a.
tained from an anode impedance spectra. It is observed that the curves of Rct,a
⬘
and Rct,a+ RN,a are comparable. In the presence ofCO, the increase of anode overpotential observed in the polarization curve was attributed to the increase of charge-transfer resistance. The ac impedance analysis provided a better indication that the in-crease of anode overpotential was contributed by the inin-crease of both charge-transfer resistance and ohmic resistance in the catalytic layer.
Conclusions
In general, the membrane electrode assembly of PEMFCs in-cludes only two electrodes, anode and cathode. A third Pt electrode on Nafion membrane, prepared by the impregnation-reduction method, was used as the pseudoreference electrode to form a 3E-MEA. The performance of the cell was carried out in three-electrode mode system. During the cell discharging, the reaction behaviors of the anode and cathode could be studied in the three-electrode cell separately. The behavior of CO in PEMFC was investigated by a polarization curve and ac impedance analysis. An equivalent circuit model was proposed to explain the impedance spectra for the anode and cathode. In the presence of CO, the experimental results of ac impedance analysis suggest that the overpotential due to CO poison-ing of the anode was contributed by the increaspoison-ing of both charge-transfer resistance and the ohmic resistance in the catalytic layer.
Acknowledgments
Financial support from National Science Council 共NSC-93-4412-E006-026兲 and National Cheng Kung University in Taiwan are gratefully acknowledged.
National Chen Kung University assisted in meeting the publication costs of this article.
List of Symbols
b Tafel slope
Cdl capacitance of the catalyst
CN capacitance on the carbon support
E, Er cell potential and reversible cell potential
Ewk, Er,wk potential and reversible potential of working electrode
Eo open-circuit potential of cell
Rct, RN charge-transfer resistance on the catalyst and ohmic resistance
of electrolyte in a catalytic layer of an individual electrode calcu-lated from ac impedance analysis
Rct,a, Rct,c charge-transfer resistance at anode and cathode calculated from
ac impedance analysis
RN,a, RN,c resistance of electrolyte in the catalyst layer at anode and
cath-ode calculated from ac impedance analysis
Ru uncompensated resistance of Nafion membrane between
indi-vidual electrode and reference electrodes calculated from ac im-pedance analysis
Rct,a⬘ , Rct,c⬘ , Rct,wk⬘ charge-transfer resistance at anode, cathode, and working
elec-trodes calculated from polarization curves
Rmt,a⬘ , Rmt,c⬘ , Rmt,wk⬘ mass-transport resistance at anode, cathode, and working
elec-trodes calculated from polarization curves
Rs⬘ electrolyte resistance in a cell calculated from polarization
curves
Roverall,wk⬘ , Ru,wk⬘ overall and uncompensated resistances between working and
reference electrodes calculated from polarization curves ct,a,ct,c,ct,wk charge-transfer overpotential at anode, cathode, and working
electrodes
mt,a,mt,c,mt,wk mass-transport overpotential at anode, cathode, and working
electrodes
u,wk uncompensated overpotential between working and reference
electrodes
s ohmic potential drop in a cell
References
1. H. F. Oetjen, V. M. Schmidt, U. Stimming, and F. Trila, J. Electrochem. Soc., 143, 3838共1996兲.
2. J. Divisek, H. F. Oetjen, V. Peinecke, V. M. Schmidt, and U. Stimming,
Electro-chim. Acta, 43, 3811共1998兲.
3. S. Mukerjee, S. J. Lee, E. A. Ticianelli, J. McBreen, B. N. Grgur, B. N. Grgur, N. M. Markovic, P. N. Ross, J. R. Giallombardo, and E. S. De Castro, Electrochem.
Solid-State Lett., 2, 12共1999兲.
4. Y. Morimoto and E. B. Yeager, J. Electroanal. Chem., 441, 77共1998兲. 5. S. D. Lin, T.-C. Hsiao, J.-R. Chang, and A. S. Lin, J. Phys. Chem., 103, 97共1999兲. 6. H. A. Gasteiger, N. Mrkovic, P. N. Ross, Jr., and E. J. Cairns, J. Phys. Chem., 98,
617共1994兲.
7. S. Gottesfeld and J. Pafford, J. Electrochem. Soc., 135, 2651共1988兲. 8. B. Rohland and V. Polzak, J. Power Sources, 84, 183共1999兲.
9. R. Ianniello, V. M. Schmidt, U. Stimming, J. Stumper, and A. Wallau, Electrochim.
Acta, 39, 1863共1994兲.
10. T. J. P. Freire and E. R. Gonzalez, J. Electroanal. Chem., 503, 57共2001兲. 11. T. E. Springer and D. Raistrick, J. Electrochem. Soc., 136, 1594共1989兲. 12. M. Eikerling and A. A. Kornyshev, J. Electroanal. Chem., 475, 107共1999兲. 13. T. E. Apringer, T.A Zawodzinski, M. S. Wilson, and S. Gottesfeld, J. Electrochem.
Soc., 143, 587共1996兲.
14. J. M. Song, S. Y. Cha, and W. M. Lee, J. Power Sources, 94, 78共2001兲. 15. V. A. Paganin, C. L. F. Oliverira, E. A. Ticianelli, T. E. Springer, and E. R.
Gonzalez, Electrochim. Acta, 43, 3761共1998兲.
16. M. Ciureanu and H. Wang, J. Electrochem. Soc., 146, 4031共1999兲.
17. X. Wang, I.-M. Hsing, Y.-J. Leng, and P.-L. Yue, Electrochim. Acta, 46, 4397 共2001兲.
18. J.-D. Kim, Y.-I. Park, K. Kobayashi, and M. Nagai, Solid State Ionics, 140, 313 共2001兲.
19. Z. Qi, C. He, and A. Kaufman, Electrochem. Solid-State Lett., 4, A204共2001兲. 20. Z. Qi, C. He, and A. Kaufman, J. Power Sources, 111, 239共2002兲.
21. K.-I. Tsceng and M.-C. Yang, J. Electrochem. Soc., 150, H156共2003兲. 22. Y. W. Rho and S. Srinivasan, J. Electrochem. Soc., 141, 2089共1994兲. 23. O. Antoine, Y. Bultel, and R. Durand, J. Electroanal. Chem., 499, 85共2001兲. 24. C. Gabrielli, M. Keddam, and H. Takenouti, in Electrochemical Impedance:
Analy-sis and Interpretation, J. R. Scully, D. C. Silverman, and M. W. Kendig, Editors, p.
140, American Society for Testing and Materials, Philadelphia, PA共1993兲. 25. I. Epelboin, C. Gabrelli, M. Keddam, and H. Takenouti, in Comprehensive Treatise
of Electrochemistry, J. O’M. Bockris, B. E. Conway, E. Yeager, and R. E. White,
Editors, Vol. 4, p. 151, Plenum Press, New York共1981兲.
Figure 12. Relationship between the anode polarization resistance and cur-rent density with various analysis methods共Rct,a⬘ vs Rct,a+ RN,a兲 with 25 ppm CO/H2as the fuel.
A1048 Journal of The Electrochemical Society, 153共6兲 A1043-A1048 共2006兲