On the Quality of Service of Cloud Gaming Systems
Kuan-Ta Chen, Member, IEEE, Yu-Chun Chang, Hwai-Jung Hsu, De-Yu Chen, Chun-Ying Huang, Member, IEEE, Cheng-Hsin Hsu, Member, IEEE
Abstract
Cloud gaming, i.e., real-time game playing via thin clients, relieves users from being forced to upgrade their computers and resolve the incompatibility issues between games and computers. As a result, cloud gaming is generating a great deal of interests among entrepreneurs, venture capitalists, general publics, and researchers. However, given the large design space, it is not yet known which cloud gaming system delivers the best user-perceived Quality of Service (QoS) and what design elements constitute a good cloud gaming system.
This study is motivated by the question: How good is the QoS of current cloud gaming systems?
Answering the question is challenging because most cloud gaming systems are proprietary and closed, and thus their internal mechanisms are not accessible for the research community. In this paper, we propose a suite of measurement techniques to evaluate the QoS of cloud gaming systems and prove the effectiveness of our schemes using a case study comprising two well-known cloud gaming systems:
OnLive and StreamMyGame. Our results show that OnLive performs better, because it provides adaptable frame rates, better graphic quality, and shorter server processing delays, while consuming less network bandwidth. Our measurement techniques are general and can be applied to any cloud gaming systems, so that researchers, users, and service providers may systematically quantify the QoS of these systems.
To the best of our knowledge, the proposed suite of measurement techniques have never been presented in the literature.
Copyright (c) 2013 IEEE. Personal use of this material is permitted. However, permission to use this material for any other purposes must be obtained from the IEEE by sending a request to [email protected].
Manuscript received April 4, 2013; revised June 25, 2013; accepted September 3, 2013.
K. T. Chen, Y. C. Chang, H. J. Hsu, and D. Y. Chen are with Institute of Information Science, Academia Sinica. C. Y. Huang is with Department of Computer Science, National Taiwan Ocean University. C. H. Hsu is with Department of Computer Science, National Tsing Hua University.
Keywords
Cloud gaming, live video streaming, measurement, performance evaluation, remote rendering
I. INTRODUCTION
Modern computer games are often computationally and graphically intensive, and thus demand for the latest hardware such as multi-core CPUs and high-end graphic cards for fluent game playing [1]. The overhead of setting up a game is also significant because game software is becoming more and more complex. As a result, users are often restricted to one well-equipped computer and cannot play games anytime, anywhere. Furthermore, trying a new game is time consuming, because the game software may be incompatible to users’ computers, which forces users to reconfigure their computers. This in turn drives potential users away from computer games. All these issues impose serious burdens on users, and solving the issues is crucial to the game industry for attracting more users.
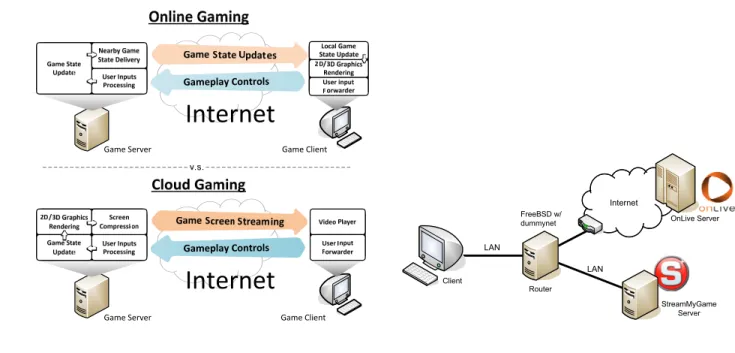
Cloud gamingis a promising solution to ease the burdens on users. In cloud gaming, computer games run on cloud servers and users interact with games via thin clients, which run on commodity PCs, TVs with set-top boxes, and mobile devices with Internet access. Please note that “traditional” online games also leverage the abundant computing resources in the clouds. As illustrated in Figure 1, traditional online gaming is quite different from the considered cloud gaming. More specifically, in online gaming, all the game logics are executed at game clients, and the game servers are only responsible to maintain consistent game states among multiple game clients. In contrast, the game logics, including the resource-demanding graphics rendering is moved to game servers with the cloud gaming architecture. By offloading the game logics to cloud servers, cloud gaming frees users from the overhead of setting up games, solving hardware/software incompatibility issues, and the need of upgrading their computers. Moreover, cloud gaming is also beneficial to game developers for various reasons, e.g., they no longer need to: 1) support heterogeneous devices and libraries, 2) produce game DVDs, and 3) worry about piracy [2]. Hence, cloud gaming systems may change the way computer games are delivered and played.
In fact, cloud gaming has already generated a great deal of interests among entrepreneurs, venture capitalists, the general publics, and researchers. Several startup companies have offered or plan to offer cloud gaming services, such as OnLive, StreamMyGame, GaiKai, G-Cluster, OTOY, Ubitus, and T5- Labs, though their realizations may be quite different from one another. For example, some systems are only accessible via thin clients on PCs (either native or browser-based applications), while others can be accessed via TVs with set-top boxes. A large number of design alternatives can be adopted when
Game Server
Gameplay Controls
Game Client Game Server
Gameplay Controls
Game Client
Fig. 1. Comparisons between online and cloud gaming.
FreeBSD w/
dummynet
LAN
OnLive Server Internet
LAN
StreamMyGame Server Client
Router
Fig. 2. The network topology of our measurement experi- ments.
implementing a cloud gaming system, such as: 1) the way the existing game software is modified and run on the server; 2) the way the game screen is encoded (on the server) and decoded (on the client); 3) the way the encoded game screen is streamed to the client; and 4) the way short-term network instability is handled to maintain the game’s responsiveness and graphic quality. Because of the large design space of cloud gaming systems, it is not yet known which systems deliver better Quality of Service (QoS) than others and which design elements constitute a good cloud gaming system.
In this paper, we answer the above-mentioned two questions. We achieve this by proposing a suite of novel client-side measurement techniques to quantify the user-perceived QoS of the cloud gaming systems. Designing these client-side techniques, however, is very challenging, because the cloud gaming systems are mostly proprietary and closed. Therefore, their internal mechanisms are not public to the research community. Furthermore, service providers host the cloud servers and the games in their own data centers, and thus we do not have the luxury to augment the servers and games for measurement purposes. Hence, measuring the QoS of these cloud gaming systems in a component-wise manner is extremely difficult, if not impossible.
The performance of cloud gaming systems may be evaluated from a number of view angles. From service providers’ perspective, the efficiency of resource allocation schemes is crucial; however, from the end users’ perspective, the QoS metrics affecting gaming experience are far more important. Another
way to classify the performance metrics is by the time-scale: larger time-scale metrics across multiple game sessions and smaller time-scale metrics are within individual game sessions. In this article, we consider small time-scale metrics from the users’ perspective. We chose small time-scale because most cloud gaming systems serve each user using a single Virtual Machine (VM) without load balancing, while VM migration within individual game sessions is unlikely for the sake of high requirements on the responsiveness of games. We focus on the users’ perspective, because the cloud gaming services will not sustain without satisfied users. In particular, we concentrate on the following metrics:
• Traffic characteristics: How much network bandwidth is consumed by a game session?
• Latency: How smooth is the game play on a thin client? Also, how much latency is incurred by each component?
• Graphic quality: How faithful is the quality of the streamed game screens on a thin client? How does the graphic quality degrade over imperfect network conditions?
To the best of our knowledge, rigorously quantifying these (and other) user-perceived QoS metrics of cloud gaming systems has never been considered in the literature. More specifically, the current article makes the following two contributions:
• We propose a suite of measurement techniques to systematically measure the QoS of proprietary and closed cloud gaming systems. The proposed measurement techniques require no access to the source code nor data centers of the considered cloud gaming systems. Researchers, users, and service providers may apply our measurement techniques to any cloud gaming systems to study their QoS.
• We analyze two commercial cloud gaming systems, OnLive and StreamMyGame, and compare their QoS in terms of the traffic characteristics, delay components, update region sizes, frame rates, and graphic quality. Our evaluation results show that OnLive performs better in general.
In summary, our proposed measurement techniques can be leveraged by the research community and practitioners to better understand the component-wise QoS of cloud gaming systems.
The remainder of this paper is organized as follows. Section II provides a review on related studies.
In Section III, we introduce the cloud gaming systems under evaluation and the measurement setup. In Section IV, the traffic characteristics of the chosen systems are analyzed. In Section V, our measurement techniques of the responsiveness of cloud gaming systems are depicted, and the evaluation results of OnLive and StreamMyGame are presented. In Section VI, we further analyze the impacts of different system parameters on the responsiveness of cloud gaming systems. Section VII measures the graphic quality under various network conditions. The fairness and effectiveness of our measurement techniques
are discussed in Section VIII, and our concluding remarks are presented in Section IX.
II. RELATEDWORK
This paper touches upon two research domains: designing cloud gaming systems and measuring the QoS of cloud gaming systems. In this section, we review the literature in both domains.
A. Remote Gaming Architecture
A number of thin client architectures have been proposed to support real-time remote graphical applications, including remote gaming [3–8]. They can be roughly divided into two categories: instruction- and image-based. The instruction-based systems [3, 4, 7] transmit graphic drawing instructions from servers to clients and leave clients to render the graphics themselves. In contrast, the image-based systems [5, 6, 8] stream rendered game screens as real-time videos. Typically, instruction-based systems consume less bandwidth, as they only send graphics drawing commands whenever needed. On the other hand, the thin clients of image-based systems are more platform- and implementation-independent and demand for less client resources, because all the rendering tasks are performed at servers. To the best of our knowledge, all the current commercial cloud gaming platforms, such as OnLive, StreamMyGame, Ubitus, and GaiKai, are image-based systems.
This paper proposes a measurement approach for image-based cloud gaming systems. The approach works even if the systems are closed and the servers and games cannot be instrumented, which are true for commercial cloud gaming services such as OnLive. The first open cloud gaming system did not appear until 2013: Huang et al. [8] proposed GamingAnywhere and adopted the measurement techniques proposed in the current article to show that GamingAnywhere outperforms proprietary and closed cloud gaming systems. The current paper presents the detailed measurement techniques, concentrates on the comparisons among commercial cloud gaming systems, and conducts in-depth experimental studies with a wider spectrum of games.
B. Measuring the QoS of Real-Time Remote Graphical Applications
Nieh and Laih [9, 10] proposed an approach to evaluate the QoS of several thin client systems on various tasks using slow-motion benchmarking. Unfortunately, this technique cannot be applied to cloud gaming systems because games would have to be modified so that they can run in slow motion. Besides, the QoS metrics used, such as the amount of data transferred, do not accurately assess the temporal and spatial quality of cloud gaming systems.
Wong and Seltzer [11] evaluated the performance of Windows NT Terminal Service when serving multi-user accesses. They focused on the server’s usage in terms of the processor, memory, and network bandwidth. They also measured the latency introduced by the scarcity of servers’ resources. In addition, Packard and Gettys [12] analyzed network traffic between an X client and server under a variety of network conditions. They evaluated the effectiveness of compressors for X protocol streams sent over high-latency links. Their results indicate that when the network delay is longer than 100 ms, an ssh tunnel performs better than the LBX compressed stream in terms of compression efficiency.
Tolia et al. [13] quantified the user-perceived latency when using a number of applications over VNC [14], a popular open-source, cross-platform thin client. They found that when using GIMP via VNC over a network connection with 100 Mbps bandwidth and 100 ms Round-Trip Time (RTT), the input response is longer than 150 ms with a probability of 29%. In contrast, the probability the input response time longer than150 ms is merely 1% when the network RTT is as short as 1 ms. Lagar-Cavilla et al. [15] also showed that the network latency can negatively impact the interactivity of VNC. Their study revealed that over an100 Mbps network connection, the frame rate of VNC drops significantly if there is a 33 ms network RTT and causes jerky interactions. More recently, Chang et al.’s [16] methodology to study the performance of games on remote desktop software has been employed to evaluate several popular thin clients, including LogMeIn, TeamViewer, and UltraVNC. Chang et al. established that player performance and Quality-of-Experience (QoE) depend on video quality and frame rates. It is observed that the mainstream thin clients cannot support cloud games given that the achieved frame rate is as low as 9.7 fps [16]. In addition, Lee et al. [17] evaluates whether computer games are equally suitable to the cloud gaming setting and finds that some games are more “compatible” with cloud gaming than others.
In contrast to the previous measurement studies on generic thin client systems [9–13], quantifying the QoS of cloud gaming systems is much more challenging, as these systems have more strict QoS requirements and are often proprietary and closed. Claypool et al. [18] conducted an extensive traffic analysis using the well-known OnLive service. In particular, they compared the network traffic imposed by OnLive against that of traditional online games and live video. They also studied how OnLive adapts to different network conditions and whether game categories affect the network traffic characteristics.
This article follows our previous work [19] and completes [18] by proposing a systematic approach to quantify component-wise latency and graphic quality of cloud gaming systems, while our (independently done) network traffic analysis results in observations that are inline with their detailed analysis.
TABLE I
GAMESSELECTED FORMEASUREMENTS
Category Shorthand Game Title Release Date Publisher
Action-adventure (ACT)
Batman LEGO Batman: The Videogame Sep 23, 2008 Warner Bros. Interactive Entertainment
Braid Braid Apr 10, 2009 Number None, Inc
Conviction Tom Clancy’s Splinter Cell: Conviction Apr 13, 2010 Ubisoft Tomb Tomb Raider: Underworld Nov 18, 2008 Eidos Interactive
First-person shooter (FPS)
BioShock BioShock Aug 21, 2007 2K Games
FEAR F.E.A.R. 2: Project Origin Feb 10, 2009 Warner Bros. Interactive Entertainment
Nukem Duke Nukem Forever Jun 14, 2011 2K Games
Real-time strategy (RTS)
DOW Warhammer 40,000: Dawn of War II Feb 19, 2009 THQ
Rome Grand Ages: Rome Mar 17, 2009 Kalypso Media
Tropico Tropico 3 Oct 20, 2009 Kalypso Media
III. MEASUREMENTSETUP
In this section, we introduce sample cloud gaming systems for measurements, which are OnLive and StreamMyGame (SMG). We then give the details on the measurement setup.
A. Sample Cloud Gaming Systems for Measurements
OnLive was introduced at the Game Developer’s Conference in 2009, released in June, 2010, and supports 306 games as of July 2012. OnLive is a well-known cloud gaming service with high-profile investors and partners, including Warner Bros, AT&T, Ubisoft, Atari, and HTC. OnLive’s clients are available on Microsoft Windows, Mac OS X1, and TV set-top box. The minimum bandwidth requirement for OnLive is 3 Mbps, but an Internet connection of 5 Mbps or faster is recommended. All the games are delivered in HDTV 720p format.
SMG enables each user to set up a game server for remote game playing. That is, users install SMG and their games on their own PCs, and play the games with thin clients over the Internet anywhere, anytime. SMG was launched in October 2007 and supports 128 games from Window-based server to Windows/Linux-based clients as of February 2012. It supports various resolutions between 320x240 to 1920x1080 (1080p) and requires an Internet access between 256 Kbps (320x240) and 30 Mbps (1080p).
Our measurement techniques quantify the QoS of OnLive and SMG by monitoring the actual game play. To obtain the results without bias, we choose heterogeneous and popular games for measurements as follows. GameStats [20] is an online media and service website, which provides the latest game
1Since February 2011, OnLive supports Apple iPad, but it only allows users to watch other users’ game play as spectators.
information and allows users to submit their opinions for the games. Most (about57%) of the GameStats opinions are related to three game categories: action-adventure (ACT), first-person shooter (FPS), and real-time strategy (RTS). More than half of the games available on OnLive and SMG belong to these three categories: 180 out of 306 games for OnLive and 67 out of 128 games for SMG. Moreover, ACT, FPS, and RTS impose different workload on the cloud gaming systems and dictate diverse quality of service requirements for enjoyable game play [1, 21]. For example, FPS games normally require high responsiveness, while producing less complex game scenes; comparatively, RTS games produce the most complex game scene while their users can tolerate higher latency [1, 21]. The requirements of ACT games in game screen updates, latency, and scene complexity tend to lie between those of FPS and RTS games [1, 21]. To cover a wide range of diverse games, we select at least three games from each category for the measurements. The details of the chosen games are given in Table I.
B. Network Setup
Figure 2 illustrates the network topology for our experiments, which consists of two servers, a router, and a client. The OnLive server (both the hardware and software) is operated by OnLive Inc. in their own data centers. The SMG server developed by Tenomichi/SSP Ltd. is installed and hosted on one of our PCs. We run both OnLive and SMG clients on the same PC, which is connected to the OnLive server via the Internet and to the SMG server in a Fast Ethernet LAN. All the network traffic goes through a FreeBSD 7.0 router running dummynet to emulate network quality degradations between the client and server, e.g., by incurring additional delay, delay variance, packet loss, and bandwidth limit, whenever needed.
Hereafter, “the server” refers to the SMG server hosted in our LAN for SMG measurements and the OnLive server connected through the Internet for OnLive measurements. All our hosts (the clients and the SMG server) are PCs with Intel Core i7-920 processors at 2.67GHz running Microsoft Windows 7.
For fair comparisons, we configure both OnLive and SMG to stream at a resolution of 1280x720 (720p) for all experiments unless otherwise specified.
Since the OnLive server is outside our LAN, the quality of the network path between our client and the OnLive server might affect our measurement results. Fortunately, we observed that the quality of the Internet path was consistently good throughout our experiments. In particular, the network delay of the path was around 130 ms with only few fluctuations. The standard deviations of the RTT were mostly less than 5 ms for 100 back-to-back ICMP ping measurements with 1 Hz sampling frequency. The path capacity allows OnLive to transmit5 Mbps of gaming content to our client without any noticeable raise
Uplink Bit Rate (Mbps) 00.0350.07 Batman Conviction Tomb BioShock FEAR Nukem DOW Rome Tropico Batman Conviction Tomb BioShock FEAR Nukem DOW Rome Tropico Uplink Packet Rate (pkt/sec) 0306090 Batman Conviction Tomb BioShock FEAR Nukem DOW Rome Tropico Batman Conviction Tomb BioShock FEAR Nukem DOW Rome Tropico Uplink Payload Size (bytes) 0306090120 Batman Conviction Tomb BioShock FEAR Nukem DOW Rome Tropico Batman Conviction Tomb BioShock FEAR Nukem DOW Rome Tropico
Downlink Bit Rate (Mbps) 061218 Batman Conviction Tomb BioShock FEAR Nukem DOW Rome Tropico Batman Conviction Tomb BioShock FEAR Nukem DOW Rome Tropico
ACT FPS RTS
Downlink Packet Rate (pkt/sec) 050010001500 Batman Conviction Tomb BioShock FEAR Nukem DOW Rome Tropico Batman Conviction Tomb BioShock FEAR Nukem DOW Rome Tropico
OnLive SMG
Downlink Payload Size (bytes) 050010001500 Batman Conviction Tomb BioShock FEAR Nukem DOW Rome Tropico Batman Conviction Tomb BioShock FEAR Nukem DOW Rome Tropico
Fig. 3. Traffic characteristics of OnLive and StreamMyGame.
of packet loss. The ICMP ping measurements taken at 1 Hz during all the OnLive experiments showed that the overall packet loss rate was less than 10−6. Therefore, the path between the OnLive server and our client is essentially a communication channel with sufficient bandwidth, zero packet loss, and a130 ms constant latency. In Section V, we will show that our measurement techniques are immune to network delay between the client and the server as long as the delay variance is small.
IV. TRAFFICANALYSIS
In this section, we collect and analyze the traffic of playing different games on two cloud gaming systems.
A. Trace Collection
To collect network traffic for analysis, an experienced game player was asked to play the considered games using OnLive and SMG clients. We ran tcpdump on the FreeBSD server (see Figure 2) to record all the packets between the client and server. Each game session lasted 10 minutes, and a total of three hours of tcpdump traces from the 2x9 system-game pairs were collected. Since users’ actions and scene complexity may affect the traffic characteristics significantly [1], we asked the user to follow the
guidelines: 1) move across as many scenes as possible while fighting opponents as required in regular game play and 2) repeat his actions and visit the same scenes as much as possible when playing a game on both cloud gaming systems.
B. Traffic Characteristics
Figure 3 plots the average bandwidth, packet rate, and payload size with 95% confidence bands of all considered games and cloud gaming systems. The uplink and downlink figures present the characteristics of the client traffic and the server traffic respectively. To determine whether the bandwidth consumption is game- or system-dependent, we calculate the rank correlation of the bandwidth used by individual games among different cloud gaming systems with Kendall’s tau coefficients. For uplink bit rates, the rank correlation of0.67 shows that the client traffic is game-dependent. For example, the uplink bit rates of Batman is much lower than the other games in both cloud gaming systems. We believe this is due to that Batman is controlled only by keyboard while the other games are controlled by both keyboard and mouse, therefore the uplink bit rates of Batman is lower than the other games.
For the downlink bit rates, the rank correlation of 0.05 indicates that the server’s outgoing traffic is not dependent on games. The downlink bandwidth of OnLive varies between 3 Mbps and 5 Mbps, and that of SMG varies between 9 Mbps and 18 Mbps. This shows that OnLive incurs less server traffic than SMG, and the server traffic is system-dependent. Furthermore, the downlink bit rates are almost two orders of magnitude higher than the uplink bit rates, and thus the bandwidth efficiency of cloud gaming systems is primarily determined by server traffic. Overall, OnLive is more bandwidth-efficient than SMG.
Furthermore, SMG’s downlink payload size is similar across games, whereas OnLive’s downlink payload size varies across games. A closer look indicates that most of the packets sent by SMG server are around 1400 bytes, which shows that SMG server tends to aggregate small packets for maximal payload length. This allows SMG to reduce the header overhead at the expense of longer latency. In summary, comparatively, we found that the client traffic is game-dependent, while the server traffic is rather system- dependent.
Last, we notice that although our measurements were conducted independently to Claypool et al. [18], our observations on OnLive are inline with theirs. In particular, we found that: (i) the downlink bit rates are in the range of 3 to 5 Mbps, (ii) the downlink packet sizes are slightly smaller than 1000 bytes, and (iii) OnLive traffic is very asymmetric: the downlink bit rate is about 70x higher than uplink bit rate, the downlink packet rate is about 9x higher than uplink packet rate, and the downlink payload size is 8x than uplink payload size.
V. QUANTIFYINGRESPONSIVENESS
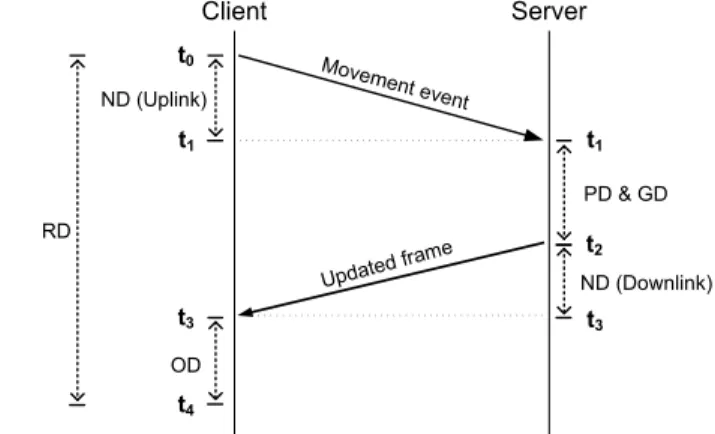
We propose a set of measurement techniques to quantify the responsiveness in this section. Re- sponsiveness is the most critical user-perceived QoS metric for cloud gaming systems. We define the Response Delay (RD) as the time duration between a user submitting his/her command and the time the corresponding game frame is displayed to the user. RD directly affects the user’s performance and gaming experience [1]. Although RD can be explicitly measured when running games on a standalone PC, measuring RD in a cloud gaming system is much more complicated because it comprises multiple components. We divide the RD of a cloud gaming system into the following four components.
• Network delay (ND): ND represents the time required to transmit a user’s command to the server and a game screen back to the client. It is essentially the network RTT.
• Processing delay (PD): PD represents the time required for the cloud gaming server to receive and process a user’s command, and to encode and packetize the corresponding frame for the client.
• Game delay (GD): GD represents the time required by the game software to process a user’s command and render the next game frame that contains responses to the command.
• Playout delay (OD): OD represents the time for the client to receive, decode, and display a frame.
RD equals the sum of all the delays described above, i.e.:
RD= ND + PD + GD + OD. (1)
Among all the delays, ND can be measured with tools like ICMP ping, and GD is game-dependent. In this work, we assume that GD does not change while a game is customized for a cloud gaming system;
therefore, GD of individual games can be measured from the PC versions of the games. Measuring the PD (at the server) and OD (at the client) is not straightforward because PD and OD occur internally in cloud gaming systems, and may not be accessible from outside. Hence, special attentions are needed to measure the PD and OD components.
In the rest of this section, we will describe how RD of a cloud gaming system is measured in Section V-A and report the GDs of the considered games in Section V-B. Lastly, in Section V-C, the techniques to accurately decompose PD and OD from RD and the results will be presented.
A. Response Delay Measurement
To measure the RDs of a cloud gaming system, we exploit the fact that most games support a movement event which changes the game scene immediately during game play. The movement event is usually a keystroke moving the avatar in ACT games or a mouse wheel scroll changing the viewpoints in RTS and
t0(Movement event sent) t1(Movement event received)
t2(Frame sent) t3(Frame received)
Client Server
Updated frame t4(Frame displayed)
Movement event
Fig. 4. The procedure of measuring response delay by sending a movement event.
Client Server
t0
t1
t2
t3
t4
Movement event
Updated frame t1
t3 PD & GD
OD
ND (Downlink) ND (Uplink)
RD
Fig. 5. Decomposition of response delay.
TABLE II
RESPONSE DELAY OF DIVERSE GAMES ON DIFFERENT CLOUD GAMING SYSTEMS
Batman Conviction Tomb BioShock FEAR Nukem DOW Rome Tropico
OnLive RD 399ms 402ms 333ms 332ms 288ms 351ms 358ms 377ms 290ms ND 131ms 130ms 131ms 131ms 131ms 131ms 130ms 132ms 131ms
SMG RD 502ms 553ms 454ms 405ms 397ms 424ms 402ms 407ms 420ms
ND < 1 ms
FPS games. Figure 4 illustrates how we measure the RD of a cloud gaming system. First, a movement event is fired on the client at time t0. We assume that the server receives the event at time t1, processes the event, and sends the encoded frame to the client at time t2. The client receives the frame at time t3, and we observe the game screen updated at time t4. As Figure 5 shows, RD equals (t4− t0), i.e., the time duration between t0 and t4. Within RD, ND equals the sum of(t1− t0) and (t3− t2). Moreover (t2− t1) is composed of PD and GD, and (t4− t3) equals to OD.
To determine RD, i.e., to measure (t4− t0), we utilize the hooking mechanism2 in Windows to inject our instrumentation code into the OnLive and SMG clients. The detours [22] library is adopted to intercept the following two functions:
1) IDirect3dDevice9::EndScene(): The OnLive client calls this function when it finishes
2The Windows hooking mechanism is invoked by calling the SetWindowsHookEx function. It is frequently used to inject code into other processes.
Game Delay (ms) 126
135 50
33 17
58 16 14 29
0 20 40 60 80 100 120 140 160
Batman Conviction Tomb BioShock FEAR Nukem DOW Rome Tropico
ACT FPS RTS
Fig. 6. Game delays of the PC versions of the considered games.
drawing a frame in the background and is ready to display the frame on the screen.
2) IDirect3DSurface9::UnlockRect(): The SMG client calls this function when it finishes drawing a frame and is ready to display the frame on the screen.
After hooking the functions, the following steps are taken to measure the response delay:
1) Simulate a movement event by calling the SendInput() function at time t0.
2) Each time the game screen is updated, we monitor a specific set of pixels to determine if the game scene is changed.
3) Wait until the scene changes and note the time as t4.
As t4 is measured, the RD corresponding to the movement event can be calculated by subtracting t0
from t4. The procedure repeats many times for each game on each cloud gaming system to obtain RD samples. Besides, along with RD measurement, ND samples are also measured using ICMP pings. The average RDs and NDs of different games on cloud gaming systems are shown in Table II. In particular, the RDs vary between 290–400 ms for OnLive and 400–550 ms for SMG. The distance between the server and client results in a 130 ms ND for OnLive while the NDs for SMG among all the games are negligible (less than 1 ms), since both SMG server and client are in the same LAN.
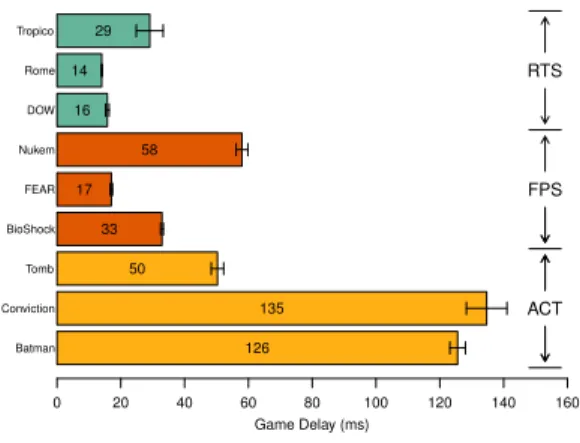
B. Game Delay Measurement
GD is comprised of several parts. The first part is the processing time required for a game software to process input commands and to render the corresponding frames. The second part is decided by the interval of the main loop of games, as most games process users’ commands at regular intervals, say, every 20 ms. Besides, some games may intentionally introduce additional delays to pacify users’ control
actions. GD occurs in games internally and cannot being directly observed outside.
We measure GDs of individual games using their PC versions. We make two assumptions. First, we assume that the cloud gaming systems provide sufficient computational power for the games. Second, we assume that the design of main loop and intentional delays of each game remain intact when the game is customized for cloud gaming systems. These two assumptions guarantee that the GDs measured on a PC approximate the actual GDs on cloud gaming systems.
For SMG measurements, the assumptions are certainly valid because the configuration of the SMG server and the games installed on it are under our control. For OnLive measurements, these assumptions are reasonable for two reasons. First, the cloud gaming providers usually adopt high-end hosts for game streaming to guarantee the quality of experience. Second, as the mechanism of game delay is irrelevant to real-time streaming, it is unlikely to be changed significantly for cloud gaming systems.
Under the assumptions, the GDs of the considered games are measured by applying the function hooking technique described in Section V-A. The movement events and the selected game scenes are identical to those in the RD measurements. We repeat the measurements 100 times for each game, and plot the average GDs with95% confidence bands in Figure 6. The narrow confidence bands indicate that our measurements are reliable.
C. Decomposing Processing Delay and Playout Delay
Since we know how to measure RD, ND, and GD, we can derive PD and OD by determining either one of them. We propose a novel technique to estimate t3 (shown in Figure 5). After t3 is determined, OD can be calculated, and PD can be consequently derived.
The rationale behind estimating t3 is that it is the time the updated game frame entered into the client from the server. Thus, if the incoming data is (intentionally) blocked on the client before t3, the updated frame is not shown until the blocking is cancelled. On the other hand, if the incoming data is blocked after t3, the updated frame is displayed despite that no further frames can be received and shown on the screen as long as the blocking sustains.
To facilitate incoming data (i.e., packets) blocking, we hook the Winsock function recvfrom(), which is invoked when the clients attempt to retrieve a UDP datagram from the UDP/IP stack. Instead of one single packet, an encoded video frame is usually composed of hundreds or even thousands of packets. When the function recvfrom() is blocked, the first packet being blocked (from being read by the client) may correspond to the first, middle, or last of the packets associated with a game screen.
Thus, to ensure the accuracy of t3 determination, we start to block this function only immediately after
200 220 240 260 280 300 320
050100150
Batman on OnLive
Elapsed time (ms)
Iteration
200 250 300 350
0204060
Conviction on OnLive
Elapsed time (ms)
Iteration
100 140 180 220
020406080
Tomb on OnLive
Elapsed time (ms)
Iteration
120 160 200 240
020406080 BioShock on OnLive
Elapsed time (ms)
Iteration
50 100 150 200
020406080
FEAR on OnLive
Elapsed time (ms)
Iteration
120 160 200 240
020406080 Nukem on OnLive
Elapsed time (ms)
Iteration
150 200 250 300
020406080
DOW on OnLive
Elapsed time (ms)
Iteration
150 200 250 300
0204060
Rome on OnLive
Elapsed time (ms)
Iteration
100 150 200
020406080 Tropico on OnLive
Elapsed time (ms)
Iteration
Fig. 7. OnLive’s scatter plots of tblock succeeded (red crosses) and tblock f ailed (blue circles) samples. The vertical dashed line denotes the estimation of t3. Note that ND has been subtracted from the measurements.
450 500 550
0204060
Batman on SMG
Elapsed time (ms)
Iteration
460 500 540 580
020406080
Conviction on SMG
Elapsed time (ms)
Iteration
400 420 440 460 480
0204060
Tomb on SMG
Elapsed time (ms)
Iteration
320 360 400 440
020406080
BioShock on SMG
Elapsed time (ms)
Iteration
320 340 360 380 400
050100150
FEAR on SMG
Elapsed time (ms)
Iteration
350 400 450
020406080
Nukem on SMG
Elapsed time (ms)
Iteration
320 360 400 440
050100150
DOW on SMG
Elapsed time (ms)
Iteration
300 350 400 450
02060100
Rome on SMG
Elapsed time (ms)
Iteration
300 350 400 450
020406080
Tropico on SMG
Elapsed time (ms)
Iteration
Fig. 8. StreamMyGame’s scatter plots of tblock succeeded (red crosses) and tblock f ailed (blue circles) samples. The vertical dashed line denotes the estimation of t3.
a game screen is rendered. The measurement procedure is as follows.
1) Call the function SendInput() at time t0 to invoke a movement event. With the assumption that OD is shorter than100 ms, compute tblock as a random time between RD −100 ms and RD + 50
OnLive
Response Delay (with ND subtracted) 0100200300400500600 (ms) Batman Conviction Tomb BioShock FEAR Nukem DOW Rome Tropico
118 113 119 145 110 142
191 204 105
24 25 33
22 31
20
21 27
25 126 135
50 33 17
58 16
14
29 Processing Delay
Playout Delay Game Delay
ACT FPS RTS
SMG
Response Delay (with ND subtracted) 0100200300400500600 (ms) Batman Conviction Tomb BioShock FEAR Nukem DOW Rome Tropico
350 383 380 351 362
332 365 364 364 26
36 23
21 18
34
21 29 27
126 135
50
33 17 58 16 14 29
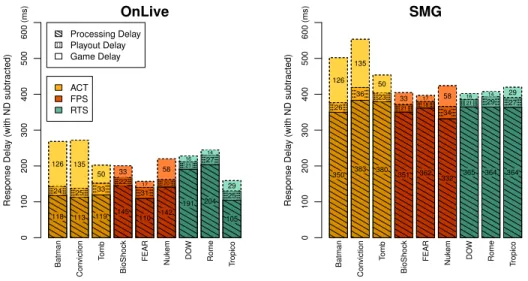
Fig. 9. The estimated game, processing, and playout delays of the considered games on two cloud gaming systems.
TABLE III
PDS ANDODS OF THE CONSIDERED GAMES ON THE TWO CLOUD GAMING SYSTEMS
Batman Conviction Tomb BioShock FEAR Nukem DOW Rome Tropico
OnLive PD (mean / sd.) 118/2.4 ms 113/1.6 ms 119/2 ms 145/2.7 ms 110/1.8 ms 142/1.7 ms 191/2.1 ms 204/5 ms 105/3.8 ms OD (mean / sd.) 24/3.7 ms 25/4.3 ms 33/2.4 ms 22/3 ms 31/2.1 ms 20/1.3 ms 21/2.2 ms 27/3.9 ms 25/4 ms
SMG PD (mean / sd.) 350/2.4 ms 383/1.6 ms 380/4.3 ms 351/1.3 ms 362/0.8 ms 332/3.9 ms 365/0.9 ms 364/2.2 ms 364/1.8 ms OD (mean / sd.) 26/2.9 ms 36/1.9 ms 23/4.2 ms 21/2.2 ms 18/1.8 ms 34/3.9 ms 21/1.5 ms 29/3.8 ms 27/1.8 ms
ms3.
2) If the updated frame appears before tblock, record the time as tupdate and terminate the procedure.
Otherwise, temporarily block all the subsequent recvfrom() calls for one second4 at tblock. 3) Wait until the updated frame appears, record the time as tupdate, and terminate the procedure.
The blocking sustains from tblockto tblock+1 sec, and is considered successful if tupdate> tblock+1 sec.
In this case, t3 should be some time after tblock, and tblock is added to the record named tblock succeeded. On the other hand, if tupdate ≤ tblock, the blocking is considered failed and t3 must be some time before tupdate. In this case, tupdate is added to the record named tblock f ailed. By repeating the procedure numerous times, tblock succeeded and tblock f ailed contain sample points before and after t3 respectively,
3The 50-ms interval is chosen arbitrarily in order to leave a “safe zone” that ensures an updated frame will be blocked with a non-zero probability.
4The one-second interval is chosen arbitrarily in order to determine whether or not the updated frame is blocked. Other values can also apply without affecting the measurement results.
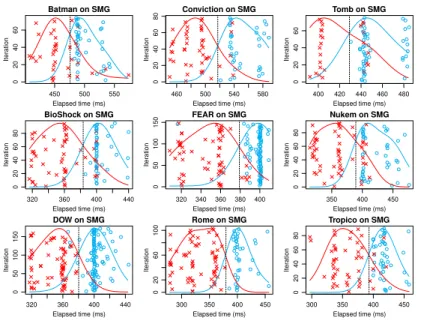
and t3 lies approximately at the boundary of the two groups. t3 is then estimated as the point yielding the minimum sum of the two density functions formed by tblock succeeded and tblock f ailed respectively, where each density function is computed as the mixture of the Gaussian density functions centered at each element with a standard deviation of a reasonable magnitude5. By estimating t3, OD can be computed as t4− t3, and PD is derived as t3− t0−ND − GD.
Figures 7 and 8 show the scatter plots of tblock succeeded and tblock f ailed samples. The time points in tblock succeeded and tblock f ailed are denoted with red crosses and blue circles respectively. The NDs have been excluded from all the samples for a fair comparison between OnLive and SMG. We make an observation that the samples gathered from OnLive are normally distributed while those of SMG are aggregated around certain values. A closer look indicates that SMG tends to maintain its frame rate at 25 fps (frames per second), and therefore the inter-frame time of SMG is fixed at 40 ms. Since tblockand tupdate can only be obtained whenever a frame is presented on the screen, they tend to cluster around points with 40-ms intervals.
Moreover, because t3 (and consequently PD and OD) are inferred based on a set of iterations, the robustness of our estimation of t3 can be checked by cross-validation. Instead of using the samples from all the iterations, 50 iterations are randomly selected from all the iterations to estimate t3. 10 rounds of the estimation are made, and the results from different rounds are compared to show the robustness of our measurement techniques. The mean values and standard deviations of PD and OD of the two cloud gaming systems are summarized in Table III. The standard deviations of our estimation in PD and OD are all smaller than 5 ms, which indicates that our estimations are reliable without suffering from significant measurement noises.
D. Results of Responsiveness Measurements
Figure 9 shows the averages of PD, OD, and GD of the considered games on OnLive and SMG6. This figure shows that OnLive’s PDs are about half of those of SMG. This can be partly attributed to the multi-tiled7 and the hardware-accelerated video encoder used by OnLive [23]. The average ODs of
5In our experiment, a standard deviation of 20 ms is adopted, while other values of the same order of magnitude yield nearly identical estimation of t3.
6Since network delay (ND) is independent to the cloud gaming systems, we exclude it from the following discussion.
7The multi-tile technique is similar to the intra-refresh coding used in some H.264 codec implementations, such as x264 (http://www.videolan.org/developers/x264.html).
both cloud gaming systems are around18–36 ms with limited differences among games. Such short ODs indicate that both systems perform equally well in frame decoding and display.
In summary, OnLive’s overall streaming delay (i.e., PD at the server and OD at the client) is 130–230 ms. On the other hand, real-time encoding of 720p game screen seems to be a large burden for SMG on an Intel i7-920 server because the streaming delay measured on SMG can be as long as360–420 ms. It is reported that FPS players expect latency less than 100 ms for acceptable players’ performance; sports and role playing game players demand for less than 500 ms; while RTS and simulation game players dictate less than 1000 ms [21]. Both cloud gaming systems may fail to satisfy FPS players; however, with insignificant network delays, OnLive may satisfy the needs of most users of the other game categories while SMG might be only marginal or even unacceptable for certain games.
VI. IMPACT OFSYSTEMDESIGN ANDPARAMETERS ONRESPONSIVENESS
In this section, we study how the scene complexity, update region size, screen resolution, and computational power of servers affect the responsiveness of cloud gaming systems. For fair comparisons between OnLive and SMG, we deduct network delays (ND) from all the figures reported.
A. Impact of Scene Complexity
Figure 9 shows that the PDs of DOW and Rome, both are omnipresent RTS games, are higher than those of the other games on OnLive8. This can be attributed to the highly complex game scenes of DOW and Rome, which take longer to be encoded and transmitted [1].
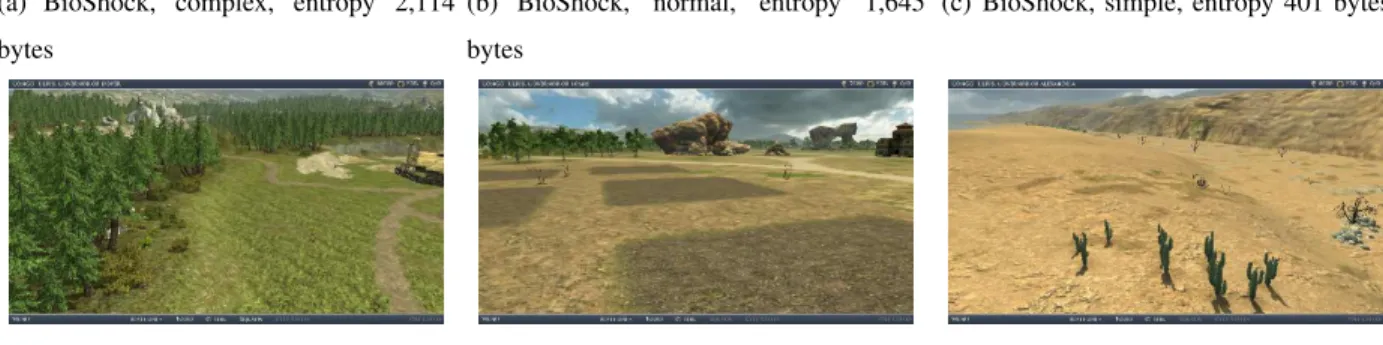
To quantify the scene complexity, we define entropy as the average frame size after compressing a raw video with a set of fixed, typical coding parameters. In particular, we use Fraps9 to capture game scenes and encode them into H.264 video files. We then divide the file size by the number of frames to derive the entropy. To cover a wide range of scene complexity, we consider two games, Rome and BioShock, and choose three scenes with different complexity levels: complex, normal, and simple. We record a one-minute video for each scene, and report the resulting entropy in Figure 10. This figure gives the screenshots and entropy of each scene, which reveals that the entropy drops from high to low complexity levels, while entropy of BioShock is much lower than that of DOW.
We plot the RDs of all the considered scenes in Figure 11. This figure shows that complex scenes indeed result in higher PDs and ODs, in both games. We then present the correlation between the entropy
8The PDs of SMG are equally long across all considered games. Hence we only analyze results from OnLive here.
9http://www.fraps.com/
(a) BioShock, complex, entropy 2,114 bytes
(b) BioShock, normal, entropy 1,645 bytes
(c) BioShock, simple, entropy 401 bytes
(d) Rome, complex, entropy 2,877 bytes (e) Rome, normal, entropy 2,760 bytes (f) Rome, simple, entropy 2,322 bytes
Fig. 10. The screenshots of the considered game scenes with different scene complexity (entropy).
Complex Normal Simple
BioShock
Response Delay (with ND subtracted) 050100150200250 (ms)
142 129 120
30 22
19
33
33 33
Processing Delay Playout Delay Game Delay
Complex Normal Simple
Rome
Response Delay (with ND subtracted) 050100150200250 (ms)
241 235
188
26 23
18 14
14
14
Fig. 11. Response delays (without ND) of different scenes of BioShock and Rome.
500 1000 1500 2000 2500 3000
120140160180200220240
Entropy (bytes)
Processing Delay (ms)
BioShock (Complex) BioShock (Normal) BioShock (Simple) Rome (Complex) Rome (Normal) Rome (Simple)
500 1000 1500 2000 2500 3000
18202224262830
Entropy (bytes)
Playout Delay (ms)
Fig. 12. The correlation between the entropy and the processing and playout delay.
and PD/OD in Figure 12. This figure reveals a game-independent positive correlation between entropy and PD/OD. In summary, the scene complexity affects the processing, encoding, and decoding time in OnLive. Last, we note that our empirically observed relation between game category and scene complexity is consistent with Claypool [1], e.g., RTS games generally have higher scene complexity.
B. Impact of Update Region Sizes
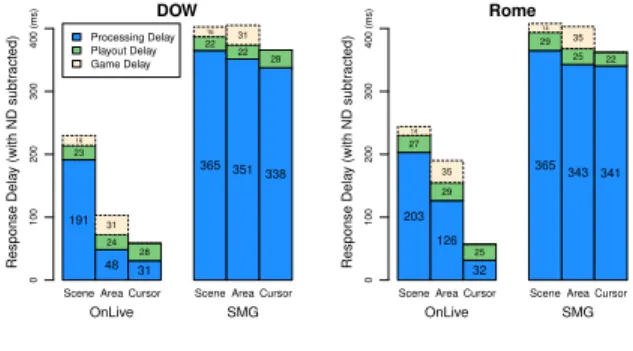
We next study how the sizes of update regions affect the responsiveness. We consider two games, DOW and Rome, on both OnLive and SMG. We perform three game actions to generate different sizes
DOW
Rome
Press the key “F9”
to invoke the area Press the key “1"
to invoke the area
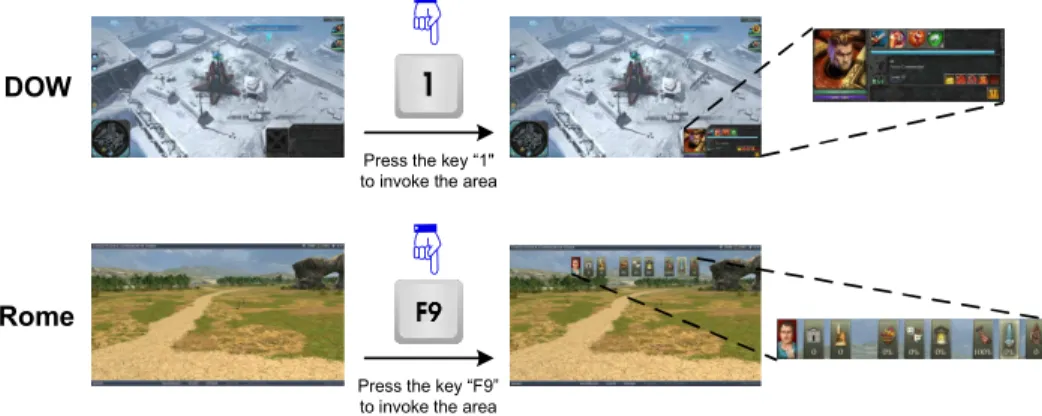
Fig. 13. Screenshots of area changes triggered by keystrokes in DOW and Rome.
of update regions.
1) Scene change: A mouse movement rotates the view point. The responsiveness of a scene change is defined as the time duration between the mouse movement and the screen rotation.
2) Area change: A keystroke to show and hide specific GUI components. Figure 13 illustrates the screenshots of area changes in DOW and Rome, where about 7% of the screen is affected by the area changes in both games. The responsiveness of an area change is defined as the time duration between pressing the key and changing the pixels in the updated area.
3) Cursor movement: Move the mouse cursor across the screen. The responsiveness of a curve movement is defined as the time between the mouse movement action and the actual cursor movement on screen.
We plot the RDs of DOW and Rome with different sizes of update regions in Figure 14. We first discuss the results from OnLive. The PDs of cursor movements are short, and those of scene changes are 6 times longer. The PDs of area changes are between those of scene changes and cursor movements. On the other hand, the PDs of Rome are higher than those of DOW assuming a common size of update regions. This can be attributed to the transparent background of the area in Rome, which is quite challenging for video codecs. Similar observations can be made on the results from SMG, although PDs from SMG are higher while the variance of PDs across different update region sizes is small. In summary, the video coder used by OnLive is more advanced in the sense that it successfully leverages the inter-frame redundancy for shorter PDs.
C. Impact of Screen Resolutions
Since OnLive only supports 720p resolution, we only study how screen resolutions affect the responsiveness of SMG. We select two games: FEAR and Tomb, and choose three resolutions: 1280x720, 1024x768, and 640x480. We configure the games and SMG to use the same resolution to avoid any unnecessary up/down-sampling. We plot the RDs of all games and resolutions in Figure 15. This figure shows that smaller resolutions lead to shorter PDs, which is inline with the intuition. However, the difference of PDs is negligible, e.g., only 5% between 640x480 and 1280x720 in FEAR. Moreover, we see no consistent correlation between resolutions and ODs. These two observations indicate that some common processing overhead of SMG dominates the responsiveness, so that the impact of resolutions on RDs is minimal.
D. Impact of Computation Power
We study the impact of the server computation power on the responsiveness of SMG. We do not consider OnLive because we have no access to OnLive servers. We set up four SMG servers with different CPUs: 1) Intel Core i7-920 2.6GHz, 2) Intel Core i5-760 2.8GHz, 3) Intel Core 2 Quad Q6600 2.4GHz, and 4) AMD Athlon 64 4200+ 2.2GHz. We configure the four servers to have the same memory size, disk model, and graphics card (NVIDIA GeForce GTX 275 with 896 MB video RAM). We use FEAR in this study.
We rank the computational power of the CPUs using PassMark10, a popular benchmark index provided by the PerformanceTest software. The benchmark scores indicate that Intel Core i7-920 is the most powerful CPU, Intel Core i5-760 is the second, Intel Core 2 Quad Q6600 is the third, and AMD Athlon 64 4200+ is the least. We plot the PDs corresponding to different CPUs, and the correlation between the PDs and the CPU benchmark scores in Figure 16. This figure shows that: 1) PD linearly decreases on the less powerful servers and 2) there is a linear correlation between PD and benchmark score.
VII. QUANTIFYINGSTREAMINGQUALITY
In this section, we quantify the game streaming quality of OnLive and SMG via measuring the frame rate and graphic quality under various network conditions.
10http://www.cpubenchmark.net/high end cpus.html