行政院國家科學委員會專題研究計畫 成果報告
資料探勘在微晶片基因表現數據分析之應用
計畫類別: 個別型計畫
計畫編號: NSC91-2213-E-011-116-
執行期間: 91 年 08 月 01 日至 92 年 07 月 31 日 執行單位: 國立臺灣科技大學資訊工程系
計畫主持人: 李育杰
計畫參與人員: 駱宏毅,張守智,趙嘉煌
報告類型: 精簡報告
處理方式: 本計畫可公開查詢
中 華 民 國 92 年 10 月 30 日
行政院國家科學委員會補助專題研究計畫成果報告
資料探勘在微晶片基因表現數據分析之應用
(Data Mining Application in Microarray Gene Expression Data Analysis)
計畫類別: ▓ 個別型計畫 □ 整合型計畫
計畫編號: NSC 91 – 2213 – E – 011 – 116 執行期間: 91 / 08 / 01 ~ 92 / 07 / 31
計畫主持人: 李育杰 教授 國立台灣科技大學資訊工程學系
計畫參與人員: 駱宏毅 兼任助理 國立台灣科技大學資訊工程學系 張守智 兼任助理 國立台灣科技大學資訊工程學系 趙嘉煌 兼任助理 國立台灣科技大學資訊工程學系
執行單位:國立台灣科技大學資訊工程學系
中華民國 九十二 年 十 月 二十 日
1
行政院國家科學委員會專題研究計畫成果報告 資料探勘在微晶片基因表現數據分析之應用
(Data Mining Application in Microarray Gene Expression Data Analysis) 計畫編號:NSC 91 – 2213 – E – 011 – 116
執行期限:91 / 08 / 01 ~ 92 / 07 / 31
執行單位:國立台灣科技大學資訊工程學系
主持人:李育杰 教授 國立台灣科技大學資訊工程學系
計畫參與人員:駱宏毅 兼任助理 國立台灣科技大學資訊工程學系
張守智 兼任助理 國立台灣科技大學資訊工程學系
趙嘉煌 兼任助理 國立台灣科技大學資訊工程學系
一:中英文摘要
微陣列技術使生物學家得以在一次的 實驗中同時研究觀察數千個基因的表現行 為。如何從這些龐雜巨大的基因表現資料 中有效率地萃取出有用的生物資訊便成了 重要的研究課題,這也引起分子生物學 家、統計學家及電腦科學家的注意。近年 來,資料探勘 (data mining) 蓬勃發展正符 合這個需求。資料探勘是一個從巨大龐雜 的資料中擷取出隱藏其中有用的資訊或知 識的步驟,本計畫將利用資料探勘中處理 分 類 問 題 ( classification) 與 特 徵 選 取
(feature selection)的技術來處理微陣列 基 因 表 現 數 據 。 我 們 採 用 急 性 白 血 病
(acute leukemia)病患的微陣列基因表現 數據作為實驗的資料集,在這個資料集中 包括 72 筆急性白血病病患的資料,每個病 患有 7129 個微陣列基因表現數據值,而且 這 72 個病患被分成急性骨髓白血病(AML, acute myeloid leukemia)、T 型急性淋巴白 血 病 ( T-cell ALL, acute lymphoblastic leukemia)或 B 型急性淋巴白血病( B-cell ALL)三種不同的種類。在本計畫中我們 利用特微選取的技術從 7129 個基因中篩 選出 30 基因,並提供一個方法能夠根據病 患的這 30 微陣列基因表現數據值,將病患 正確地分到他所屬於的白血病類別。
關鍵詞:微陣列基因表現數據、資料探勘、
群集法、多元分類問題、支撐向量法 Abstract
Microarray technology makes biologists be capable of monitoring expression of
thousands of genes in a single experiment on a small chip. How to extract knowledge and information from these microarray gene expression datasets has attracted great attention of many molecular biologist, statisticians and computer scientists.
Recently, data mining has become a synonym for the process of extracting the hidden and useful information from datasets.
In this report, we developed a methodology to analyze the gene expression data by using the techniques in data mining such as feature selection and classification. We are given the leukemia microarry gene expression dataset that consists of 72 samples. Each sample has 7129 gene expression levels and comes with one of three class labels: AML, B-cell ALL and T-cell ALL. We selected 30 genes out of 7129 by using feature selection technique and prescribe a procedure to classify every sample into the correct category.
Keywords:microarray gene expression data, data mining, multicategory classification, clustering, support vector machine
二:緣由與目的
Microarray technology makes biologists be capable of monitoring expression of thousands of genes in a single experiment on a small chip. Several microarray gene expression datasets are publicly available on the Internet [14, 15].
These datasets include a large number of gene expression values and need to have an accurate method to extract knowledge and useful information from these microarray
2
gene expression datasets.
Support vector machines (SVMs) [12]
have been shown have superior performance in the analysis of microarray gene expression data than other classification algorithms such as decision trees, Parzen windows and Fisher’s linear discrimination [6, 8]. Hence we will use SVMs as the classification tool in this report.
Here we use the acute leukemia dataset the same as Golub presented in [9] for our classification experiments and convert this multicategory classification problem into a series of binary classification problems.
Besides, we propose a hierarchical model for selecting a small number of informative genes and classifying acute leukemia patients as AML, B-cell ALL or T-cell ALL class based to those selected genes. Each level of this hierarchical model is composed of two phases, gene selection step and classifier construction step. Our model selects 30 genes out of 3571 genes and can classify 34 examples into three categories, which are defined above correctly based on the training result of 38 examples.
The object of this report is to propose an efficient and powerful tool for microarray gene expression data analysis by combining the data mining techniques. In the following pages of this report, we describe the techniques we used and the experimental results. In addition, we also introduce extensions of this application.
三:結果與討論
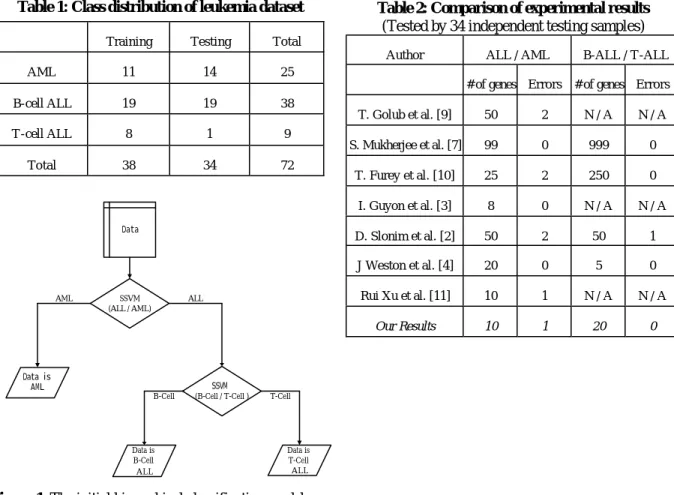
The acute leukemia dataset contains 38 training samples and 34 independent testing samples. All samples have 7129 features obtained from the microarray. Hence there is a total number of 72
×
7129 microarray gene expression data in this dataset. Each sample is labeled as AML, B-cell ALL or T-cell ALL. Therefore, the problem we faced is a multicategory classification problem. The class distribution of this dataset described as table 1.Although there are more than 7000 features for each sample, many of them are
uninformative or providing redundant information for class distinction. We need to perform some preliminary data cleaning in order to discard those uninformative genes expression data and reduce the number of features, so as to decrease the computational time in following steps. In the preliminary processing stage, we eliminate those genes whose expression values do not have significant differences in different classes.
After this preliminary processing, we still retain 3571 features for each sample.
For the sake of extracting the most informative genes for discriminating classes, we need a metric mechanism for gene selection with following property: The metric expressions of an informative gene in one class should be quite different from the other, but the variation in the same class is as little as possible [2]. We adopt a metric mechanism fit in with this property, which is presented in [9], called correlation metric
P(g
i).− +
− +
+
= −
σ σ
µ ) µ
(gi P
where gi is the expression vector of ith gene over all training samples,
µ indicates the
+ mean value of the ith gene ’s expression in positive class, andσ
+ is the standard deviation of the ith gene’s expression in positive class.µ and
−σ
− are defined for negative class in the same way.Support vector machines (SVMs) are widely used in many machine learning and data mining problems due to the superior performance in data analysis. The SVM algorithm finds classification functions by solving a convex quadratic optimization program [5, 12, 13] defined as:
ω ω
γ
υ
ω
'
2 ' 1 min
) 1, ,
( + +
+
∈
e y
m
Rn
y
0
, )
( . .
≥
≥ +
− y
e y e A D t s
ω γ
where
υ is a positive weight value for
3
controlling overfitting,
e ∈ R
m is a column vector with all ones ,A ∈ R
m×n represents data points with m samples andn features, y ∈ R
m is slack vector variable, and D is anm × m
diagonal matrix with ones or minus ones along its diagonal to specify the class label of each sample.By using smooth techniques introduced in [1, 13] and the KKT optimality conditions, the smooth support vector machine (SSVM) model [13] can be obtained as follows:
) ' 2 (
|| 1 ) ), (
( 2 ||
min
22 2) ,
( 1
υ ω γ α ω ω γ
γ
ω +
− − + +
∈
p e D A e
Rn
where
( , ) = + 1 log( 1 + ε
−), α > 0
α x α
αxx
p
isan accurate smooth approximation to plus function:
≥
= <
+ , 0
0 ,
) 0
(
x for x
x x for
This problem can be solved by the Newton-Armijo algorithm which has be shown converges globally and quadratically [13]. The solution of this problem will give us the linear classification function:
γ ω +
= ' )
( x x
f
For a new unlabeled sample x, we plug it into the classification function. If the output value
f ( x ) > 0
, we classify this sample into positive category otherwise we classify it into negative category. In our experiments, all classifiers are established based on the SSVM algorithm.The classifiers we build via SSVM algorithm are binary classifiers. Hence we have to convert this multicategory classification problem into a series of binary classification problems.
After calculating, we find that the distance between ALL (including B-cell ALL and T-cell ALL) and AML is larger
than the distance between B-cell and T-cell ALL. So, it is nature to conclude that the difference between ALL and AML is more significant than between B-cell ALL and T-cell ALL. This result consists with [2, 7, 9]
and represents that the preliminary and normalization processing without cha nging the characteristics of expression data in different categories. Then the initial hierarchical classification model was built as figure 1. There are two diamonds we can see in figure 1. Each of them represents a classification function established by SSVM with linear kernel and deals with its own classification problem.
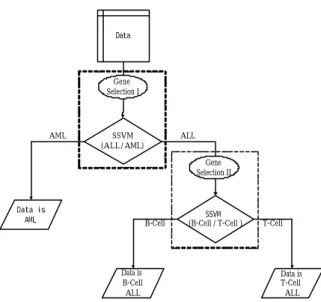
Combining with gene selection steps, we can get our hierarchical two-phase classification model, shown as figure 2. The dashed boxes are our two-phase classifiers.
In the ellipses of gene selection I and gene selection II, 10 and 20 genes out of 3571 are selected for their own classification tasks, respectively. The reasons that use 10 and 20 genes at different level are decided by accuracy, stability and robustness of SSVM classifiers built.
In testing stage, we can input data with genes sorted or unsorted. This hierarchical two-phase classification model will select genes correctly by itself at each level and classify testing data accurately.
The numeric results of our experiments and some other researchers’ are summarized in table 2. The number of genes we used here is not the smallest subset that can archive the best result. Actually, we need only 18 genes (8 for AML/ALL classifier and 10 for B-cell/T-cell classifier) to have the same results in table 2 by advanced gene selection steps. But the built classifiers are too sensitive when noise data involved, and degrading the robustness and generic ability of classifiers. Hence we intend to use more genes but build robust classifiers.
To show the selected genes for building SSVM classifiers are informative, we depicted the means of those selected genes’
expression data correspond to different classes in figure 3, 4, and 5.
4
In these figures, we can see that the means of identical gene respect to different classes are significantly dissimilar. Through these genes we can obtain sufficient information to build superior classifiers.
四:計畫成果自評
To propose an efficient and powerful method for microarray gene expression data analysis is the object of this report.
Therefore, we design a hierarchical two-phase classification model to achieve this goal and get acceptable results. We not only substantially reduce the number of genes needed from 7129 to 30, but also build classifiers with superior classification ability by using these limited informative genes.
In future works, we will apply this model to more different types of microarray gene expression datasets, more complicated kernels may be used and hope to get acceptable numeric results like in this leukemia dataset. In addition to, the function used to evaluate gene expression respect to different classes may be replaced by a more complex function instead of average function.
The final goal we hope to fulfill is making all processing steps visualized as graphs rather than only numeric computation. For example, we may use only graphs like figure 3, 4 or 5 to accomplish gene selection steps and classify unknown samples (include multicategory classify) directly according to some information get from graphs. If this object can be achieved, the time needed for analyzing microarray gene expression data will be saved further, and makes the experimental processes be more understandable.
五:參考文獻
[1] Chun-Hui Chen and O. L. Mangasarian.
“Smoothing methods for convex inequalities and linear complementarity problems”,
Mathematical programming, 71(1): 51-69,
1995.[2] D. Slonim, P. Tamayo, J. Mesirov, T.
Golub, E. Lander. “Class prediction and discovery using gene expression data”,
Fourth Annual International Conference on Computational Molecular Biology, pp.
263-272, 2000.
[3] I. Guyon, J. Weston, S. Barnhill, and V.
Vapnik. “Gene selection for cancer classification using support vector machines”, Machine Learning, 2000.
[4] J. Weston, S. Mukherjee, O. Chapelle, M.
Pontil, T. Poggio, and V. Vapnik. “Feature selection for SVMs”, Advances in Neural
Information Processing Systems 13, T. K.
Leen, T. G. Dietterich, and V. Tresp, Eds.
Cambridge, MA: MIT Press, pp. 668–674, 2001.
[5] L. Kaufman. “Solving the quadratic programming problem arising in support vector classification”, in Advances in
Kernel Methods - Support Vector Learning, B. Schölkopf, C. J. C. Burges,
and A. J. Smola, eds., MIT Press, 47-167, 1999.[6] M. Brown, W. Grundy, D. Lin, N.
Cristianini, C. Sugnet, J. Manuel Ares, and D. Haussler. “Support vector machine classification of microarray gene expression data”, Technical Report UCSC-CRL-99-09, Department of Computer Science, University of California, Santa Cruz, 1999.
[7] S. Mukherjee, P. Tamayo, D. Slonim, A. Verri, T. Golub, J. Mesirov, and T.
Poggio. “Support vector machine classification of microarray data”, AI Memo 1677, Massachusetts Institute of Technology, 1999.
[8] S. Ramaswamy, P. Tamayo, R. Rifkin, S.
Mukherjee, Chen-Hsiang Yeang, M. Ange lo, C. Ladd, M. Reich, E. Latulippe, J. Mesirov, T. Poggio, W. Gerald, M. Loda, E. Lander, and T. Golub. “Multiclass cancer diagnosis using tumor gene expression signatures”,
5
PNAS, vol.98, no. 26, 15149-15154,
December 18, 2001.[9] T. Golub, D. Slonim, P. Tamayo, C.
Huard, M. Gaasenbeek, J. Mesirov, H.
Coller, M. Loh, J. Downing, M. Caligiuri, C.
Bloomfield, and E. Lander. “Molecular classification of cancer: Class discovery and class prediction by gene expression monitoring”, Science, 286 (5439): 531-537, October 1999.
[10] T. Furey, N. Cristianini, N. Duffy, D.
Bednarski, M. Schummer, and D. Haussler.
“Support vector machine classification and validation of cancer tissue samples using microarray expression data”, Bioinformatics, vol. 16, pp. 906-914, 2000.
[11] Rui Xu, G. Anagnostopoulos, and D.
Wunsch II. “Tissue classification through
analysis of gene expression data using a new family of ART architectures”, Proceedings
of the IEEE-INNS-ENNS International Joint Conference on Neural Networks
(IJCNN ’02), vol. 1, pp. 300-304, Honolulu, Hawaii: IEEE, INNS, ENNS, 2002.[12] V. Vapnik. Statistical Learning Theory, Wiley Interscience, 1998.
[13] Yuh-Jye Lee and O. Mangasarian.
“SSVM: A smooth support vector machine for classification”,
Computational Optimization and Applications, 20, 5-22,
2001.[14] http://bioinformatics.upmc.edu/Help/
UPITTGED.html
[15] http://www-genome.wi.mit.edu/cgi-bin/
cancer/datasets.cgi 圖表:
Table 2: Comparison of experimental results (Tested by 34 independent testing samples)
Author ALL / AML B-ALL / T -ALL
# of genes Errors # of genes Errors T. Golub et al. [9] 50 2 N / A N / A S. Mukherjee et al. [7] 99 0 999 0
T. Furey et al. [10] 25 2 250 0
I. Guyon et al. [3] 8 0 N / A N / A
D. Slonim et al. [2] 50 2 50 1
J Weston et al. [4] 20 0 5 0
Rui Xu et al. [11] 10 1 N / A N / A
Our Results 10 1 20 0
Table 1: Class distribution of leukemia dataset Training Testing Total
AML 11 14 25
B-cell ALL 19 19 38
T -cell ALL 8 1 9
Total 38 34 72
Figure 1. The initial hierarchical classification model
SSVM (ALL / AML)
Data
Data is
AML SSVM
(B-Cell / T-Cell )
Data is B-Cell ALL
T-Cell
Data is T-Cell ALL B-Cell
AML ALL
6 Figure 2. Hierarchical two-phase classification model
SSVM (ALL / AML)
Data
Data is
AML SSVM
(B-Cell / T-Cell )
Data is B-Cell ALL
T-Cell
Data is T-Cell ALL Gene
Selection I
B-Cell
Gene Selection II
AML ALL
Figure 3. Means of 10 selected genes respect to ALL and AML categories. X-axis represents only a serial number of selected genes and without any specific meaning. Y-axis represents the mean value of selected gene expression data respects to different classes. The same specify is used in figure 4 and figure 5.
Figure 4. Means of 20 selected genes respect to B-cell
ALL and T-cell ALL categories Figure 5. Means of 30 selected genes respect to AML, B-cell ALL and T-cell ALL categories. X-axis from 1 to 10 are genes selected for discriminating AML from ALL data, 11 to 30 are selected for classifying B-cell ALL and T-cell ALL.