行政院國家科學委員會專題研究計畫 成果報告
結合 3D 雷射現況掃瞄之室內設計圖層管理系統建構 研究成果報告(精簡版)
計 畫 類 別 : 個別型
計 畫 編 號 : NSC 95-2221-E-011-174-
執 行 期 間 : 95 年 08 月 01 日至 96 年 07 月 31 日 執 行 單 位 : 國立臺灣科技大學建築系
計 畫 主 持 人 : 施乃中
計畫參與人員: 碩士班研究生-兼任助理:張青堼
報 告 附 件 : 出席國際會議研究心得報告及發表論文
處 理 方 式 : 本計畫可公開查詢
中 華 民 國 96 年 07 月 25 日
行政院國家科學委員會補助專題研究計畫 ■ 成 果 報 告
□期中進度報告 結合 3D 雷射現況掃瞄之室內設計圖層管理系統建構
計畫類別:■ 個別型計畫 □ 整合型計畫 計畫編號:NSC-95-2221-E-011-174
執行期間:95 年 8 月 1 日至 96 年 7 月 31 日
計畫主持人:施乃中 共同主持人:
計畫參與人員:
成果報告類型(依經費核定清單規定繳交):■精簡報告 □完整報告
本成果報告包括以下應繳交之附件:
□赴國外出差或研習心得報告一份
□赴大陸地區出差或研習心得報告一份
■出席國際學術會議心得報告及發表之論文各一份
□國際合作研究計畫國外研究報告書一份
處理方式:除產學合作研究計畫、提升產業技術及人才培育研究計畫、列管 計畫及下列情形者外,得立即公開查詢
□涉及專利或其他智慧財產權,□一年□二年後可公開查詢
執行單位:台灣科技大學建築系
中 華 民 國 96 年 7 月
中文摘要
本研究應用3D 長距離雷射掃瞄以改善室內裝修與施工效能,以求提高精確度與品質。3D
現況空間資訊應用於視覺檢視及製圖上具可行性,本科技可改善量測精度、擷取在傳統統方式 下難以量測之尺度、控制施工進度、比對設計與施工差異、以及支援後續室內設施維護與管 理。本研究顯示只有正確設計規範方能滿足設計要求,預防施工錯誤, 正確現況資料可解決設 計問題、控制施工品質而不至於提高預算。
在本研究以台灣科技大學之綜合研究大樓的八樓裝修案為例進行掃瞄,並建立現況、施工 以及竣工之數位資料檔案,以網頁呈現 3D 點雲資料。
關鍵字:3D 雷射掃瞄、室內設計、室內裝修、設計資料數位化 Abstract
The study applies 3D range technology to improve efficiency in interior design and construction with better accuracy and quality. The feasibility of as-built range data was used for visual inspection and drawing production. The technology improved measurement accuracy, retrieved unreachable coordinates, controlled working schedule, compared construction with design, and facilitated follow- up interior maintenance and management. This study also showed that only accurate design specifications can meet design requirements and prevent construction error. Accurate as-built data solve design problems and control construction quality without increasing budget.
This study was exemplified through the 8th floor renovation in NTUST research building. Scans were made to retrieve digital as-built information during and after construction stage. The information of 3D point clouds is presented on web pages.
Keywords: 3D laser scan, interior design, interior, renovation, design data digitization
1. INTRODUCTION
Active surface measuring techniques have been used to automatically reconstruct 3D models by joining polygon meshes since 1994 [13]. The techniques enable highly accurate measuring of 3D surfaces. 3D range images were also used in measuring dimensions of archeology and engineering site[4,6] with high precision 3D coordinates and correct 3D inter-relationship between parts. The measurement is made by scanning laser beams in a non-intrusive manner. The scanned parts are shown in as-built form with surface configuration recorded for follow-up drafting needs.
Traditional representation of architectural design information was mainly illustrated through 2D vector drawings and 3D computer models before construction. The data of real world used to be retrieved manually with limited assistance from survey instruments. On-site measurements are usually sampled in a discontinuous manner and subject to human errors. Missing accurate as-built spatial information may delay working schedule and miscount bill of materials (BOM). Wrong information may come from measurement mistake, dimensional misreading, or setup error. The types of measurement tolerance, which usually come from traditional working habit, can be accumulated to a certain amount and cause problems in installation and budget control. The digital representations are design-oriented data which are different from as-built information used for interior renovation or after- construction facility management. The as-built data should include the most updated design modification or dimension adjusts made to the virtual design environment.
Traditional architectural graphic data do not support the spatial representation of as-built environment. Even the data is represented, the amount and format of data is not suitable for the production environment in design practice. This study has combined the range images retrieved from a
3D long-range laser scanner and the drafting working platform to create a system for as-built data review and comparison with old design data. The most important of all, the system enables a designer to control the spatial relationship of building components before, during, and after a building design project is executed. The range images are feasible not only for visual inspection, but production needs.
2. RESEARCH PURPOSE
The study applies 3D range technology to improve efficiency in interior design and construction with better accuracy and quality. The feasibility of as-built range data used for visual inspection and production should be proven by the control of measurement accuracy, unreachable coordinates, working schedule, construction and design comparison, and follow-up interior maintenance and management.
3. CONSTRUCTION MONITORING
Construction site monitoring is an on-going process that records and monitors data for immediate and post-construction analysis [1,2,11]. 4D technologies have applied databases and 3D modeling tools to create time-based construction descriptions as a means for facilitating inspection [8,9,10].
Links have been established between databases and corresponding 3D objects at specific time periods.
The 3D models can be reviewed visually in different orientations to reveal construction conflicts early enough to make changes in the work schedule.
The monitoring of a site and the correspondence of activities defined by a schedule requires object identification and a thorough record of site occurrences. To achieve this goal, time-based 3D (4D) monitoring focuses on a pre-construction study that will allow for better management of a site afterward [3]. However, a pre-construction simulation cannot necessarily take into account every incident that might occur to the parts of a building under construction.
4. A RANGE FINDER’S APPROACH
Construction assessment using a laser range finder is a kind of non-intrusive scanning technology for data retrieval [12]. Cases have demonstrated that a laser scanner is a useful tool in either accessing data at a construction site or measuring data for interior billing of materials [3,5,6]. A scanner seems to be feasible to record ground profile in a large construction site with a demand for accuracy less than one centimeter, or for cost estimations of interior renovation. Being able to conduct scans of a large area and to inspect the dimensions of a small region at the same time would be an extension of a long- range laser scanner’s functionality that takes advantage of both types of measurements and displays.
Combining laser ranging with commercial design software can model existing facilities four times faster than photogrammetry [1]. The range finder, which uses laser beams to locate the position of a point on a surface, has been used in construction for a long time. Recent developments in technology have enabled the tool to cover a large area for the continuous recording of a surface configuration. For example, rapid local area sensing and 3D modeling was applied for better planning and control of construction equipment operation [7].
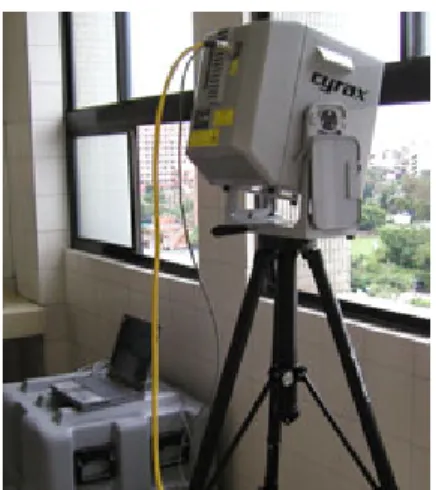
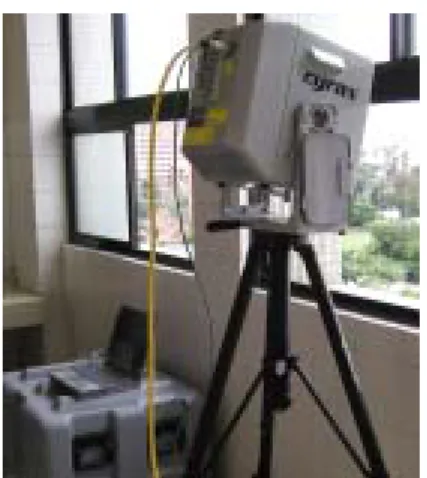
This study tries to built-up a monitor procedure during the construction process. Instead of traditional discrete and point-based data survey, this study applied a long-range 3D laser scanner (Fig.
1) as a survey device for continuous data retrieval. It can reach 100 m and generate a 999x999 laser dots at about 4 mm interval in 17 minutes. The distribution of dots is considered as a continuous sampling of x-, y-, z-coordinate of a particular component. Scans are conducted automatically. The sample points can be easily added up to millions. The initial cost of 3D long-range laser scanner is about $100000 USD, which is much higher than traditional tools do.
Projection efficiency has also increased. If each point takes a total station about five seconds to aim, a laser scanner that projects 999*999 points in 999 seconds would be 4,995 times faster for the same
amount of laser points. The resolution of a view can be increased by tiling scans with each the highest resolution from left to right and from top to bottom. Once a scan is done, its corresponding computer format is stored as the point cloud model. The cloud format can then be transferred into a polygonal model.
Figure 1: The long-range 3D laser scanner
5. INTERIOR RENOVATION
Based on the definition of local Building Technology Regulations, interior renovation specifies the works for space rearrangement, circulation, and the allocation of materials without changing original building usages. Renovation usually includes design, construction, and finishing stages. Upon to the client’s request, the design process starts from site survey, planning, space layout, detail design, defining specification, to construction preparation. A construction firm will be hired based on the design specifications under clearly defined contract and schedule to make sure the works are completed correctly and in a timely manner.
The test case is a campus building interior renovation located in the Department of Architecture, NTUST. The floor area is shown in Appendix. Real construction took about 13 days to complete.
6. 3D SCAN PROCESS
In addition to represent the as-built space data in 3D form, scan data have to integrate with design data. So the scan procedure has to combine design inspection to create a new working process. Scan works are divided into stages, such as planning, on-site jobs, data editing, and publishing.
1. planning stage:
z Define scan region: based on the description of working drawings, target scan subjects, and spaces;
z Scan planning: including objects and their locations for possible scan obstructions;
z Schedule: planning scan schedule with construction schedule to retrieve the most updated data in time.
2. scan stage: including preparation, execution, and edit of scans (Tab. 1).
3. scan data editing:
z cloud registration: Clouds are registered to show the dimensions of spaces as a whole.
z cloud editing: Remove noise from each point cloud and slice clouds to show and export profiles.
z working with CAD system: Export edited clouds to AutoCAD, a popular working platform, and merge with 2D vector drawings.
4. scan data publishing in CAD system: Publish cloud data on web pages based on Octree format and AutoCAD DWF format.
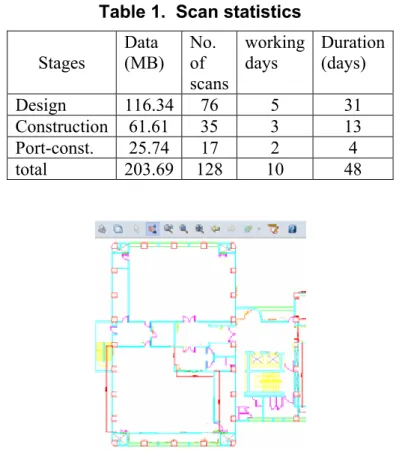
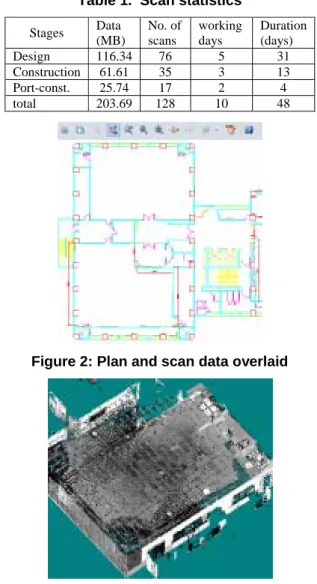
Table 1. Scan statistics Stages Data
(MB) No.
of scans
working
days Duration (days)
Design 116.34 76 5 31
Construction 61.61 35 3 13
Port-const. 25.74 17 2 4
total 203.69 128 10 48
Figure 2: Plan and scan data overlaid
7. AS-BUILT DATA REPRESENTATION SYSTEM
An as-built data representation system consists two major parts which should be feasible for design-, construction-, and finishing- related data manipulation.
1. as-built data retrieval module: The spaces have to be recorded before, during, and after construction. 3D data include the exact locations and configurations of building parts. Since the locations are accurate to laser measurement level, the inter-relationships between parts are defined correctly. The as-built data are originally retrieved as point clouds which count for millions of surface sampling coordinates. The data are good for as-built drawings record before and after construction. The as-built data are also important in the middle of construction process for quality control needs.
2. drafting module that incorporate as-built data: A information management system is required to integrate the data into, for example, layer classifications. In one way existing drafting process can proceed (Fig. 2), and in another a 3D browsing view is provided to designer for 3D data manipulation (Fig. 3).
The integration and management of 3D point clouds includes layer management of design data and file management for web pages. The system has to incorporate different data formats. Most of the layer management system stores 2D vector symbols as graphic components in different layers to create plans, elevations, sections, or details. The layers are made of furniture, openings, mechanical / electrical parts, finishes, structures, partitions, etc. To incorporate as-built data, the system should be able to import point clouds in DXF, and to store and display the data as layers.
Figure 3: Scan data in browser mode
8. THE ANALYSIS OF CONSTRUCTION DATA
Former research has accomplished 3D comparison of 3D scan data sets [5]. In this application, scan data are applied specifically to a better control of renovation quality. As shown in the system interface (Appendix), user can access scan data by dates and stages under design, construction, and post- construction categories. As a result, the data are applicable along a building’s life cycle. The data analysis at design stage is related to drawing production, furniture system evaluation, and BOM.
Registered point clouds verify the real structure plans through column and partition locations. Interior dimensions can be measured, noted, and compared with old drawings in higher accuracy. The plans then were used to evaluate furniture layout.
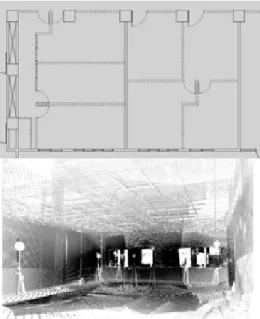
Existing kitchen and interior partitions in room 807 and 808 were demolished. The demolition plan and range images (Fig.4) show the partitions and ceiling tiles had been removed on Dec. 12. New partitions proceeded before ceilings did. Both ceilings and HVAC were installed almost at the same time (Fig. 5). As former researches have been achieved [3,4] in 4D schedule simulation, this study added point cloud browser interface for a virtual 3D walk-through as a schedule inspection aid after scans were registered.
Figure 4: Demolition plan and range images
Scans were made in full scale to facilitate measurements in an internet browser mode. When scans were imported into vector drafting platform, data were scaled down to 1/100 or 1/200 to create the same comparison base with drawings. Overlapping design drawings with point cloud sections was found to be the most efficient and practical way to detect any possible scan error, comparing to tape or theodolite measures. Since most building parts were built orthogonally, the registration alignment can also be inspected easily.
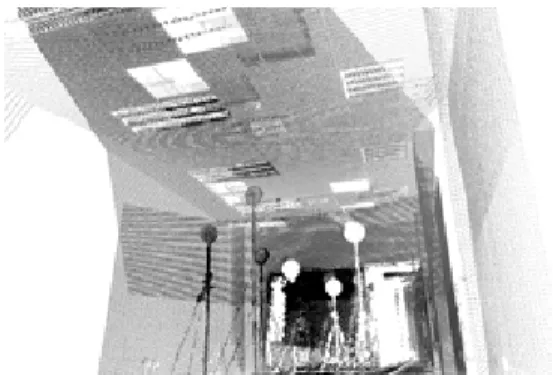
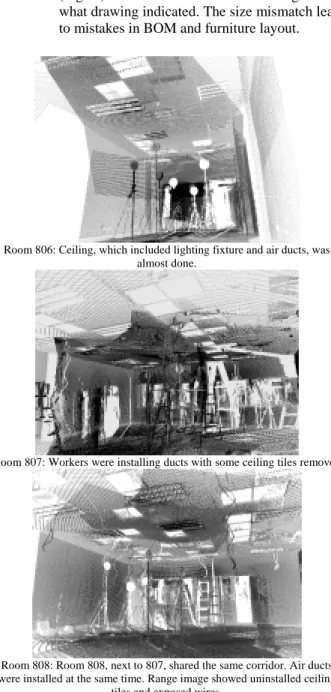
Room 806: Ceiling, which included lighting fixture and air ducts, was almost done.
Room 807: Workers were installing ducts with some ceiling tiles removed.
Room 808: Room 808, next to 807, shared the same corridor. Air ducts were installed at the same time.
Range image showed uninstalled ceiling tiles and exposed wires.
Figure 5: Ceilings and HVAC
9. COMPARING DESIGN AND CONSTRUCTION
Post-construction scans helped create finish drawings to be compared with original design drawings for possible differences at several locations.
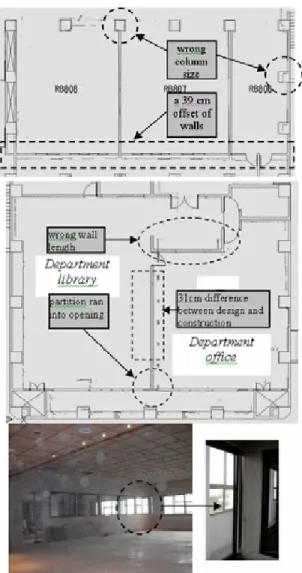
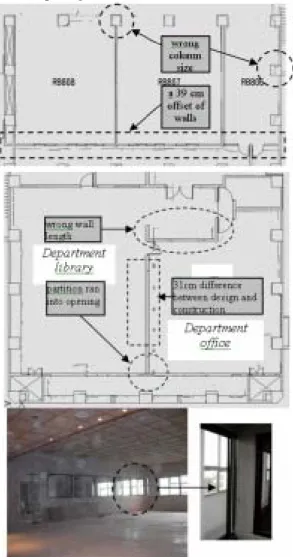
1. Lobby and corridor: Only ceiling at this area was renovated. Comparing the design and as-built data, real wall location was found to be offset 27.83 cm sideway and actual elevator opening width was 6.38 cm less (Fig. 6).
2. Classrooms: Room 806-808 had demolition, ceiling, and HVAC jobs. Room dimension was
important for a proper layout of system furniture; however, scan data showed two mismatches:
z Column size: The real column size should be 62cmX80cm, instead of 80cmX80cm. A 20 cm difference existed.
z Wall location: A 39 cm difference existed between real wall location and drawing data (Fig.
6). The actual room size was larger than what drawing indicated. The size mismatch lead to mistakes in BOM and furniture layout.
3. Department office and library: New partitions were installed to separate a conference room into office and library. Ceiling remained. Three mismatches were found (Fig. 6):
z Wall length: Wrong measurement of wall length turned out to be the key mistake that lead to other construction problems.
z Wrong partition location: Previous wrong wall length lead to the partition located 31 cm to the left of the designed location.
z Partition ran into opening: Due to the survey and construction errors, partition ran into an opening, instead of wall.
10. POST-OCCUPANCY SCAN
The scan data can be exported and classified by layers in AutoCAD. Point clouds with related 2D information were used as finished drawings for working schedule control in the middle of construction or even after spaces were occupied. In this study, related layers were overlaid to show the difference which will be referenced for future maintenance (Fig. 7).
Graduate students and system furniture were moved in after renovation was completed. Whether the original design met user’s need, post-occupancy observation was conducted to reveal user response.
Room 807 and 808 were originally designed for graduate students. After scans were made, the furniture layout showed a different use pattern while a classroom had become a seminar space.
11. CONCLUSION
This study was conducted space by space. Cases showed that incomplete design information lead to miss perception of inter-relationship among design components and consequently caused design or construction errors. The mistakes could be prevented by referring to the as-built scan data. This study also showed that only accurate design specifications can meet design requirements and prevent construction error.
All the site jobs were conducted by a graduate student in 10 working days, out of a period of 48 days. Although this case is considered as a pilot study, accurate as-built data and user-friendly internet interface could have solved design problem initially and improve construction quality without increasing working forces.
Figure 6: Difference in lobby / corridor (top), classrooms (middle), and department office / library (bottom)
Figure 7: Scan record (top left), original design (top right), and overlaid image (bottom)
12. REFERENCES
[1] Al, S., and Salman, T., Large-scale construction projects: Management,design and execution, Batsford, London, 1985.
[2] Atkin, B., Computer supported information interchange for construction projects, International Association for Bridge and StructuralEngineering workshop, Zuerich, 55–65, 1986.
[3] Bailey, A. D., Reverse engineering a process plant to produce a 3-D CAD model, Congres sur la numerisation 3D, design et digitalisation,creation industrielle et artistique, Paris, French, 19–20, 1999.
[4] Besuner, P. and Springfield, J., Modeling existing facilities via laser, Lasers & Optronics, 17(5), 43-4, 1998.
[5] Cheok, G.S., and Stone, W.C., Non-intrusive scanning technology for construction assessment, ISARC’99: Int. Symp. on Automation and Robotics in Construction, IAARC, Madrid, Spain, 645–
650, 1999.
[6] Cheok, G.S., Stone, W.C., Lipman, R. R., and Witzgall, C., Ladars for construction assessment and update, ISARC’99 Int. Symp. on Automation and Robotics in Construction, International Association for Automation and Robotics in Construction (IAARC), Madrid, Spain, 16(9), 5–6, 463–477, 1999.
[7] Cho, Y.K., Haas, C., Liapi, K., and Sreenivasan, S.V., A framework for rapid local area modeling for construction automation, Automation in Construction, 11(6), 629–641, 2002.
[8] Dawood, N., Sriprasert, E., Mallasi, Z., and Hobbs, B., Development of an integrated information resource base for 4D/VR construction process simulation, Automation in Construction, 12(2), 123–131, 2003.
[9] Dzeng, R. J., and Wang, W. C., Automatic schedule integration for highway projects, Automation in Construction, 12(4), 447–461, 2003.
[10] McKinney, K., and Fischer, M., Generating, evaluating and visualizing construction schedules with CAD tools, Automation in Construction, 7(6), 433–447, 1998.
[11] Retik, A., Clark, N., Fryer, R., Hardiman, R., McGregor, D., Mair, G., Retik, N., Revie, K., Mobile hybrid virtual reality and telepresence for planning and monitoring of engineering projects, Reviehttp://www.ee.surrey.ac.uk/Personal/R.Bowden/publications/vrsig97old/proceed/018/vrsig- tx.htm, 2005.
[12] Tseng, A.A., Tanaka, M., and Leeladharan, B., Laser-based internal profile measurement system, Automation in Construction, 11(6), 667–679, 2002.
[13] Turk, G. and Levoy, M., Zippered Polygon Meshes from Range Images. In ACM Computer Graphics Proceedings, SIGGRAPH, Orlando, Florida, pp. 311–318, 1994.
11
APPENDIX: THE MANAGEMENT INTERFACE
出席國際學術會議心得報告
計畫編號 NSC-95-2221-E-011-174
計畫名稱 結合 3D 雷射現況掃瞄之室內設計圖層管理系統建構 出國人員姓名
服務機關及職稱 施乃中 台灣科技大學建築系 教授
會議時間地點 2007.7.9-11 美國 Nevada 州 Las Vegas 市
會議名稱 16th International Conference on Software Engineering and Data Engineering (SEDE-2007)
發表論文題目 The Application of 3D Range Images in the Interior Design Data Management 一、參加會議經過
本次 SEDE-2007(16th International Conference on Software Engineering and Data Engineering)研討 會 在 美 國 Nevada 州 Las Vegas 市 舉 行 , 由 the International Society for Computers and their Applications (ISCA)主辦,地點在 Imperial Palace Hotel,時間為 July 9-11,共為期三天。本人以國 科會補助專題研究-「應用 3D 掃瞄影像於室內設計資料處理」(NSC 95-2221-E-011-174)內容「The Application of 3D Range Images in the Interior Design Data Management」一文發表,而本次參加經費 亦由專題研究中經費補助。
本研討會誠如標題所示分為軟體工程暨資料工程二大類,前者包含模型、發展、維護、確認、物 件導向、網路、人機介面…等諸多議題,後者包含資料庫、結構、資安、最佳化…等諸多議題。
資料形式跨越科學、生物、建築、工程等領域,整個研討會涉及理論、方法、應用、工具之領 域,以下是相關議題:
• Software Engineering
• Software Modeling, Development, & Maintenance
• Software requirements engineering
• Software Verification and Model Checking
• Re-engineering and Reverse Engineering
• AI and Knowledge-based software engineering
• Formal and Semi-formal Methods
• Object-Oriented & Model-Driven Techniques
• Service- and Aspect-Oriented Techniques
• Web Engineering and Agents
• Programming and Description Languages
• Software Visualization and Program Understanding
• Software Quality and Software Metrics
• Software Security, Safety, and Reliability
• Software Components & Software Architectures
• Software Process, Project Management
• Human-Computer Interaction
• Internet and Information Systems Development
• Software Engineering Education
• Applications and Case Studies
• Data Engineering
• Distributed, Parallel, and Peer-to-Peer Databases
• Semi-structured data and XML databases
• Data Integration, Interoperability, and Metadata
• Data Mining: traditional, large-scale, and parallel
• Ubiquitous Data Management and Mobile Databases
• Data Privacy and Security
• Scientific and Biological Databases and Bioinformatics
• Data Grids, Data Warehousing, OLAP
• Temporal, Spatial, Sensor, and Multimedia databases
• Taxonomy and Categorization
• Pattern Recognition, Clustering, and Classification
• Knowledge Management and Ontologies
• Query processing and optimization
• Data Structures
• Database Applications and Experiences
• Web Data Management and Deep Web
本研討會共計 20 國家參加,論文收錄 106 篇文章,每篇文章均經過 2-3 位國際委員審查。研討會 分成下列子項進行:
SPECIALSESSION ON APPLICATIONSINSOFTWAREENGINEERING
SOFTWAREARCHITECTURE
XMLANDXMLAPPLICATIONS
DATABASEANDAPPLICATIONS
DATAQUERYANDAPPLICATIONS
WEBMININGANDWEBAPPLICATIONS
BIOINFORMATICSANDBIOMEDICALAPPLICATIONS
DATAENGINEERINGANDDATAMANAGEMENT
DESIGNPRINCIPLESANDAPPROACHES
SOFTWAREENGINEERINGANDLEARNING
MACHINELEARNINGANDNEURALNETWORKS
UMLANDSOFTWAREDESIGN
MODELINGDIAGRAMSANDMETHODS
ALGORITHMSANDPROTOCOLS
SOFTWAREMEASUREMENT,METRICSANDDEVELOPMENT
每日議程均由 keynote speech 開場,同一時間在不同地區分成二場舉辦,因此常因興趣、專長必須 交錯選擇聽取。本人在第二日 DATA ENGINEERING AND DATA MANAGEMENT 中發表。以下 就有趣、先進之發表介紹:
Ubiquitous Systems
由 invited speaker Mehdi T. Harandi (University of Illinois at Urbana-Champaig) 發 表 , 他 介 紹 Ubiquitous Systems 之 inter-operable component, seamless communication, active space analysis and control 等構成,及 mobile, reactive, adaptive, collaborative integrated, scalable, visual 等特性,並呈現 系統架構圖。不僅在我們日常生活中迭有應用,這已經是軟體系統發展趨勢。這對我研究也有啟 發,因為 3D 掃瞄本用於土木工程中大範圍地表量測,其常用之 PTS 格式便與建築傳統 CAD 資料 形式不同,雖然可經由 3DS、DXF 轉換,但點雲在視覺上仍呈現特殊樣式。除了在掃瞄系統硬體 上必須配合操作,不同 CAD 系統間亦需對話。將來如何延伸掃瞄效能與其他系統整合實為未來研 究課題,在我個人論文發表中將另有介紹。
Home Automation
現今房子可以藉由網路科技連結電器以便經由遠端控制或監控,其中X10便是其一,本研究介紹如 何使用X10經由房子現存電力線用無線方式來控制電器,報告中介紹了數項如scheduling, device customization, zone assignment, and notification services動態功能以降低居家管理負荷。goSmart也支 援多重使用者環境,允許個人化組件設定,這項功能也使它有別於當今市場上一般的解決方案。
在使用X10 Firecracker於無線通訊下,未來有利於新增模組整合。在Smarthomes.逐漸增溫下,
goSmart使日常生活細節執行得以簡化。
3D Range Images
這是我個人發表的論文,介紹如何運用 3D 長距離雷射掃描器記錄室內空間變更時從設計至施工完 成之資料管理。最後成果是用網路呈現 3D 點雲,設計者、業主也可以上網瞭解施工當時狀況、量 測構件間距。主要成果是藉由網路平台給與工程參與者一個高精確度之溝通依據,可做為未來設 施管理之依據。
雖然現場聽眾未必全然熟知或使用過 3D 長距離雷射掃描器,但也提出頗有價值之建議。譬如有人 提議既然現況掃瞄可作為施工與設計差異性比對之依據,應該提供即時警告功能,以便隨時更 正。我個人對於現場不只一人回應很高興,但因時間有限未能詳細說明目前之限制。
因為掃瞄過程涉及大量資料擷取,在掃瞄結束之後才可輸出到不同軟體與原有 3D 模型比對,現有 掃瞄軟體並未提供應用介面,允許使用者預先輸入他種資料,所以除了運算限制也有開放性限 制。雖然現今無法達成理想目標,但至少可以成為未來系統發展研究課題。
VIRTUAL ENVIRONMENT FOR PUPPET ANIMATION
本報告介紹 Avratar-虛擬玩偶動畫系統,使用者可藉由自己身體之自然動作來製造炫目之即時動 畫。現今電腦動畫常用擬人之人形玩偶來控制螢幕上角色動作,但往往所費不貲,Avratar 是 UML-based 的軟體,藉由動作擷取科技來發揮想像力,實乃一大改進。
Web Interface to Medical Information
本研討會另人印象深刻主題之一是醫學影像相關資料庫檢索,醫學影像形式據稱多種(如CT, MRI, CR, Ultrasound, Nuclear Medicine),且無標準格式,如此大量資料在使用者端常造成困擾。論文獎 之一便是以此為主題,敘述如何在1 TB (terabyte, 1000GB)含醫療影像之資料庫中檢索,仍記得作 者經由研討會現場提供之網路花費2-3分鐘便獲得結果,實屬難得。其資料庫僅存影像連結,實際 影像資料則另存。
二、與會心得
以上僅介紹部分論文,綜觀發表成果非常多元化,軟體工程暨資料工程已經縮減建築及相關領域 間之隔閡,領域間合作、技術交流已經是保持進步必須條件,研究多元化本身便是本次研討會最 大收穫。我個人非常希望能跨領域參加不同形式之研討會,藉機與不同領域學者交流,聽聽建 議,方不至於在建築單一框架內故步自封。
三、考察參觀活動 無。
四、攜回資料名稱及內容
本研討會攜回 CD-ROM 一份及未來相關研討會 DM 三種。
五、其他
承蒙國科會補助參加,自感獲益良多,在此致謝。
THE APPLICATION OF 3D RANGE IMAGES IN THE INTERIOR DESIGN DATA MANAGEMENT
Naai-Jung Shih
Department of Architecture
National Taiwan University of Science and Technology 43, section 4, Keelung road, Taipei, Taiwan, ROC
Abstract
The study applies 3D range technology to improve efficiency in interior design and construction with better accuracy and quality. The feasibility of as-built range data was used for visual inspection and drawing production.
The technology improved measurement accuracy, retrieved unreachable coordinates, controlled working schedule, compared construction with design, and facilitated follow- up interior maintenance and management. This study also showed that only accurate design specifications can meet design requirements and prevent construction error.
Accurate as-built data solve design problems and control construction quality without increasing budget.
1. INTRODUCTION
Active surface measuring techniques have been used to automatically reconstruct 3D models by joining polygon meshes since 1994 [13]. The techniques enable highly accurate measuring of 3D surfaces. 3D range images were also used in measuring dimensions of archeology and engineering site[4,6] with high precision 3D coordinates and correct 3D inter-relationship between parts. The measurement is made by scanning laser beams in a non- intrusive manner. The scanned parts are shown in as-built form with surface configuration recorded for follow-up drafting needs.
Traditional representation of architectural design information was mainly illustrated through 2D vector drawings and 3D computer models before construction.
The data of real world used to be retrieved manually with limited assistance from survey instruments. On-site measurements are usually sampled in a discontinuous manner and subject to human errors. Missing accurate as- built spatial information may delay working schedule and miscount bill of materials (BOM). Wrong information may come from measurement mistake, dimensional misreading,
or setup error. The types of measurement tolerance, which usually come from traditional working habit, can be accumulated to a certain amount and cause problems in installation and budget control. The digital representations are design-oriented data which are different from as-built information used for interior renovation or after- construction facility management. The as-built data should include the most updated design modification or dimension adjusts made to the virtual design environment.
Traditional architectural graphic data do not support the spatial representation of as-built environment. Even the data is represented, the amount and format of data is not suitable for the production environment in design practice.
This study has combined the range images retrieved from a 3D long-range laser scanner and the drafting working platform to create a system for as-built data review and comparison with old design data. The most important of all, the system enables a designer to control the spatial relationship of building components before, during, and after a building design project is executed. The range images are feasible not only for visual inspection, but production needs.
2. RESEARCH PURPOSE
The study applies 3D range technology to improve efficiency in interior design and construction with better accuracy and quality. The feasibility of as-built range data used for visual inspection and production should be proven by the control of measurement accuracy, unreachable coordinates, working schedule, construction and design comparison, and follow-up interior maintenance and management.
3. CONSTRUCTION MONITORING
Construction site monitoring is an on-going process that records and monitors data for immediate and post-
construction analysis [1,2,11]. 4D technologies have applied databases and 3D modeling tools to create time- based construction descriptions as a means for facilitating inspection [8,9,10]. Links have been established between databases and corresponding 3D objects at specific time periods. The 3D models can be reviewed visually in different orientations to reveal construction conflicts early enough to make changes in the work schedule.
The monitoring of a site and the correspondence of activities defined by a schedule requires object identification and a thorough record of site occurrences. To achieve this goal, time-based 3D (4D) monitoring focuses on a pre-construction study that will allow for better management of a site afterward [3]. However, a pre- construction simulation cannot necessarily take into account every incident that might occur to the parts of a building under construction.
4. A RANGE FINDER’S APPROACH
Construction assessment using a laser range finder is a kind of non-intrusive scanning technology for data retrieval [12]. Cases have demonstrated that a laser scanner is a useful tool in either accessing data at a construction site or measuring data for interior billing of materials [3,5,6]. A scanner seems to be feasible to record ground profile in a large construction site with a demand for accuracy less than one centimeter, or for cost estimations of interior renovation. Being able to conduct scans of a large area and to inspect the dimensions of a small region at the same time would be an extension of a long-range laser scanner’s functionality that takes advantage of both types of measurements and displays.
Combining laser ranging with commercial design software can model existing facilities four times faster than photogrammetry [1]. The range finder, which uses laser beams to locate the position of a point on a surface, has been used in construction for a long time. Recent developments in technology have enabled the tool to cover a large area for the continuous recording of a surface configuration. For example, rapid local area sensing and 3D modeling was applied for better planning and control of construction equipment operation [7].
This study tries to built-up a monitor procedure during the construction process. Instead of traditional discrete and point-based data survey, this study applied a long-range 3D laser scanner (Fig. 1) as a survey device for continuous data retrieval. It can reach 100 m and generate a 999x999 laser dots at about 4 mm interval in 17 minutes. The distribution of dots is considered as a continuous sampling of x-, y-, z-coordinate of a particular component. Scans are conducted automatically. The sample points can be easily added up to millions. The initial cost of 3D long-range laser scanner is about $100000 USD, which is much higher than traditional tools do.
Projection efficiency has also increased. If each point takes a total station about five seconds to aim, a laser scanner that projects 999*999 points in 999 seconds would be 4,995 times faster for the same amount of laser points.
The resolution of a view can be increased by tiling scans with each the highest resolution from left to right and from top to bottom. Once a scan is done, its corresponding computer format is stored as the point cloud model. The cloud format can then be transferred into a polygonal model.
Figure 1: The long-range 3D laser scanner 5. INTERIOR RENOVATION
Based on the definition of local Building Technology Regulations, interior renovation specifies the works for space rearrangement, circulation, and the allocation of materials without changing original building usages.
Renovation usually includes design, construction, and finishing stages. Upon to the client’s request, the design process starts from site survey, planning, space layout, detail design, defining specification, to construction preparation. A construction firm will be hired based on the design specifications under clearly defined contract and schedule to make sure the works are completed correctly and in a timely manner.
The test case is a campus building interior renovation located in the Department of Architecture, NTUST. The floor area is shown in Appendix. Real construction took about 13 days to complete.
6. 3D SCAN PROCESS
In addition to represent the as-built space data in 3D form, scan data have to integrate with design data. So the scan procedure has to combine design inspection to create a new working process. Scan works are divided into stages, such as planning, on-site jobs, data editing, and publishing.
1. planning stage:
z Define scan region: based on the description of
working drawings, target scan subjects, and spaces;
z Scan planning: including objects and their locations for possible scan obstructions;
z Schedule: planning scan schedule with construction schedule to retrieve the most updated data in time.
2. scan stage: including preparation, execution, and edit of scans (Tab. 1).
3. scan data editing:
z cloud registration: Clouds are registered to show the dimensions of spaces as a whole.
z cloud editing: Remove noise from each point cloud and slice clouds to show and export profiles.
z working with CAD system: Export edited clouds to AutoCAD, a popular working platform, and merge with 2D vector drawings.
4. scan data publishing in CAD system: Publish cloud data on web pages based on Octree format and AutoCAD DWF format.
7. AS-BUILT DATA REPRESENTATION SYSTEM An as-built data representation system consists two major parts which should be feasible for design-, construction-, and finishing- related data manipulation.
1. as-built data retrieval module: The spaces have to be recorded before, during, and after construction. 3D data include the exact locations and configurations of building parts. Since the locations are accurate to laser measurement level, the inter-relationships between parts are defined correctly. The as-built data are originally retrieved as point clouds which count for millions of surface sampling coordinates. The data are good for as-built drawings record before and after construction. The as-built data are also important in the middle of construction process for quality control needs.
2. drafting module that incorporate as-built data: A information management system is required to integrate the data into, for example, layer classifications. In one way existing drafting process can proceed (Fig. 2), and in another a 3D browsing view is provided to designer for 3D data manipulation (Fig. 3).
The integration and management of 3D point clouds includes layer management of design data and file management for web pages. The system has to incorporate different data formats. Most of the layer management system stores 2D vector symbols as graphic components in different layers to create plans, elevations, sections, or details. The layers are made of furniture, openings, mechanical / electrical parts, finishes, structures, partitions, etc. To incorporate as-built data, the system should be able
to import point clouds in DXF, and to store and display the data as layers.
8. THE ANALYSIS OF CONSTRUCTION DATA Former research has accomplished 3D comparison of 3D scan data sets [5]. In this application, scan data are applied specifically to a better control of renovation quality.
As shown in the system interface (Appendix), user can access scan data by dates and stages under design, construction, and post-construction categories. As a result, the data are applicable along a building’s life cycle. The data analysis at design stage is related to drawing production, furniture system evaluation, and BOM.
Registered point clouds verify the real structure plans through column and partition locations. Interior dimensions can be measured, noted, and compared with old drawings in higher accuracy. The plans then were used to evaluate furniture layout.
Table 1. Scan statistics Stages Data
(MB)
No. of scans
working days
Duration (days)
Design 116.34 76 5 31
Construction 61.61 35 3 13
Port-const. 25.74 17 2 4
total 203.69 128 10 48
Figure 2: Plan and scan data overlaid
Figure 3: Scan data in browser mode
Existing kitchen and interior partitions in room 807 and 808 were demolished. The demolition plan and range images (Fig.4) show the partitions and ceiling tiles had been removed on Dec. 12. New partitions proceeded before ceilings did. Both ceilings and HVAC were installed almost at the same time (Fig. 5). As former researches have been achieved [3,4] in 4D schedule simulation, this study added point cloud browser interface for a virtual 3D walk- through as a schedule inspection aid after scans were registered.
Scans were made in full scale to facilitate measurements in an internet browser mode. When scans were imported into vector drafting platform, data were scaled down to 1/100 or 1/200 to create the same comparison base with drawings. Overlapping design drawings with point cloud sections was found to be the most efficient and practical way to detect any possible scan error, comparing to tape or theodolite measures. Since most building parts were built orthogonally, the registration alignment can also be inspected easily.
Figure 4: Demolition plan and range images
9. COMPARING DESIGN AND CONSTRUCTION Post-construction scans helped create finish drawings to be compared with original design drawings for possible differences at several locations.
1. Lobby and corridor: Only ceiling at this area was renovated. Comparing the design and as-built data, real wall location was found to be offset 27.83 cm sideway and actual elevator opening width was 6.38 cm less (Fig. 6).
2. Classrooms: Room 806-808 had demolition, ceiling, and HVAC jobs. Room dimension was important for a proper layout of system furniture; however, scan
data showed two mismatches:
z Column size: The real column size should be 62cmX80cm, instead of 80cmX80cm. A 20 cm difference existed.
z Wall location: A 39 cm difference existed between real wall location and drawing data (Fig. 6). The actual room size was larger than what drawing indicated. The size mismatch lead to mistakes in BOM and furniture layout.
Room 806: Ceiling, which included lighting fixture and air ducts, was almost done.
Room 807: Workers were installing ducts with some ceiling tiles removed.
Room 808: Room 808, next to 807, shared the same corridor. Air ducts were installed at the same time. Range image showed uninstalled ceiling
tiles and exposed wires.
Figure 5: Ceilings and HVAC
3. Department office and library: New partitions were installed to separate a conference room into office and library. Ceiling remained. Three mismatches were found (Fig. 6):
z Wall length: Wrong measurement of wall
length turned out to be the key mistake that lead to other construction problems.
z Wrong partition location: Previous wrong wall length lead to the partition located 31 cm to the left of the designed location.
z Partition ran into opening: Due to the survey and construction errors, partition ran into an opening, instead of wall.
Figure 6: Difference in lobby / corridor (top), classrooms (middle), and department office /
library (bottom)
10. POST-OCCUPANCY SCAN
The scan data can be exported and classified by layers in AutoCAD. Point clouds with related 2D information were used as finished drawings for working schedule control in the middle of construction or even after spaces were occupied. In this study, related layers were overlaid to show the difference which will be referenced for future maintenance (Fig. 7).
Graduate students and system furniture were moved in after renovation was completed. Whether the original design met user’s need, post-occupancy observation was conducted to reveal user response. Room 807 and 808 were originally designed for graduate students. After scans were made, the furniture layout showed a different use pattern while a classroom had become a seminar space.
Figure 7: Scan record (top left), original design (top right), and overlaid image (bottom)
11. CONCLUSION
This study was conducted space by space. Cases showed that incomplete design information lead to miss perception of inter-relationship among design components and consequently caused design or construction errors. The mistakes could be prevented by referring to the as-built scan data. This study also showed that only accurate design specifications can meet design requirements and prevent construction error.
All the site jobs were conducted by a graduate student in 10 working days, out of a period of 48 days. Although this case is considered as a pilot study, accurate as-built data and user-friendly internet interface could have solved design problem initially and improve construction quality without increasing working forces.
12. ACKNOWLEDGEMENTS
This study is sponsored by National Science Council, Taiwan, under the project no. NSC 95-2211-E-011-174.
13. REFERENCES
[1] Al, S., and Salman, T., Large-scale construction projects:
Management,design and execution, Batsford, London, 1985.
[2] Atkin, B., Computer supported information interchange for construction projects, International Association for Bridge
and StructuralEngineering workshop, Zuerich, 55–65, 1986.
[3] Bailey, A. D., Reverse engineering a process plant to produce a 3-D CAD model, Congres sur la numerisation 3D, design et digitalisation,creation industrielle et artistique, Paris, French, 19–20, 1999.
[4] Besuner, P. and Springfield, J., Modeling existing facilities via laser, Lasers & Optronics, 17(5), 43-4, 1998.
[5] Cheok, G.S., and Stone, W.C., Non-intrusive scanning technology for construction assessment, ISARC’99: Int.
Symp. on Automation and Robotics in Construction, IAARC, Madrid, Spain, 645–650, 1999.
[6] Cheok, G.S., Stone, W.C., Lipman, R. R., and Witzgall, C., Ladars for construction assessment and update, ISARC’99 Int. Symp. on Automation and Robotics in Construction, International Association for Automation and Robotics in Construction (IAARC), Madrid, Spain, 16(9), 5–6, 463–
477, 1999.
[7] Cho, Y.K., Haas, C., Liapi, K., and Sreenivasan, S.V., A framework for rapid local area modeling for construction automation, Automation in Construction, 11(6), 629–641, 2002.
[8] Dawood, N., Sriprasert, E., Mallasi, Z., and Hobbs, B., Development of an integrated information resource base for 4D/VR construction process simulation, Automation in Construction, 12(2), 123–131, 2003.
[9] Dzeng, R. J., and Wang, W. C., Automatic schedule integration for highway projects, Automation in Construction, 12(4), 447–461, 2003.
[10] McKinney, K., and Fischer, M., Generating, evaluating and visualizing construction schedules with CAD tools, Automation in Construction, 7(6), 433–447, 1998.
[11] Retik, A., Clark, N., Fryer, R., Hardiman, R., McGregor, D., Mair, G., Retik, N., Revie, K., Mobile hybrid virtual reality and telepresence for planning and monitoring of engineering projects,
Reviehttp://www.ee.surrey.ac.uk/Personal/R.Bowden/publi cations/vrsig97old/proceed/018/vrsig-tx.htm, 2005.
[12] Tseng, A.A., Tanaka, M., and Leeladharan, B., Laser-based internal profile measurement system, Automation in Construction, 11(6), 667–679, 2002.
[13] Turk, G. and Levoy, M., Zippered Polygon Meshes from Range Images. In ACM Computer Graphics Proceedings, SIGGRAPH, Orlando, Florida, pp. 311–318, 1994.
APPENDIX: THE MANAGEMENT INTERFACE