Site Index Model for a Sugi Plantation (Cryptomeria ja- ponica) in Zenlen Area, Taiwan
Dar-Hsiung Wang, 1,3) Chih-Hsin Chung, 1) Han-Ching Hsieh, 1) Shyh-Chian Tang, 1) Tsai-Huei Chen 2)
【 Summary】
Assessing potential site productivity is important for forest planning and predicting forest growth and yield. The most common measure of site productivity is the site index (SI), defined as the average height of dominant and co-dominant trees (top height) at a specified (index) age. Two types of SI curves were investigated in this study to build up a SI curve for a Sugi plantation in Zenlen area, Taiwan. Several models were used to compare the performance among models. Pairs of height-age observations were obtained through a stem analysis. Based on the mean square error criterion, the base-age-specific SI model proposed by Payandeh and Wang (1994) was ranked the best one with an average bias in percentage of -0.36. Despite the advantage of being invariant with the base age used, this study showed a large loss of accuracy and precision caused by base-age- invariant models, especially for those trees younger than 10 yr. Moreover, the accuracy of the SI models varied considerably depending on the choice of predictor age for estimating the SI value at the base age. This study showed a tendency that the closer the predictor age was the base age, the higher the accuracy was that was obtained.
Key words: anamorphic site index curve, polymorphic site index curve, base age.
Wang DH, Chung CH, Hsieh HC, Tang SC, Chen TH. 2012. Site index model for Sugi plantation in Zenlen area, Taiwan. Taiwan J For Sci 27(3):299-307.
1)
Forest Management Division, Taiwan Forestry Research Institute, 53 Nanhai Rd., Taipei 10066, Taiwan. 林業試驗所森林經營組,10066台北市南海路53號。
2)
Silvicluture Division, Taiwan Forestry Research Institute, 53 Nanhai Rd., Taipei 10066, Taiwan.
林業試驗所森林育林組, 10066台北市南海路53號。
3)
Corresponding author, e-mail:[email protected] 通訊作者。
Received May 2012, Accepted June 2012. 2012年5月送審 2012年6月通過。
研究簡報
人倫地區柳杉人工林地位指數區模式之研究
汪大雄 1,3) 鍾智昕 1) 謝漢欽 1) 湯適謙 1) 陳財輝 2)
摘 要
立地潛在生產力(potential site productivity)之推估是在森林生長預測中之要務之一。地位指數之 建立則是目前使用最廣來數量化立地潛在生產力之方法。本研究使用單形態地位指數曲線(anamorphic site index curve)和多形態地位指數曲線(polymorphic site index curve)兩種方式,以樹幹解析資料,使 用不同之模式進行人倫地區柳杉人工林地位指數曲線之建立,並進行配置模式間推估值正確性和精確 性之比較。研究顯示在同時考慮正確性和精確性而言 (mean square error, MSE),所有模式中以Payandeh and Wang (1994)進行地位指數推估之成效最高,整體之平均相對偏差率為-0.36。基準齡無關(base-age invariant)之地位指數模式雖然具有模式配置不受到不同基準齡影響之優點,但其推估能力較基準齡相依 之地位指數模為差,尤其是對林齡小於10年生之林分,其差異現象更為明顯。同時,地位指數之推估正 確性會隨著推估地位指數時所有採用之預測林齡(predictor age)呈現相當大之變化。一般而言,推估地 位指數時使用之預測林齡越接近基準年,其推估則會呈現更為精確之趨勢。
關鍵詞:單形態地位指數曲線、多形態地位指數曲線、基準年。
汪大雄、鍾智昕、謝漢欽、湯適謙、陳財輝。2012。人倫地區柳杉人工林地位指數區模式之研究。台 灣林業科學27(3):299-307。
Over the last several decades, much ef- fort has gone into developing techniques to quantify site quality because of a prerequisite requirement of the ability to measure potential forest site productivity to accurately predict forest growth (McDill and Amateis 1992).
Knowing the site productivity potential helps decision makers focus their management ef- forts on the most productive sites. However, measuring site quality is a challenging task.
Numerous studies have been carried out, and many different approaches were proposed to assess site quality. Among these measures, the height growth of dominant and co-dominant trees is generally considered the most reliable indicator of site quality because it is thought to be more closely related to the site produc- tivity potential than any other measure (Mon- serud 1984).
The most common measure of site quali- ty is the site index (SI), defined as the average height of dominant and co-dominant trees at a specified age (Sharma et al. 2002). The data used to develop SI curves are collected either from a stem analysis (Carmean 1972) or from permanent sample plots (Garcia 1983) of stands of varying ages growing on a variety of site types.
Initially, SI curves were developed using guide curves, a technique of describing a two- dimensional (2D) relationship using a hand- drawn curve. These curves were presented as graphs or tables with no mathematical form.
Using the guide curve method, SI curves
were developed and used for the US Great
Lake states and northern Ontario (Subedi et
al. 2009). Since all anamorphic SI curves are
proportional to the guide curve, if the guide
1996, Lee and Yen 2000, Wang et al. 2001, 2008b). While sugi (Cryptomeria japonica) is a widespread plantation in Taiwan, few SI index models are available. Therefore, the ob- jectives of this study were to fit and evaluate a number of SI models for sugi plantation site quality in the Zenlen area.
Data for this study came from Sugi plan- tations in the Zenlen area, central Taiwan. In this study, 18 well-formed, uninjured dominant and codominant 35-yr-old trees representing a variety of heights were selected for a stem analysis. From the stem analysis, a series of age-height pairs was derived for each tree. The site index of each tree was obtained by mea- suring the height at the base age (30 yr old).
Goodness of fit tests were used to mea- sure the model adequacy. The precision and accuracy of all SIs or height growth fitted were determined by the following statistical criteria in terms of heights (h) or SI (s) at dif- ferent ages.
1)
the average bias in m = Σ(S
i- S
ihat)/n;
2)
the average bias in percentage = Σ((S
i- S
i- hat)/S
i× 100)/n;
3)
the average absolute bias in m = Σabs((S
i- S
ihat)/n);
4)
the standard error of the estimate (SEE) in m = Sqrt (Σ(S
i- S
ihat)
2/(n – m - 1)); and
5)
the mean squared error (MSE) = Bias
**2 + Variance;
where S
ihatis predicted at age A
i, S
iis the actual measurement at age A
i, m is the num- ber of parameters in the model, and n is the number of points in a specified region of age, say 10~15, 16~20, and 21~25 yr old.
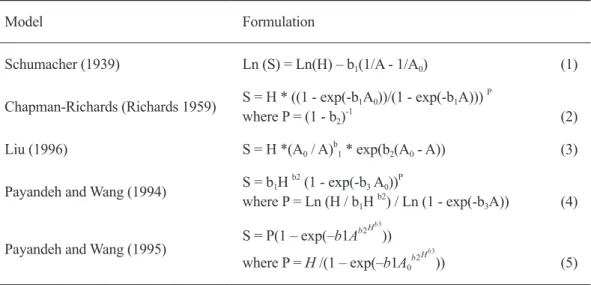
SI models used in this study involved 3 anamorphic SI and 2 polymorphic SI models (Table 1). Parameters for the SI models were estimated and are given in Table 2. The cor- responding dominant height growth models (Table 3) and their parameters were estimated and are given in Table 4.
curve is biased, then the entire family of ana- morphic curves will be biased. Another weak- ness of anamorphic SI curves is the inherent assumption of a common shape for all site classes. For many species, the shape of the height curve varies with site quality (Carmean et al. 2001, Nigh 2001).
Families of SI curves with differing shapes for different SI classes are referred to as polymorphic. These polymorphic SI models are formulated using a variety of ap- proaches. Early SI models were fitted as base age-specific (BAS) (Carmean 1972, Payandeh 1974, Newnham 1988). In that case, the base age is fixed before the model is constructed, and the model parameters are hypothesized as a function of height at the base age (Clut- ter et al. 1983). Two separate equations are required: one for the height-age relationship and another for the SI.
In contrast to BAS SI models, so-called base-age-invariant SI models were also de- veloped (Bailey and Clutter 1974, Goelz and Burk 1992, McDill and Amateis 1992, Strub and Cieszewski 2006). Base age-invariant re- fers to models that do not use the base age as fixed when estimating parameters; therefore, the final height prediction is independent of the initial selected age. While it can reduce problems involved with BAS models, the goodness of fit test remains a question (Pan- yandeh and Wang 1994, Wang et al. 2008b).
In addition to tree height, the inclusion of environmental factors (e.g., mean annual rainfall and average daily maximum tempera- ture) as additional explanatory variables in SI models can greatly improve the fit statistics of those models (McKenney et al. 2003). More- over, some researchers explored the use of a mixed-effects modeling approach to develop SI equations (Wang et al. 2007).
Recently, some research on site produc-
tivity models was carried out in Taiwan (Liu
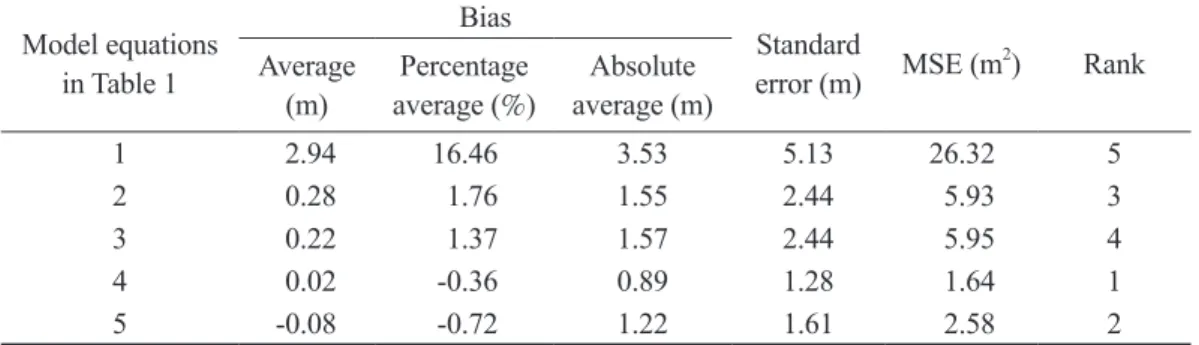
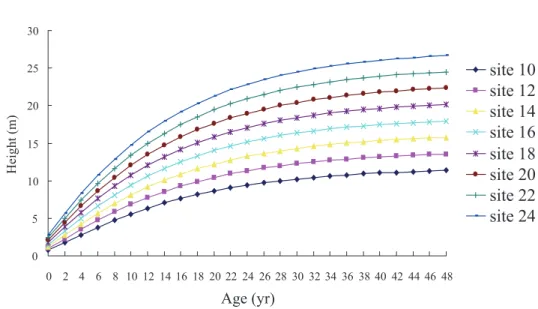
A comparison of the performances of the models showed that except for the Schmacher model, a quite small average bias in percent- age was detected for all models. Based on the MSE, model 4 performed the best (Table 5). The corresponding family of SI curves obtained by coefficients of the dominant height growth model in Table 4 was plotted for SIs from sites 10 to 24 with an interval of 2 m (Fig. 1). It is obvious that a polymorphic dominant height growth pattern was revealed
by the different site qualities with a slight lin- ear growth pattern on poor sites and a more- curved form on good-quality sites.
Compared to the SI model used for a Taiwania plantation in the Liukuei area (Wang et al. 2008b), some differences in value for each criterion was found. This is partly be- cause in the Liukuei area study, compared to this study, sample trees were located in a larger area and had more-diverse ages and heights. However, the superiority of model 4 Table 1. Models used and their formulations for site index estimation
Model Formulation
Schumacher (1939) Ln (S) = Ln(H) – b
1(1/A - 1/A
0) (1)
Chapman-Richards (Richards 1959) S = H * ((1 - exp(-b
1A
0))/(1 - exp(-b
1A)))
Pwhere P = (1 - b
2)
-1(2)
Liu (1996) S = H *(A
0/ A)
b1* exp(b
2(A
0- A)) (3) Payandeh and Wang (1994) S = b
1H
b2(1 - exp(-b
3A
0))
Pwhere P = Ln (H / b
1H
b2) / Ln (1 - exp(-b
3A)) (4)
Payandeh and Wang (1995) S = P(1 – exp(–b1A
b2Hb3))
where P = H /(1 – exp(–b1A
0b2Hb3)) (5) H, tree height in meters at age A; A, tree age (yr); A
0, base age (30 yr old); S, site index
in meters; b
i, estimated parameters.
Table 2. Estimated coefficients and their standard errors (in parenthesis) of the site index for all models based on fitted data
Model equation in Table 1
Parameter
b1 b2 b3
1 -3.3087 (0.0582)
2 0.0678 (0.00295) 1.1349 (0.0213)
3 1.0821 (0.0169) -0.0267 (0.0012)
4 40.5697 (3.9083) -0.1138 (0.0202) 0.0204 (0.00276)
5 6.6097 (0.8087) -1.3971 (0.0321) -0.2267 (0.00262)
Table 3. Models used and their formulations for dominant height growth estimation
Model Formulation
Schumacher (1939) Ln (H) = Ln(S) – b
1(1/A - 1/A
0) (1)
Chapman-Richards (Richards 1959) H = S * ((1 - exp(-b
1A))/(1 - exp(-b
1A
0)))
Pwhere P = (1 - b
2)
-1(2)
Liu (1996) H = S *(A
0/ A)
b1* exp(b
2(A
0- A)) (3) Payandeh and Wang (1994) H = b
1S
b2(1 - exp(-b
3A))
Pwhere P = Ln (S / b
1S
b2) / Ln (1 - exp(-b
3A
0)) (4)
Payandeh and Wang (1995) H = P(1 – exp(–b1A
b2Sb3))
where P = S /(1 – exp(–b1A
0b2Sb3)) (5) H, tree height in meters at age A; A, tree age (yr); A
0, base age (30 yr old); S, site index
in meters; b
i, estimated parameters.
Table 4. Estimated coefficients and their standard errors (in parenthesis) of height growth for all models based on fitted data
Model equation in Table 3
Parameter
b1 b2 b3
1 -3.3087 (0.0582)
2 0.0736 (0.00340) 1.234 (0.0443)
3 -1.0413 (0.0261) 0.0237 (0.00129)
4 1.2621 (0.0531) 0.9693 (0.0135) 0.0737 (0.00338)
5 0.0438 (0.00215) 1.1036 (0.20) 0.0108 (0.0620)
Table 5. Comparison of bias and standard error of site index models with fitted data Model equations
in Table 1
Bias Standard
error (m) MSE (m
2) Rank Average
(m) Percentage
average (%) Absolute average (m)
1 2.94 16.46 3.53 5.13 26.32 5
2 0.28 1.76 1.55 2.44 5.93 3
3 0.22 1.37 1.57 2.44 5.95 4
4 0.02 -0.36 0.89 1.28 1.64 1
5 -0.08 -0.72 1.22 1.61 2.58 2
MSE, mean square error.
was demonstrated by both studies.
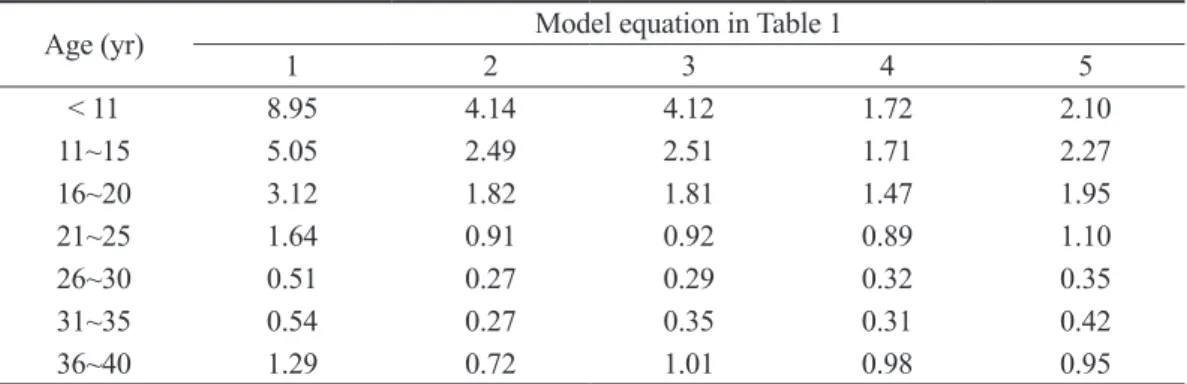
The accuracy of the SI model varies considerably depending on the choice of the predictor age for estimating the SI value at the base age. For all models, it produced quite inaccurate estimates for young ages (i.e., <
15 yr). A strong and consistent trend for ac- curacy was found that for a predictor age, the closer to the base age, the higher accuracy that was obtained for all models (Tables 6, 7).
In other words, this study confirms that the
choice of predictor age influences a models’
accuracy and precision (Payanedh and Wang 1994, Wang and Payanedh 1995, Wang et al.
2008b). Therefore, the SI cannot be reliably estimated with height measurements from very young trees. The spindle-like pattern on the residual plot of model 4 for fitting data is shown in Fig. 2.
All models used in this study are BAS site models. The choice of the base age, how- ever, will affect the parameter estimates for Fig. 1. Family of site index curves at sites 10 to 24 m at an interval of 2 m obtained by model equation 4 in Table 3.
0 5 10 15 20 25 30
0 2 4 6 8 10 12 14 16 18 20 22 24 26 28 30 32 34 36 38 40 42 44 46 48
Age (yr)
Height (m )
site 10 site 12 site 14 site 16 site 18 site 20 site 22 site 24
Table 6. Average absolute bias of the site index (m) at different ages for all models with fitted data
Age (yr) Model equation in Table 1
1 2 3 4 5
< 11 8.36 3.31 3.30 1.37 1.81
11~15 4.57 2.17 2.18 1.28 1.98
16~20 2.65 1.60 1.59 1.19 1.66
21~25 1.35 0.75 0.73 0.72 0.91
26~30 0.35 0.17 0.16 0.19 0.26
31~35 0.44 0.17 0.24 0.25 0.34
36~40 1.07 0.41 0.73 0.67 0.80
the SI curve; therefore, changing the base age can result in different SI values for the same site (Clutter et al. 1983, Stansfield et al.
1991). However, in base-age-invariant site models, because the parameters are estimated using an algebraic difference approach, the fi- nal height prediction is independent of the ini- tially selected base age (Wang et al. 2008a).
One base-age-invariant SI model de- veloped by Payandeh and Wang (1994) was also used in this study. While the application
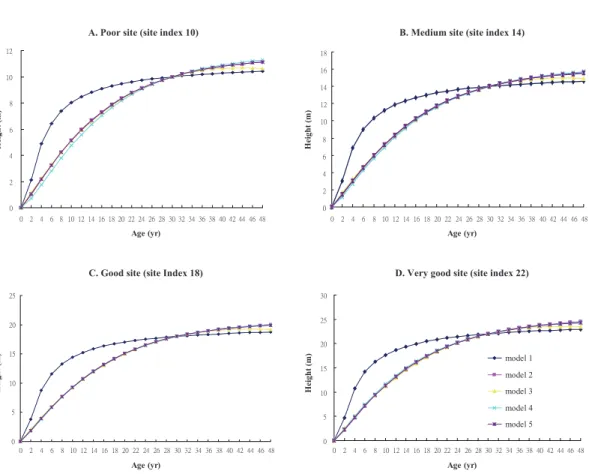
of the base-age-invariant SI model is not af- fected by the base-age used (Bailey and Clut- ter 1974, Goelz and Burk 1992), this study showed a large loss of accuracy and precision caused by base-age-invariant models, espe- cially for those trees younger than 11 yr. For instance, compared to model 4, the average absolute bias for trees younger than 11 yr in the base-age-invariant model was much larger (11.83 vs. 1.37) in Table 6. However, the dif- ference in bias between these 2 models was rapidly reduced by increasing the tree age class. Since the base- age-variant model is used to predict the tree height at a given year, as expected, a high inaccuracy was obtained when very young trees were used to estimate the SI. However, a much higher accuracy was gained when using trees with ages close to the base age. This finding is quite simi- lar to that obtained by Payandeh and Wang (1994) and Wang et al. (2008b). Comparisons of dominant height growth associated with SI models for different site qualities showed that the height growth of model 1 was much steeper than others at younger ages for all sites, and model 3 showed a decrease in height over time after reaching the highest point regardless of the SI values. Not much difference in height existed among models 2, 4, and 5 (Fig. 3).
Table 7. Standard error of the estimate of the site index (m) at different ages for all models with fitted data
Age (yr) Model equation in Table 1
1 2 3 4 5
< 11 8.95 4.14 4.12 1.72 2.10
11~15 5.05 2.49 2.51 1.71 2.27
16~20 3.12 1.82 1.81 1.47 1.95
21~25 1.64 0.91 0.92 0.89 1.10
26~30 0.51 0.27 0.29 0.32 0.35
31~35 0.54 0.27 0.35 0.31 0.42
36~40 1.29 0.72 1.01 0.98 0.95
-8 -6 -4 -2 0 2 4 6
1 2 3 4 5 6 7 Age class
Residual(m)
max bias min bias avg bias
Fig. 2. Residuals plot of the site index estimated by model equation 4 in Table 1 when site indices were estimated based on initial heights of different predictor age classes. Among them, age class 1 represents ages below 11 yr, 2: 11~15 yr, 3:
16~20 yr, 4: 21~25 yr, 5: 26~30 yr, 6: 31~35
yr, and 7: 36~40 yr.
Fig. 3. Comparison of dominant height growth models on (A) a poor site (site index 10); (B) a medium site (site index 14); (C) a good site (site index 18); and (D) a very good site (site index 22).
˃
˅ ˇ ˉ ˋ
˄˃
˄˅
˃ ˅ ˇ ˉ ˋ ˄˃ ˄˅ ˄ˇ ˄ˉ ˄ˋ ˅˃ ˅˅ ˅ˇ ˅ˉ ˅ˋ ˆ˃ ˆ˅ ˆˇ ˆˉ ˆˋ ˇ˃ ˇ˅ ˇˇ ˇˉ ˇˋ Age (yr)
Height (m)
˃
˅ ˇ ˉ ˋ
˄˃
˄˅
˄ˇ
˄ˉ
˄ˋ
˃ ˅ ˇ ˉ ˋ ˄˃ ˄˅ ˄ˇ ˄ˉ ˄ˋ ˅˃ ˅˅ ˅ˇ ˅ˉ ˅ˋ ˆ˃ ˆ˅ ˆˇ ˆˉ ˆˋ ˇ˃ ˇ˅ ˇˇ ˇˉ ˇˋ Age (yr)
Height (m)
˃ ˈ
˄˃
˄ˈ
˅˃
˅ˈ
˃ ˅ ˇ ˉ ˋ ˄˃ ˄˅ ˄ˇ ˄ˉ ˄ˋ ˅˃ ˅˅ ˅ˇ ˅ˉ ˅ˋ ˆ˃ ˆ˅ ˆˇ ˆˉ ˆˋ ˇ˃ ˇ˅ ˇˇ ˇˉ ˇˋ Age (yr)
Height (m) Height (m)
˃ ˈ
˄˃
˄ˈ
˅˃
˅ˈ ˆ˃
˃ ˅ ˇ ˉ ˋ ˄˃ ˄˅ ˄ˇ ˄ˉ ˄ˋ ˅˃ ˅˅ ˅ˇ ˅ˉ ˅ˋ ˆ˃ ˆ˅ ˆˇ ˆˉ ˆˋ ˇ˃ ˇ˅ ˇˇ ˇˉ ˇˋ Age (yr)
model 1 model 2 model 3 model 4 model 5