Testing Taiwan’s National Health Insurance Reforms in Internal Cost Control: from Providers’ Aspect
TEIN-CHENG CHIEN1 AND HSIU-LI CHEN2,*
1Department of Doctor of Dental Surgery, Kaohsiung Medical University, Taiwan
2Department of International Business, Ming Chuan University, Taiwan
ABSTRACT
Implementation of National Health Insurance (NHI) in 1995 was a significant milestone in the Taiwan healthcare scenario. However, the NHI system also has some problems. As physician providers play a major role in health care, the main purpose of this research is to explore the views of providers on NHI policy reforms relating to demand side and supply side of the health care service.
Multiple regression and logistic regression are used to analyze the acceptability of sixteen NHI reforms and to compare the internal cost control by different hospital ownerships and grades. The conclusions of this study are: (1) the evidence supports that both hospital ownership and hospital grade differed significantly on acceptability of demand-side and supply-side policies, but most of them are on supply side policy. (2) Public hospitals, private for profit hospital, and private non-profit hospital have higher probabilities of controlling their internal cost when compared with local clinics. (3) A higher grade of hospital (e.g., medical center, regional center and district hospital) has higher internal cost control pressure than local clinics.
The findings strongly suggest that future NHI reform efforts in Taiwan should focus on provider behavior. Supply-side policies should be the preferred instruments for cost control. In designing optimal contract policies, the Bureau of NHI should use a combination of economic incentives and monitoring to better influence provider practices and finally improve the effectiveness of the NHI system.
Key words: NHI, supply-side, cost control, health policy, physician provider.
1. INTRODUCTION
All the health care systems in the world are faced with the same challenges;
those of improving health, controlling costs, allocating resources, enhancing the quality of care, and distributing health services fairly. The issue of health insurance reforms has remained high on most countries’ health policy-making decisions in the 1990s. Those issues such as demand side vs. supply side reforms, risk aversion vs. moral hazard philosophies, and equity vs. efficiency aspects, are continually emerging (Mooney, 1986; Aaron, 1992; Culyer, 1993).
It is recognized that payment instruments on both the demand and the supply side can be used to attain the social goals of efficient utilization and minimization of a patient’s financial risk (Ellis & McGuire, 1991; 1993). However, two central findings do stand up well and these are what we are emphasizing here. First, conflict rather than consensus is a part of socially optimal payment systems. An ideal payment system is to achieve the desired balance between protecting consumers from financial risk and controlling costs characterized by generous
* Corresponding author. E-mail: hlchen@mcu.edu.tw
insurance coverage as well as financial incentives for providers. However, consumers’ interests conflict with providers’, because consumers would like to receive more services than providers want to provide (Ellis & McGuire, 1990).
Second, supply-side policies are the preferred instruments for cost control. For example, by using Medicare’s resource-based relative value scale (RBRVS), supply-side policies can influence physicians’ decisions such as service mix and specialty choice (Pauly, 1991). However, with asymmetry of information,1 the decision made by health care providers may not always turn out to be of benefit to patients, and so an exclusive reliance on the supply side to determine the quantity of services to be provided poses greater risks. Given profit-seeking physicians, prices that exceed marginal costs may encourage physicians to exploit the agency relationship by creating demand for unneeded services (Feldstein, 1970; Evans, 1991; Labelle, Stoddard & Rice, 1994). Nonetheless, health-policy makers may still find it relatively easy as well as more practical and effective to establish a supply-side model, which can be expected to reduce the risks of asymmetrical information and the costs of mistakes to the minimum, or even to moderate the conflicts among the constituents in the health insurance system (Ellis & McGuire, 1990).
In 1995, Taiwan built her NHI system, it was a significant milestone in Taiwan’s health care history. Major components of this program include:
compulsory participation in the insurance program by individuals, single-payer system, and sharing of premiums by the government, employers and individuals insured. As mentioned above, physicians and health providers play a key role in the health care program, therefore, the main purpose of this study is to test the NHI reforms in internal cost control from the providers’ viewpoints.
1.1 Current Health Care Issues in Taiwan
The NHI beneficiaries are divided into six main categories with reference to factors such as former insurance program affiliation (e.g., Labor Insurance, Government Employees’ Insurance, Farmers’ Health Insurance) payroll-related insured amount, share of premium borne, and method of calculating the premium.
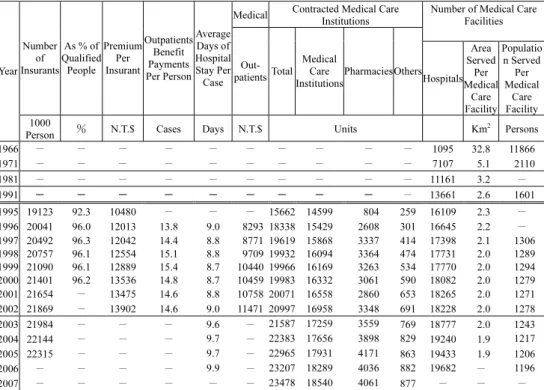
The aim of the enrollment policy of Taiwan’s NHI is to avoid adverse selection and achieve risk pooling under a model that takes both self-reliance and mutual assistance into consideration. According to a poll surveyed in Autumn 2000, the grade of satisfaction with the program was 74%. The coverage rate of the NHI program is 96.2%, with 21 million residents under coverage (Please refer to Table 1 column 3 for details). Moreover, the items reimbursable by the NHI program cover most health care services, such as diagnosis, examinations, laboratory tests, consultations, operations, drugs, materials, treatments, nursing cares, and hospital ward charges. Types of services include various health care items such as
1 As noted by Arrow (1963), uncertainty and asymmetric information are two major distinctive features of the health care market. Health care providers typically have greater knowledge about and information of the nature of illness, treatment choices, and expected outcomes than do patients. As a result, in most cases, physicians are the agents of treatment decisions, acting on behalf of their patients. Supply-side cost sharing is intended to change the nature of the incentives for the providers in treatment decisions.
ambulatory care, inpatient care, care by Chinese medicine doctors, dental care, birth delivery, rehabilitation, disease prevention and health promotion, home care, and rehabilitation of chronic disease, to meet the demands of the insured (Bureau of National Health Insurance [BNHI], 2001).
Table 1. Related data of NHI and insurance programs in Taiwan
Medical Contracted Medical Care Institutions
Number of Medical Care Facilities Number
of Insurants
As % of Qualified
People Premium
Per Insurant
Outpatients Benefit Payments Per Person
Average Days of Hospital Stay Per Case
Out- patientsTotal
Medical Care Institutions
PharmaciesOthers Hospitals
Area Served
Per Medical
Care Facility
Populatio n Served Per Medical
Care Facility Year
1000
Person и N.T.$ Cases Days N.T.$ Units Km2 Persons
1966 Ё Ё Ё Ё Ё Ё Ё Ё Ё Ё 1095 32.8 11866
1971 Ё Ё Ё Ё Ё Ё Ё Ё Ё Ё 7107 5.1 2110
1981 Ё Ё Ё Ё Ё Ё Ё Ё Ё Ё 11161 3.2 Ё
1991 Ё Ё Ё Ё Ё Ё Ё Ё Ё Ё 13661 2.6 1601
1995 19123 92.3 10480 Ё Ё Ё 15662 14599 804 259 16109 2.3 Ё 1996 20041 96.0 12013 13.8 9.0 8293 18338 15429 2608 301 16645 2.2 Ё 1997 20492 96.3 12042 14.4 8.8 8771 19619 15868 3337 414 17398 2.1 1306 1998 20757 96.1 12554 15.1 8.8 9709 19932 16094 3364 474 17731 2.0 1289 1999 21090 96.1 12889 15.4 8.7 10440 19966 16169 3263 534 17770 2.0 1294 2000 21401 96.2 13536 14.8 8.7 10459 19983 16332 3061 590 18082 2.0 1279 2001 21654 Ё 13475 14.6 8.8 10758 20071 16558 2860 653 18265 2.0 1271 2002 21869 Ё 13902 14.6 9.0 11471 20997 16958 3348 691 18228 2.0 1278
2003 21984 Ё Ё Ё 9.6 Ё 21587 17259 3559 769 18777 2.0 1243
2004 22144 Ё Ё Ё 9.7 Ё 22383 17656 3898 829 19240 1.9 1217
2005 22315 Ё Ё Ё 9.7 Ё 22965 17931 4171 863 19433 1.9 1206
2006 Ё Ё Ё Ё 9.9 Ё 23207 18289 4036 882 19682 Ё 1196
2007 Ё Ё Ё Ё Ё Ё 23478 18540 4061 877 Ё Ё Ё
Note. Source: BNHI (1999; 2003; 2005; 2008).
1.2 Some Issues after the Inauguration of the NHI Program
There have been some problems after the implementation of the NHI program.
First, the development among medical specialties is unbalanced. The single-payer system is currently the primary system being used in Taiwan. However, this system fails to fully reflect differences in the consultation time within the same department and especially so in different departments. When the cost differences in the various departments are not considered and are not properly accounted for, an imbalance in the structure of medical expenses will occur, which will significantly affect the quality of medical services (Yaung, 1998). Second, there are lopsided increases in ambulatory and hospital care expenses. The fee-for-service program is the main program used in Taiwan. Owing to the information asymmetry, health care providers can take advantage of medical information and reap profits because medical services are not completely transparent and monitored. There has been a
sharp rise in the number of daily visits since the inauguration of health insurance.
The number of annual visits per person has increased from 10.8 to 15.8. The total amount of annual medical expenses has increased, which threatens the financial balance of health insurance. Third, the medical infrastructure was changed with the new classification. After the implementation of NHI, the increase in health care resources and accessibility of health care at all hospital grades has had a great impact on district hospitals, which originally constituted 90% of the total number of hospitals. To date, 15% of district hospitals have been closed because of sharp decreases in the number of outpatients and hospitalized patients, and a substantial loss of physicians. Moreover, the referral system was originally intended to reduce the number of patients seeking medical treatment from medical centers in the hope of achieving reasonable utilization of medical resource (Yaung, 1998). However, it was not adopted well because of opposition from the public who obviously prefer the services provided by medical centers and large hospitals. A lot of medium-sized and small hospitals are having a hard time running their business (ROC, Department of Health, 1997).
In sum, some problems hide explicitly or implicitly in implementation of the NHI program. Therefore, to examine if the NHI reforms could solve these problems is the main purposes of this study. Specifically, this study assesses: (1) the different degrees of acceptability of NHI reforms between public and private health organizations; (2) the different degrees of acceptability of NHI reforms in different hospital grades; (3) the attitudes toward internal cost control by implementing NHI reforms in different hospital grades; and (4) if a higher grade of hospital has a more positive attitude toward internal cost control.
2. RESEARCH DESIGN AND HYPOTHESES 2.1 Research Framework
In order to address the issue highlighted in above section, a conceptual model and research hypotheses are presented firstly. All methodologies we used are selected according to this framework and will be explained later in this paper.
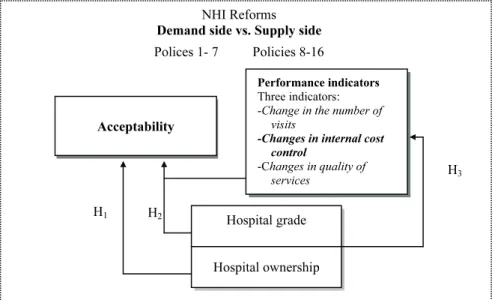
Figure 1 presents the conceptualized relationships between the policy reforms, hospital characteristics, and efficacy of policy reforms. Particularly, sixteen policies can be grouped into either demand side or supply side. Also, this study conducts the policy reforms effective on acceptability as well as three indicators: “Change in the number of visits,” “Changes in internal cost control,” and “Changes in quality of services.” To simplify, the above three indicators were replaced by “performance indicators.”
2.2 Research Hypotheses
Organization of health care systems refers to the manner in which personnel and facilities are coordinated and controlled in the delivery of health services (Anderson, 1972). Reviewing the studies and trends, it can be assumed that
physicians drive the pattern of health service usage (Ellis & McGuire, 1990; Siegel, 1992). Therefore, providers’ acceptability of NHI policies should be carefully assessed. Several studies have shown that differences in medical practice organization often constitute an important source of variation in resource utilization (Kravitz & Greenfield, 1995; Eckerlund, 1989). In so doing, this paper investigates the effectiveness of the NHI reforms from the aspect of physicians who are attached to different hospital ownerships or different hospital grades; where hospital ownership is further divided into “Public hospital” and “Private hospital”;
and hospital grade refers to “Medical center and Regional hospital,” “District hospital,” and “Local clinics.” These groups are conceptualized based on existing administrative classification.2 A question arises here: “How do providers setting characteristics interact with perceptions of impact on health care services and influence the overall acceptability of the policy reforms?”(Anderson, Rice &
Kominski, 1996) Thus, the following hypotheses are proposed:
Hypothesis H1: The degrees of acceptability of the NHI reforms are different in accordance with hospital ownership.
Hypothesis H2: “Performance indicators” and Hospital ownership/Hospital grade are significantly related to the degree of “Acceptability of the selected policy reforms.”
Figure 1. A conceptual framework of this study.
2 The classification has brought about a polarization in the medical market. Many medium-sized and small hospitals are having a hard time running their hospitals since the quality of health services is questioned by the public. As a result, people tend to seek medical treatment from large hospitals or general practitioners.
Hospital grade
Hospital ownership NHI Reforms
Demand side vs. Supply side Polices 1- 7 Policies 8-16
Acceptability
Performance indicators Three indicators:
-Change in the number of visits
-Changes in internal cost control
-Changes in quality of services
H1 H2
H3
Establishing and maintaining fiscal balance and long-term operational viability is an important task for most Health Insurance Systems in the world. As a result, cost control has become the most important challenge. The initial NHI program is designed to encourage the use of health services and promote social justice. However, when overuse or abuse of health care services began to threaten the financial soundness of the NHI, cost control policies were proposed and introduced to inhibit the growth in the utilization of medical services. Previous literature has shown that smaller hospitals are generally under greater financial pressure than larger hospitals and are expected to reduce Length of Stay (LOS) drastically (Hadley, 1996; Shi, 1996). They also have more flexibility to do so.
Health policy reforms and market changes that put more financial pressures on larger hospitals than on local clinics can result in cost containment. By the same token, the private sectors are more vulnerable to internal cost control pressures than the public sectors. The question here is “Which grade of providers would be more sensitive to financial pressure under specific selected policies?” The hypothesis here is:
Hypothesis H3A: Private hospitals are more sensitive to institutional pressures of internal cost control than public hospitals.
Hypothesis H3B: A higher grade of hospital (e.g., medical center, regional center, and district hospital) has higher internal cost control pressure than local clinics.
2.3 Sampling Design and Data Collection
Data for this research came from the Chung-Hua Institution for Economic Research (CIER), covering the 2000 Health Services Market Stakeholder Survey.3 The population of this sampling covered the whole of Taiwan4 containing medical service providers, physicians at public and private hospitals (private for profit), foundation hospital (private non-profit) and private clinics.
An official complete list of members was provided by the Taiwan Doctors’
Union, including 29,643 western medicine doctors, 8,600 dentists, and 4,023 Chinese medicine doctors. Using systematic random sampling, 597 doctors were selected as interviewees. The Computer Assisted Telephone Interview (CATT) technique was used as data collection technique. A visual and audio monitoring system was set to monitor interviewing to ensure strict quality control. Every planned interview that was unsuccessful on the first attempt was followed up again, sometimes more than three times, until the specific individual was contacted, to ensure completion of the interview. Such a strict and cautious survey process to acquire a representative sample data can reduce the sample deviation and raise the
3 Because Taiwan’s health delivery system is almost a closed type, the population for sampling included all service providers (e.g. doctors) of hospitals and clinics in Taiwan.
4 Excluding Penghu County, an offshore island, where the Health Insurance System is a little different from that of the other counties.
credibility of the research results.5 At the same time, a questionnaire was mailed to the 100 selected experts and scholars to serve as a cross-reference interviewee group. Forty-eight responses were received. The period of data collection was November 23-January 6, 2002.
2.3.1 The questionnaire
A 16 (16 policy reforms) x3 (three independent variables) x1 (attitude of policy acceptability) design was used for the study. The 16 policy reforms include:
(1) Raise the proportion or fixed amount of co-payment. (2) Implement higher partial payment for high-frequency use of medical services. (3) Implement co-payment of medicine charges. (4) Carry out graded medical treatment referral system. (5) Adopt the Medical Savings Account (MSA) System. (6) Implement a system that protects patients with serious disease conditions. (7) Raise the National Health Insurance premium. (8) A multiple insurer system. (9) Implement specific family doctor systems. (10) Restrict the supply of medical equipment. (11) Expand the application scope of a global budget system. (12) Adopt a capitation system.
(13) Adopt a Diagnosis-related-Group (DRG) System. (14) Separate medical treatment from medicine supply. (15) Set a Reasonable Visit Number for medical institutions. (16) Strengthen the auditing, monitoring and control of medical institutions. Where the first seven policy reforms belong to “demand side” policies and the rest of the policy reforms are “supply side” policies. The detail contents of the sixteen policies are described in Appendix 1. Next, the three performance indicators are “change in the number of visits,” “change in internal cost control,”
and “change in quality of care.” Finally, is the acceptability of selected policies.
Each policy was measured along the first three dimensions with a 5-point Likert scale, and along the fourth dimension with a 10-point semantic differential scale.
For example, the 5-point scale for the dimension “change in number of visits”
included the terms: greatly increased, increased, unchanged, decreased, greatly decreased.
2.3.2 Validity
The content validity was evaluated by experts during early stages of instrument development. The full breadth of content was the result of a series of meetings and panel discussions. Several steps were taken to conduct qualitative interviews, to review the scientific literature, and to refine the instruments for content validity. Based on the literature review and expert opinion, the content validity for the survey instrument was established. The construct adequacy of the measurement instrument was established using correlation analysis and factor analysis. Responses on the acceptability of policies should be systematically related with the other three major dimensions; access of services, the cost of care, and the quality of care (Edward & Richard, 1979).
5 The results of the interview were: (1) successful interviews: 208 persons. (2) Refused to interview: 4 persons (3) Incomplete interviews: 56 persons (4) Inapplicable interviews: 308 telephone numbers, including “unapproachable”, no suitable target interviewee, the interviewees not being in during the period of interview, etc.
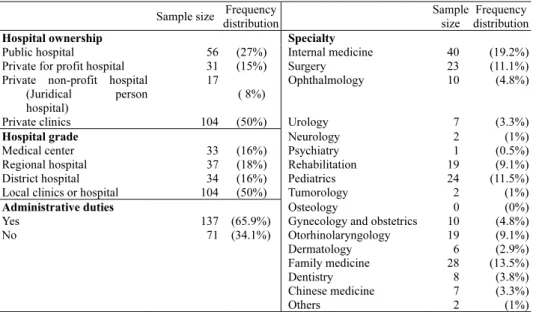
Table 2. Sample distribution of institutions covered (N=208) Sample size Frequency
distribution
Sample size
Frequency distribution
Hospital ownership Specialty
Public hospital 56 (27%) Internal medicine 40 (19.2%) Private for profit hospital 31 (15%) Surgery 23 (11.1%) Private non-profit hospital
(Juridical person hospital)
17 ( 8%)
Ophthalmology 10 (4.8%)
Private clinics 104 (50%) Urology 7 (3.3%)
Hospital grade Neurology 2 (1%)
Medical center 33 (16%) Psychiatry 1 (0.5%)
Regional hospital 37 (18%) Rehabilitation 19 (9.1%) District hospital 34 (16%) Pediatrics 24 (11.5%) Local clinics or hospital 104 (50%) Tumorology 2 (1%)
Administrative duties Osteology 0 (0%)
Yes 137 (65.9%) Gynecology and obstetrics 10 (4.8%)
No 71 (34.1%) Otorhinolaryngology 19 (9.1%)
Dermatology 6 (2.9%)
Family medicine 28 (13.5%)
Dentistry 8 (3.8%)
Chinese medicine 7 (3.3%)
Others 2 (1%)
2.3.3 Reliability
Internal consistency and Cronbach’s α was measured with “acceptability of the selected policies” as the focus. Table 4 shows the reliability coefficients of the total 16 items which yielded a Cronbach’s α, of 0.86. This is significantly higher than the threshold value of 0.70 of an acceptable level for reliability (Nunnally, 1978).
3. ANALYSIS AND RESULTS 3.1 Preliminary Data Analysis
The sample size and distributions of physician providers surveyed by type and grade of hospital, clinical specialty, and administrative responsibilities are shown in Table 2. The table shows that 27% of sample providers worked for public hospitals and 73% worked in the private sector (15% in private for profit hospitals, 8% in private non-profit hospitals, and 50% in private clinics) (see Table 2).
3.2 Hypotheses Testing Hypothesis H1
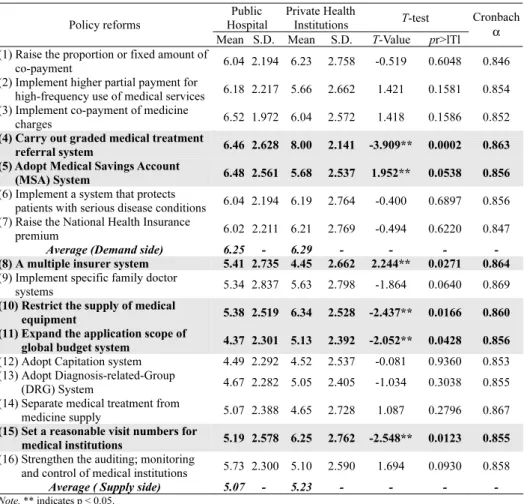
Table 3 shows the bi-variate analysis and t-testing results of the policy acceptabilities in accordance with hospital ownership. It can be seen that the average acceptability on demand side is higher than on supply side (6.29 vs. 5.07 for public hospitals; and 6.29 vs. 5.23 for private health institutions). It is
concluded that, overall, providers have higher acceptabilities on demand side policy reforms than on supply side reforms in both public and private sectors. However, the policy acceptabilities are significantly different between the two groups only on Policies 4, 5, 8, 10, 11 and 15. Therefore, the Hypothesis H1 is only partially accepted.
Table 3. Differences between public and private sector providers on acceptability of the policy reforms
Public Hospital
Private Health
Institutions T-test Policy reforms
Mean S.D. Mean S.D. T-Value pr>lTl
Cronbach α (1) Raise the proportion or fixed amount of
co-payment 6.04 2.194 6.23 2.758 -0.519 0.6048 0.846 (2) Implement higher partial payment for
high-frequency use of medical services 6.18 2.217 5.66 2.662 1.421 0.1581 0.854 (3) Implement co-payment of medicine
charges 6.52 1.972 6.04 2.572 1.418 0.1586 0.852
(4) Carry out graded medical treatment
referral system 6.46 2.628 8.00 2.141 -3.909** 0.0002 0.863 (5) Adopt Medical Savings Account
(MSA) System 6.48 2.561 5.68 2.537 1.952** 0.0538 0.856 (6) Implement a system that protects
patients with serious disease conditions 6.04 2.194 6.19 2.764 -0.400 0.6897 0.856 (7) Raise the National Health Insurance
premium 6.02 2.211 6.21 2.769 -0.494 0.6220 0.847 Average (Demand side) 6.25 - 6.29 - - - - (8) A multiple insurer system 5.41 2.735 4.45 2.662 2.244** 0.0271 0.864 (9) Implement specific family doctor
systems 5.34 2.837 5.63 2.798 -1.864 0.0640 0.869 (10) Restrict the supply of medical
equipment 5.38 2.519 6.34 2.528 -2.437** 0.0166 0.860 (11) Expand the application scope of
global budget system 4.37 2.301 5.13 2.392 -2.052** 0.0428 0.856 (12) Adopt Capitation system 4.49 2.292 4.52 2.537 -0.081 0.9360 0.853 (13) Adopt Diagnosis-related-Group
(DRG) System 4.67 2.282 5.05 2.405 -1.034 0.3038 0.855 (14) Separate medical treatment from
medicine supply 5.07 2.388 4.65 2.728 1.087 0.2796 0.867 (15) Set a reasonable visit numbers for
medical institutions 5.19 2.578 6.25 2.762 -2.548** 0.0123 0.855 (16) Strengthen the auditing; monitoring
and control of medical institutions 5.73 2.300 5.10 2.590 1.694 0.0930 0.858 Average ( Supply side) 5.07 - 5.23 - - - - Note. ** indicates p < 0.05.
Hypothesis H2
As mentioned earlier, the policy acceptability of providers should be correlated with their perceptions of the policy’s impact on three performance indicators: “overall health services utilization,” “changes in internal cost control,”
and “changes in quality of services.” Moreover, it is assumed that there is an association between policy incentives and organization’s roles. For example, the
public sector hospitals are assumed to have social responsibility and are subsidized by government. Empirically, if the t-test was performed and it was found that there is a significant difference between public sector and private sectors on the acceptability of certain policy reform i, then the policy i is taken into a further regression analysis. The multiple regressions (Equation 1 and 2) were set up to test Hypothesis H2:
i i i i i i i i i i
Yi = b0 + b1X1 + b2 X2 + b3 X3 + b4 TY + ε , (1) where Yi indicates the “acceptability of NHI reform I”; X1i indicates “changes in
the number visits (Utilization)”; X2i indicates “changes in internal cost control”;
X3i indicates “changes in quality of care”; TYi indicates “hospital ownership”: with TYi = 1 indicating public sector and TYi = 0 indicating private sector.
i
j ji
ji i i i i i i i
i HL
Y X X X 2 ε
1 4 3 3 2 2 1 1
0 + + + + +
=β β β β β
∑
= , (2)where HL1i = 1 indicates medical center and regional hospital grades; 0, otherwise.
HL2i = 1 indicates district hospital grade, 0 otherwise. Local clinics form the reference group. Therefore, if HL1i = 1 and HL2i = 0 then equation 2 represents the regression of medical center and regional hospital grades; if HL1i = 0 and HL2i = 1 then equation 2 represents the regression of district hospital grade; and if HL1i = 0 and HL2i = 0 then equation 2 represents the regression of local clinics.
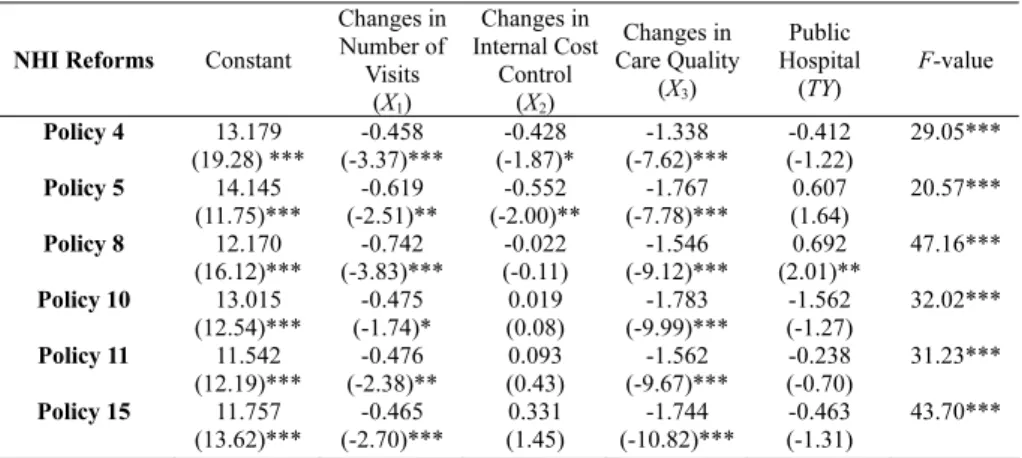
By using Equation 1, multiple regression analyses were performed on these policies. It can be seen from Table 4 that the coefficients of X1 (Changes in the number of visits) are negative for all the selected policies indicating an increase in the number of visits and the acceptability of the selected policy increased.6 Moreover, the negative coefficients of TYi on policies 4, 10, 11, 15 indicate that the public sectors have low acceptability on these policies when compared to private providers.
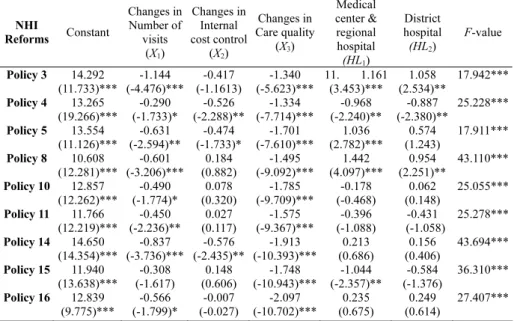
Next, the ANOVA procedure shows that the three hospital grades are significantly different on acceptability of Policies 3, 4, 5, 8, 10, 11, 14, 15, and 16 (the ANOVA results are available upon request from the author). These policy reforms are further examined by regression analysis by using Equation 2. The results are shown in Table 5. It is concluded that the medical centers and regional hospitals have higher degrees of acceptability (compared with District Hospital and Local Clinics) on Policies 5, 8, and 14; while district hospitals have higher degrees of acceptability on policies 10 and 16; and local clinics have higher degrees of acceptability on policies 4, 11, and 15.
6 The questionnaire requested respondents to select their responses on a scale of 1-5, with 1 representing greatly increased number of visits or very intensively increased, and 5 representing greatly decreased or very infrequent visits. The higher the rating, the more negative the opinion (or performance) regarding that policy. Therefore, if a score was less than 3, it was classified into the “overall increased” group; if the score was equal to 3, then it was classified into the “unchanged” group; and a score of more than 3 was classified into the “overall decreased” group.
Some useful findings from Table 4 and Table 5 are: first, providers both in the private sector and clinics grade have a higher degree of acceptability on Policy 4 (carry out graded medical treatment referral system). The reason is, in fact, Taiwan’s health care system has not incorporated a well-established referral system based on a family doctor system. Patients are free to choose their own physicians, and physicians who practice in clinics are completely independent of hospitals. As a result, hospitals and clinics compete to provide outpatient services to the same group of potential patients. For some reason, patients have no intention of requesting a referral (Liang, 1999) and the medical centers capture the highest percentage of primary care outpatients. That is why most of the providers who are not in the larger hospitals, opined that implementation of these policies resulted in an “overall increase” in the number of visits.
Second, the previous price-oriented controls failed to effectively control the growth of overall expenditures of the Taiwan NHI Bureau. The NHI Bureau hopes to control the overall budgeting within a certain limit by a lump-sum payment system. Currently, the NHI is gradually transitioning from an expenditure-objective system to a maximum-limit system (global budgeting). Therefore, the larger hospitals have a significantly lower degree of acceptance than local clinics on policy 11 (Expand the application scope of global budget system).
Third, the NHI set up a partial user-pay system, in line with the medical network plans, to restrict the growth in the demand for hospitals and high-tech medical services. Meanwhile, the NHI set up a sound auditing system to prevent overstatement and misrepresentation of health-care cases. This is the reason why larger sectors dislike policy 10 (Restrict the supply of medical equipment).
Table 4. Acceptability of the selected policy reforms with provider opinions on performance indicators -- public hospital vs. private hospital (private hospital is the contrast group)
NHI Reforms Constant
Changes in Number of
Visits (X1)
Changes in Internal Cost
Control (X2)
Changes in Care Quality
(X3)
Public Hospital
(TY) F-value Policy 4 13.179
(19.28) ***
-0.458 (-3.37)***
-0.428 (-1.87)*
-1.338 (-7.62)***
-0.412 (-1.22)
29.05***
Policy 5 14.145 (11.75)***
-0.619 (-2.51)**
-0.552 (-2.00)**
-1.767 (-7.78)***
0.607 (1.64)
20.57***
Policy 8 12.170 (16.12)***
-0.742 (-3.83)***
-0.022 (-0.11)
-1.546 (-9.12)***
0.692 (2.01)**
47.16***
Policy 10 13.015 (12.54)***
-0.475 (-1.74)*
0.019 (0.08)
-1.783 (-9.99)***
-1.562 (-1.27)
32.02***
Policy 11 11.542 (12.19)***
-0.476 (-2.38)**
0.093 (0.43)
-1.562 (-9.67)***
-0.238 (-0.70)
31.23***
Policy 15 11.757 (13.62)***
-0.465 (-2.70)***
0.331 (1.45)
-1.744 (-10.82)***
-0.463 (-1.31)
43.70***
Note. 1. t values in parentheses; * indicates p < 0.1; ** indicates p < 0.05; *** indicates p < 0.01.
2. R2 for reform (4) is 0.390; reform (5) is 0.348; reform (8) is 0.549; reform (10) is 0.410; reform (11) is 0.427;
and reform (15) is 0.482.
Table 5. Regression results showing the association of acceptability of the selected policy items with performance indicators (Local Clinics is the contrast group)
Reforms NHI Constant
Changes in Number of
visits (X1)
Changes in Internal cost control
(X2)
Changes in Care quality
(X3)
Medical center &
regional hospital (HL1)
District hospital (HL2)
F-value
Policy 3 14.292 (11.733)***
-1.144 (-4.476)***
-0.417 (-1.1613)
-1.340 (-5.623)***
11. 1.161 (3.453)***
1.058 (2.534)**
17.942***
Policy 4 13.265 (19.266)***
-0.290 (-1.733)*
-0.526 (-2.288)**
-1.334 (-7.714)***
-0.968 (-2.240)**
-0.887 (-2.380)**
25.228***
Policy 5 13.554 (11.126)***
-0.631 (-2.594)**
-0.474 (-1.733)*
-1.701 (-7.610)***
1.036 (2.782)***
0.574 (1.243)
17.911***
Policy 8 10.608
(12.281)*** -0.601 (-3.206)***
0.184
(0.882) -1.495 (-9.092)***
1.442 (4.097)***
0.954
(2.251)** 43.110***
Policy 10 12.857 (12.262)***
-0.490 (-1.774)*
0.078 (0.320)
-1.785 (-9.709)***
-0.178 (-0.468)
0.062 (0.148)
25.055***
Policy 11 11.766 (12.219)***
-0.450 (-2.236)**
0.027 (0.117)
-1.575 (-9.367)***
-0.396 (-1.088)
-0.431 (-1.058)
25.278***
Policy 14 14.650 (14.354)***
-0.837 (-3.736)***
-0.576 (-2.435)**
-1.913 (-10.393)***
0.213 (0.686)
0.156 (0.406)
43.694***
Policy 15 11.940 (13.638)***
-0.308 (-1.617)
0.148 (0.606)
-1.748 (-10.943)***
-1.044 (-2.357)**
-0.584 (-1.376)
36.310***
Policy 16 12.839 (9.775)***
-0.566 (-1.799)*
-0.007 (-0.027)
-2.097 (-10.702)***
0.235 (0.675)
0.249 (0.614)
27.407***
Note. 1. t values in parentheses.
2. * p < 0; ** p < 0.05; *** p < 0.01.
3. R-square: (3) 0.322; (4) 0.411; (5) 0.369; (8) 0.583; (10) 0.406; (11) 0.431; (14) 0.531; (15) 0.493 (16) 0.4140.
Hypothesis H3A
Hypothesis H3A tests whether or not the private sector are more vulnerable to the pressures of increasing internal cost control pressures initiated in response to government policy than the public sector. Based on this hypothesis, a health provider’s attitude toward internal cost control can be divided into two categories, namely, positive and negative attitudes. Equation 3 shows the binary choice model.
(
=)
= ⎜⎝⎛ ∑ ⎟⎠⎞= 3
1Z 1
Pr ICC Zki F βikk ki (3)
where Pr (ICC=1) indicates the probability of positive attitude to the internal cost control; and F(¸) is the cumulative distribution function (Maddala, 1983); Zki is an explanatory variable with the response parameter βik for policy i. Z1i indicates public hospital; Z2i indicates private for profit hospital; and Z3i is private non-profit hospital. These variables are defined such that “local clinics” is the reference group.
SAS LOGISTIC procedure was performed for the sixteen policies respectively to fit a logistic regression model.
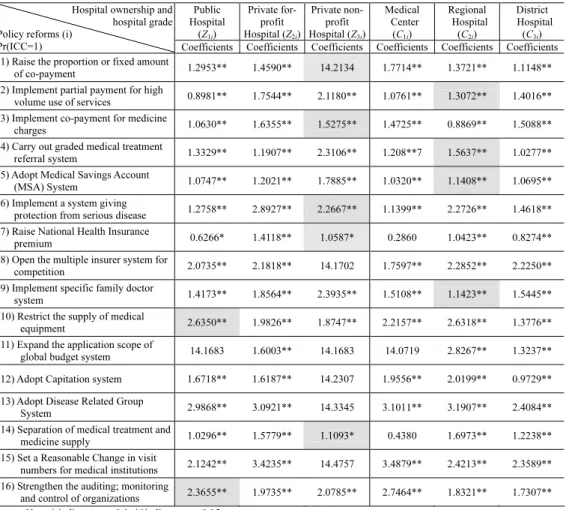
As can be seen in Table 6, (i) private for-profit providers expressed the highest possibility of controlling internal cost with policy 1, 3, 6, 7, and 14 when compared with the other three groups (i.e., the coefficients are significantly larger among the groups); (ii) public hospital provider groups expressed the highest
expectations of internal cost control on policy 10 and 16, if the respective policies were to be implemented; (iii) private hospital providers (for-profit or non-profit) expressed the highest expectations of controlling internal cost in 13 out of a total 16 policies (except for policies 11 and 16). This suggests that private sector providers feel more vulnerable to the effects of reforms and are also subject to greater institutional pressure due to internal cost controls, compared with public hospital providers. Therefore, hypothesis H3A has been supported.
The government subsidy for public hospitals is probably relevant with regards to the results. The observed relationships can be justified by the greater market competition and hospital mission differences among the different types of hospitals.
Hypothesis H3B
Similar to H3A, this study uses Equation 4 to test Hypothesis H3B.
( )
⎟⎠
⎜ ⎞
⎝
⎛ ∑
=
= =
3 ik 1
1
Pr ICC Cki F δ k Cki , (4)
where C1i indicates medical center; C2i is regional center; and C3i is district hospital;
“local clinics” is the contrast group.
It can be seen from Table 6 that (i) for the medical center group the coefficients were significantly larger for Policy 1, 15 and 16; (ii) for the regional hospital group the coefficients were the largest for Policy 4, 5, 6, 7, 8, 10, 11, 12, 13 and 14.
These findings suggest that regional hospital providers face higher pressure from internal cost controls than medical centers under these policies. This result also reflects the fact that regional hospitals in Taiwan tend to expand their number of beds as well as equipment to develop themselves into medical centers. In sum, among the 16 policy items, large hospital providers (medical centers and regional hospitals are included) expressed the greatest expectation of controlling internal cost in response to 13 policies. Therefore, hypothesis H3B has been supported.
4. CONCLUSIONS
Physicians’ viewpoints have often been considered to be important and helpful in the explanation of the wide variation in physicians’ behaviors under hospital characteristics. The problems faced by a health care system are inherent in the way the health care services are organized and financed (Eckerlund, 1989). This paper investigated the acceptability of health policy reforms correlated with provider’s perceptions of the policy’s impact on “overall health services utilization,” “changes in internal cost control,” and “changes in quality of services”
and examined the internal cost control effects in different hospital grades.
The empirical study found that (1) there are significant differences on the degrees of acceptabilities of policies 4, 5, 8, 10, 11, 15 between public and private hospitals; (2) there are significant differences on the degrees of acceptabilities of
policies 3, 4, 5, 8, 10, 11, 14, 15, 16 among medical center and regional hospitals, district hospitals, and local clinics. The findings generally support the conclusion that both hospital ownership and hospital grade differed significantly on acceptability of demand-side and supply-side policies. But most of them are on supply side policy (i.e., policies 8, 10, 11, 14, 15, 16). It clearly indicates incentive conflicts driven by their attempt to consolidate their positions of power depending on their hospital characteristics and strategies to capture market share; (3) among the 16 policy reforms, larger hospitals (medical centers and regional hospitals are included) expressed the greatest expectation of controlling internal cost in response to 13 policies.
Table 6. Differences in expectation of increase in internal cost control in response to the policy by hospital ownership and hospital grade
Public Hospital
(Z1i)
Private for- profit Hospital (Z2i)
Private non- profit Hospital (Z3i)
Medical Center (C1i)
Regional Hospital (C2i)
District Hospital
(C3i) Hospital ownership and
hospital grade Policy reforms (i)
Pr(ICC=1) Coefficients Coefficients Coefficients Coefficients Coefficients Coefficients (1) Raise the proportion or fixed amount
of co-payment 1.2953** 1.4590** 14.2134 1.7714** 1.3721** 1.1148**
(2) Implement partial payment for high
volume use of services 0.8981** 1.7544** 2.1180** 1.0761** 1.3072** 1.4016**
(3) Implement co-payment for medicine
charges 1.0630** 1.6355** 1.5275** 1.4725** 0.8869** 1.5088**
(4) Carry out graded medical treatment
referral system 1.3329** 1.1907** 2.3106** 1.208**7 1.5637** 1.0277**
(5) Adopt Medical Savings Account
(MSA) System 1.0747** 1.2021** 1.7885** 1.0320** 1.1408** 1.0695**
(6) Implement a system giving
protection from serious disease 1.2758** 2.8927** 2.2667** 1.1399** 2.2726** 1.4618**
(7) Raise National Health Insurance
premium 0.6266* 1.4118** 1.0587* 0.2860 1.0423** 0.8274**
(8) Open the multiple insurer system for
competition 2.0735** 2.1818** 14.1702 1.7597** 2.2852** 2.2250**
(9) Implement specific family doctor
system 1.4173** 1.8564** 2.3935** 1.5108** 1.1423** 1.5445**
(10) Restrict the supply of medical
equipment 2.6350** 1.9826** 1.8747** 2.2157** 2.6318** 1.3776**
(11) Expand the application scope of
global budget system 14.1683 1.6003** 14.1683 14.0719 2.8267** 1.3237**
(12) Adopt Capitation system 1.6718** 1.6187** 14.2307 1.9556** 2.0199** 0.9729**
(13) Adopt Disease Related Group
System 2.9868** 3.0921** 14.3345 3.1011** 3.1907** 2.4084**
(14) Separation of medical treatment and
medicine supply 1.0296** 1.5779** 1.1093* 0.4380 1.6973** 1.2238**
(15) Set a Reasonable Change in visit
numbers for medical institutions 2.1242** 3.4235** 14.4757 3.4879** 2.4213** 2.3589**
(16) Strengthen the auditing; monitoring
and control of organizations 2.3655** 1.9735** 2.0785** 2.7464** 1.8321** 1.7307**
Note. * indicates p < 0.1; **indicates p < 0.05.
Some policy implications of this study are: (1) providers both in the private sector and clinics have a higher degree of acceptability to the policy ‘Carry out graded medical treatment referral system’. This is because people tend to seek medical treatment from larger hospitals or general practitioners. Therefore, the medium-sized and small hospitals advocate implementing the referral system to increase their medical service. (2) Larger hospitals have a significantly lower degree of acceptance than local clinics on “expand the application scope of global budget system” policy. The reason is that the NHI is in the process of transitioning from an expenditure-objective system to a maximum-limit system (global budgeting). (3) The NHI sets up a partial user-pay system, in line with the medical network plans, to restrict the growth in the demand for hospitals and high-tech medical services. Meanwhile, the Bureau set up an auditing system to prevent overstatement and misrepresentation of health-care cases. This is the reason why larger sectors dislike policy 10 (restrict the supply of medical equipment). (4) Ownership structure is another important determinant of the providers’ internal cost control, since it affects how the system is managed and controlled.
Private-for-profit hospitals are under higher pressure due to internal cost control than private non-profit hospitals. The private hospitals are subject to greater influence by public health policies and are subject to higher pressure under internal cost control than the public hospital. Private hospitals, generally more financially sensitive, are expected to be more responsive to the incentives embedded in insurance systems. As Abel-Smith (1984) argued, public ownership ensures easier cost control since it allows the government to finance the facilities on a budget basis as well as to use direct administrative controls to coordinate health services. A large share of public ownership makes planning more politically feasible.
Future research may focus on: (1) evaluating the utilization of health care performance; (2) assessing fairly the need versus demand issue, what constitutes optimal care, and (3) finding a point of equilibrium in producing the optimal system of health care for the public, and to construct the “Global Budgeting Pie” of Taiwan’s National Health Insurance.
APPENDIX 1
The sixteen policy instruments are described in detail as follows:
(1) Raise the proportion or fixed amount of copayment
Proportion or Fixed Amount of Copayment: To closely control medical expenses for every patient seeking medical services, the Health Insurance Bureau sets the patient’s share or fixed amount of insurance premium to be paid out-of-pocket by health care consumers (e.g. currently, an outpatient of a foundation hospital has to pay NT$50 for each visit, and an outpatient of a medical center, NT$150).
(2) Implement higher partial payment for heavy user of medical services
Higher Partial Payment for Heavy Users of Medical Services: A higher sharing proportion or fixed amount is charged for those who use the health
insurance for more than a certain number of times within a year (For example, when a patient has used health insurance for 49 times or more, the partial payment to be shared by that patient for further services at the foundation hospitals and medical centers will increase by NT$50 per visit).
(3) Implement co-payment of medicine charges
Partial Payment of Medicine Fee: Each time a patient seeks medical treatment, the Health Insurance Bureau requires that a shared proportion of, or a fixed amount for, the medicine fee be paid by the user (e.g., according to the current system, when the medicine fee exceeds NT$100, the patient has a co-pay NT$20.).
(4) Carry out Graded Medical Treatment Referral System
Graded Medical Treatment Referral System: According to the regulations of the government, whenever a citizen wants medical service, he/she must seek initial care from a local hospital (clinic). Depending on the health condition, the patient may be referred to hospitals at higher grades (in the order of district hospital - regional hospital - medical center).
(5) Adopt Medical Savings Account (MSA) System
Medical Savings Account (MSA) System: The method of payment for premium remained unchanged. However, on the basis of age, sex, risk factors, etc., the Health Insurance Bureau appropriates a certain amount of money and pools it into a “Personal Medical Savings Account” to pay for his/her medical expenses or for his/her kin. Surplus balances can be retained for future use, or can even become a legacy for dependents.
(6) Implement a System That Protects Patients with Serious Disease Conditions A System That Protects Patients with Serious Disease Conditions: Individuals are not required to pay any premium. The government will set a certain amount of money as the maximum amount (e.g., NT$10,000 per year), which the insured person has to pay. Each year the BNHI will pay the rest.
(7) Raise the National Health Insurance premium
Raise the Premium of National Health Insurance: Raise the monthly premium to be paid by every citizen.
(8) A Multiple Insurer System
Multiple Insurer System: For the same rate of premium to be borne by the insured, all private insurance companies are allowed to compete and bid for the business now operated by the Bureau of Health Insurance. To meet their individual needs and preferences, individuals can choose a specific insurer to buy insurance from and seek medical service from a hospital under contract with that insurance company.
(9) Implement specific family doctor systems
Family Doctor System: The government requires all citizens to choose one family doctor from whom they seek medical service whenever needed. If an illness cannot be treated/cured by the family doctor, the patient will then be transferred elsewhere, usually to a specialist.
(10) Restrict the supply of medical equipment
(11) Expand the application scope of Global Budget System
Global Budget System: A certain grade of budget is first negotiated and decided on between the insurance organization and suppliers of medical services, for each category of medical care specified as required for a particular type of illness for a certain period of time. That budget is then appropriated to the organization of the medical service suppliers, which in turn will carry out their internal allocation of the budget. Currently this system is implemented in the dentistry and Chinese medical departments. This system is still under planning for the western medical departments.
(12) Adopt Capitation System
Capitation System: Based on the number of the insured and the medical needs of the insured in terms of their attributes (e.g. age, health condition and sex, etc.), the Health Insurance Bureau decides the total amount of medical services for the year to be paid to the medical service suppliers in advance.
(13) Adopt Diagnosis-Related-Group (DRG) System
Disease-Related Groups (DRG) System: The payment of medical expenses to medical service suppliers, by the Health Insurance Bureau, is based on the number of medical cases with medical treatment completed. The payment contents and the standard of payment are classified according to the case-mix.
(14) Separate medical treatment from medicine supply (15) Set a reasonable visit numbers for medical institutions
Reasonable Numbers of Visits: The Health Insurance Bureau specifies a limit to the number of daily outpatients permitted for each doctor. If the limit is exceeded, the payment for the excess patients will be reduced. For example, according to the currently drafted policy, in the future each and every doctor of a “regional hospital”
can provide medical services to only 18 patients per day, and every doctor of
“medical center” can provide medical services to only 5 patients per day. The payment for the excess patients will be reduced to half.
(16) Strengthen the auditing; monitoring and control of medical institutions Auditing, Monitoring and Control of Medical Organizations: The Health Insurance Bureau will periodically examine the reports on the process of medical services provided by medical organizations in order to make sure patients receive the most suitable medical treatment and that the misallocation of medical resources is avoided.
REFERENCES
Aaron, H. J. (1992). Equity in the Finance and Delivery of Health Care. Journal of Health Economics, 11, 467-471.
Abel-Smith, B. (1984). Who Is The Odd Man Out? The Experience of Western Europe in Containing the Costs of Health Care. Milbank Memorial Fund Quarterly, 63, 1-17.
Anderson, O. D. (1972). Health Care: Can There Be Equality? The United States, Sweden and England. New York, USA: John Wiley and Sons.
Anderson, R. M., Rice, T. H., & Kominski, G. F. (1996). Changing the U.S. Health Care System. New York, USA: Jossey-Bass Inc.
Arrow, K. (1963). Uncertainty and the Welfare economics of Medical Care.
American Economic Review, 53, 941-973.
Bureau of National Health Insurance, Department of Health, Executive Yuan, R.O.C [BNHI] (2001). Background Information.
Bureau of National Health Insurance, R.O.C. (1999; 2003; 2005; 2008), National Health Insurance Annual Statistical Report, June (in Chinese).
Culyer, A. J. (1993). Equity and Equality in Health and Health Care. Journal of Health Economics, 12, 431-457.
Department of Health, the Executive Yuan, R.O.C. (1997). The First Two Years Evaluation Report on National Health Insurance, Taipei, Taiwao, 1997, 102.
Eckerlund, H. S. (1989). Variations in Resource Utilization--the Role of Medical Practice and Its Economic Impact. Social. Science. Medical, 28(2), 165-73.
Edward, G. C., & Richard, A. Z. (1979). Reliability and Validity Assessment.
London, UK: Sage Publications, Inc., Series/No. 07-017, 9-29.
Ellis, R. P., & McGuire, T. G. (1990). Optimal Payment Systems for Health Services. Journal of Health Economics, 9, 375-396.
Ellis, R. P., & McGuire, T. G. (1991). Optimal Payment Systems for Health Services.
Amsterdam, the Netherland: Elsevier Science Publishers.
Ellis, R. P., & McGuire, T. G. (1993). Supply-Side and Demand-Side Cost Sharing in Health Care. Journal of Economic Perspectives, 7(4), 135-151.
Evans, R. G. (1991). Supplier-induced Demand: Some Empirical Evidence and Implications. In A. J. Culyer (Ed.), The Economics of Health Behavior, International Library of Critical Writings in Economics (pp. 66-77). Aldershot, UK, and Brookfield, VT: Edward Elgar Publishing, 2 (12), 66-77.
Feldstein, M. (1970). The Rising Price of Physician Services. The Review of Economics and Statistics, 52(2), 121-133.
Hadley, J. (1996). Financial Pressure and Competition Changes in Hospital Efficiency and Cost-Shifting Behavior. Medical Care, 34(3), 205-219.
Kravitz, R. L., & Greenfield, S. (1995). Variations in Resource Utilization Among Medical Specialties and Systems of Care. Annual Rev Public Health, 16, 431-45.
Labelle, R., Stoddard, G., & Rice, T. (1994). A Re-Examination of the Meaning and Importance of Supplier-Induced Demand. Journal of Health Economics, 13, 347-368.
Liang, K. -S. (1999). Memorial Conference. Sponsored by the Department of Economics, National Taiwan University, 1-2 October, Taipei, Taiwan.
Maddala, G. S. (1983). Limited-Dependent and Qualitative Variables in Econometrics. New York, USA: Cambridge University Press.
Mooney, G., (1986). Economics of Health Including Medical Subsidy Programs Brighton, UK: Harvestor Press, Wheatsheaf Books; Atlantic Highlands, NJ, USA: Humanities Press International, xxi, 171.
Nunnally, J. C. (1978). Psychometric Theory. New York, USA: McGraw-Hill.
Pauly, L. (1991). Physician Response to Fee Changes with Multiple Payers.
University of Western Ontario Papers in Political Economy, 11, 43.
Shi, L. (1996). Patient and Hospital Characteristics Associated with Average Length of Stay. Health Care Manage Rev., 21(2), 46-61.
Siegel, C. (1992). A risk-based Prospective Payment System that Integrates Patient, Hospital and National Costs. Journal of Health Economics, 11, 1-41.
Yaung, C. L. (1998). The Health Insurance. Taipei, Taiwan: Jiuh Liou Publishing Company. (in Chinese).
Tein-Cheng Chien received the Ph. D. in the Department of Health Administration, Norman J. Arnold School of Public Health, University of South Carolina;
USA. He is the chairman of Taiwan Association of Oral Health Care Management and Chief Executive Officer for Premier Hospital Consultant Group. His research and publications are in the areas of oral health care management and National Health Insurance policy evaluation, etc.
Hsiu-Li Chen is an associate professor of International Business at Ming Chuan University in Taipei.
Her research and publications are in the areas of marketing management and consumer behavior. She can be contacted at: hlchen@mcu.edu.tw.