CHAPTER IV RESULTS
After statistical analysis, the results corresponded to the research questions mentioned in Chapter I. They were:
Question 1: What is the general situation regarding expatriates’ perceptions of pre-departure training programs in Taiwan?
Question 2: What is the general situation regarding Taiwanese expatriates’ adjustment in China?
Question 3: Is there any relationship between expatriates’ perceptions on cultural training before assignments and the expatriates’ adjustment to work, interactions with host nationals, and to the general non-work environment?
Question 4: Is there any relationship between expatriates’ perceptions of language training before assignments and the expatriates’ adjustment to work, interactions with host nationals, and to the general non-work environment?
Question 5: Is there any relationship between expatriates’ perceptions of practical training before assignments and the expatriates’ adjustment to work, interactions with host nationals, and to the general non-work environment?
Question 6: Is there any relationship between expatriates from different backgrounds and their adjustment to work, interactions with host nationals, and to the general non-work environment?
The following presents the response condition, the instrument reliability, the descriptive statistics regarding the participants, and the description and results to each research question mentioned.
Response Condition
The respondents were mainly from A company and B company. All the respondents were then in China. The number of expatriates in A company was 38.
Among them, 16 people responded. The response rate was 42%. The number of expatriates in B company was 35. Among them, 15 people responded. The response rate was 43%. For the only one invalid questionnaire, the respondent answered only Part I of the questionnaire. He did not answer other questions. Therefore, the researcher counted it as invalid.
Table 4.1. Response rate from A and B company Company Number
of subjects
Returned numbers
Invalid questionnaires
Total response rate
Valid response rate
A 38 16 1 42% 39%
B 35 15 0 43% 43%
Total 73 31 1 42% 41%
Instrument Reliability
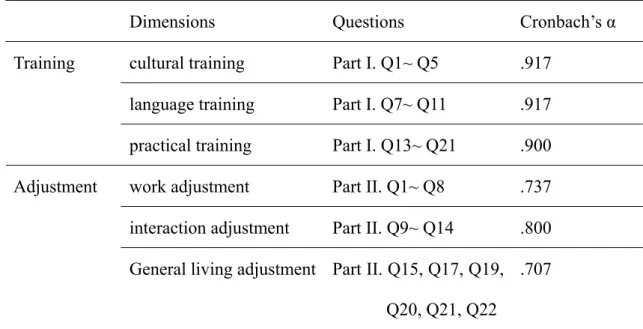
Table 4.2 shows the reliability of each dimension of the questionnaire. For the dimension of training, three of them have high reliability. The Cronbach’s α were all above .900. For the dimension of adjustment, the Cronbach’s α is low compared to the dimension of training. Since the reliability of the questions for general living adjustment was the lowest compared to other factors, the researcher ran the SPSS
higher. After statistical analysis, the researcher maintained questions Q15, Q17, Q19, Q20, Q21, and Q22 in Part II. These questions had higher Cronbach’s α= .707. Thus, the researcher only ran these six questions and that this study was based on reliable questions in each dimension. Thus, the dimension of adjustment has higher Cronbach’s α. All of the Cronbach’s α are higher than .707. Appendix E. contains more details for the reliability of each item of the questionnaire.
Table 4.2. Reliability of each factor
Dimensions Questions Cronbach’s α
cultural training Part I. Q1~ Q5 .917 language training Part I. Q7~ Q11 .917 Training
practical training Part I. Q13~ Q21 .900 work adjustment Part II. Q1~ Q8 .737 interaction adjustment Part II. Q9~ Q14 .800 Adjustment
General living adjustment Part II. Q15, Q17, Q19, Q20, Q21, Q22
.707
Descriptive Statistics of Participants
Distribution of respondents, by age
Table 4.3. shows the distribution of each respondents’ age. Most of the respondents are from 41 to 50 years old (46.7%). The majority of the remainder are from 31 to 40 years old (36.7%). Other distributions measured are 30 and younger (13.3%), 51 and older (3.3%). Most respondents were located in the age range of 31-50. This included more than 83.4% of the total respondents.
Table 4.3. Distribution of respondents, by age
Age n %
≤ 30 4 13.3
31-40 11 36.7
41-50 14 46.7
≥ 51 1 3.3
Total 30 100.0
Distribution of respondents, by gender
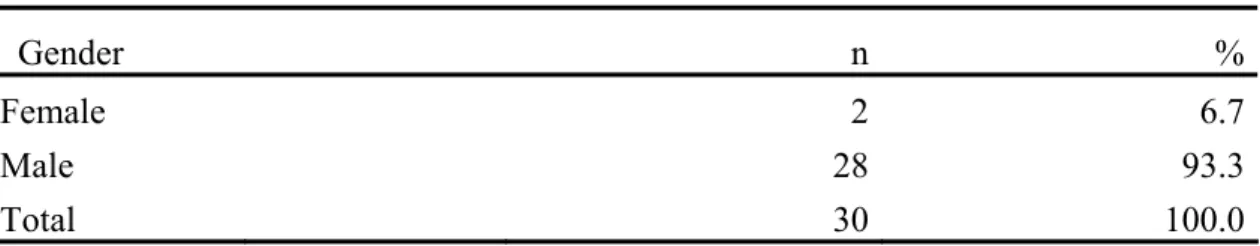
Most of the respondents were male. There were 28 male respondents (93.3%).
There were only 2 female respondents (6.7%). For the respondents of these two companies. The number of males is much larger than the number of females. Table 4.4 shows the distribution of respondents by gender.
Table 4.4. Distribution of respondents, by gender
Gender n %
Female 2 6.7
Male 28 93.3
Total 30 100.0
Distribution of respondents, by marriage status
Most of the respondents were married. That 22 respondents were married (73.3%) and 8 respondents were not married (26.7%) shows that most respondents were married while on expatriation assignments. Table 4.5 shows the distribution of the marriage status of respondents.
Table 4.5. Distribution of respondents, by marriage status
Marriage Status n %
Married 22 73.3
Unmarried 8 26.7
Total 30 100.0
Distribution of respondents, by education level
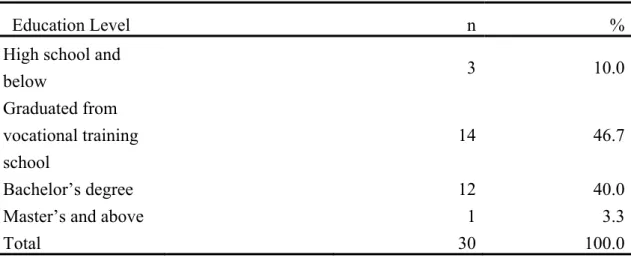
About 14 respondents (46.7%) were graduated from vocational schools. Twelve people (40%) had bachelor’s degree. Only 3 people (10%) were high school educated and below. And, only one person (3.3%) had master’s degree or above. For the respondents, most people (86.7%) were graduated from vocational training school or from colleges or universities. The percentage of each education level is in Table 4.6.
Table 4.6. Distribution of respondents, by education level
Education Level n %
High school and
below 3 10.0
Graduated from vocational training school
14 46.7
Bachelor’s degree 12 40.0
Master’s and above 1 3.3
Total 30 100.0
Distribution of respondents, by industry
All the respondents are in manufacturing industry. Due to having accurate result, the researcher tried to choose target sample, who are all in the manufacturing industry.
Thus, the result would not be biased because of different industries. The confounding factors would be fewer.
Distribution of respondents, by department
Regarding the departments of each respondent, about 7 people (23.3%) are in R&D and 7 people (23.3%) are in finance. Six people (20%) are in the manufacturing department. Only 2 people (6.7%) are in the human resources department. The percentage of the people in departments of manufacturing, R&D, and finance is up to 66.6%. Table 4.7 shows the distribution of respondents’ departments.
Table 4.7. Distribution of respondents, by department
Department n %
Others 4 13.3
Human resources 2 6.7
Manufacturing 6 20.0
R&D 7 23.3
Finance 7 23.3
Marketing 4 13.3
Total 30 100.0
Distribution of respondents, by status
There are 15 people in upper-class management (50%). Eleven people are in middle-class management (36.7%). Only 2 people are first line supervisors (6.7%) and 2 people are employees (6.7%). The percentage of people in middle-class and upper-class management is 86.7%. Table 4.8 shows the distribution of respondents by employee status.
Table 4.8. Distribution of respondents, by employee status
Employee Status n %
Employee 2 6.7
First line supervisors 2 6.7
Middle-class managers 11 36.7
Upper-class managers 15 50.0
Total 30 100.0
Distribution of respondents, by working years
Sixteen people have worked more than ten years (53.3%). Exactly 60% of the respondents have worked more than nine years. Seven people have worked for 3-4 years (23.3%). Exactly 26.6% of respondents have worked fewer than four years.
Table 4.9 shows the distribution of working years of respondents.
Table 4.9. Distribution of respondents, by working years
Working Years n %
1-2 years 1 3.3
3-4 years 7 23.3
5-6 years 3 10.0
7-8 years 1 3.3
2 6.7
9-10 years
> 10 years 16 53.3
Total 30 100.0
Distribution of respondents, by working years in China
Nine people have worked in China for 1-2 years (30%). Another 9 people have worked in China for 3-4 years (30%). Five people have worked in China for less than one year (16.7%). Only one person has worked in China for 5-6 years (3.3%). Exactly 76.7% of people have not worked in China longer than four years.
Table 4.10. Distribution of respondents, by working years in China
Working Years in China n %
< 1 year 5 16.7
1-2 years 9 30.0
3-4 years 9 30.0
5-6 years 1 3.3
7-8 years 2 6.7
2 6.7
9-10 years
> 10 years 2 6.7
Total 30 100.0
Distribution of respondents, by if have studied abroad
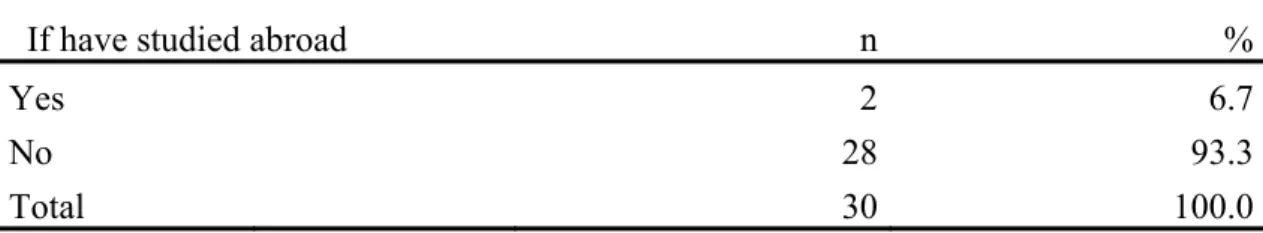
Exactly 28 respondents have not studied abroad before (93.3%). Only 2 people have the experience studying abroad previously (6.7%). The majority of the respondents do not have the experience studying abroad before their expatriation assignments. Table 4.11 shows the distribution of the respondents’ experience of studying abroad.
Table 4.11. Distribution of respondents, by if they have studied abroad
If have studied abroad n %
Yes 2 6.7
No 28 93.3
Total 30 100.0
Distribution of respondents, by if have worked abroad
From Table 4.12, it shows that 24 respondents (80%) have not worked abroad.
Only 6 respondents (20%) have worked abroad. The majority of the respondents do not have the experience of working abroad before the expatriation assignment.
Table 4.12. Distribution of respondents, by if have worked abroad
If have worked abroad n %
Yes 6 20.0
No 24 80.0
Total 30 100.0
Distribution of respondents on if there is pre-departure formal cultural training
Table 4.13 shows the distribution of respondents’ perceptions regarding if there was pre-departure formal cultural training. The majority of respondents disagreed that there was formal training (60%). Nine people had neutral opinions (30%). Three people very much disagreed that there was formal cultural training (10%). Exactly 70% of the respondents did not think they had formal pre-departure cultural training.
No respondents agreed that they had formal pre-departure cultural training while 30%
of the respondents held neutral opinions.
Table 4.13. Perception of employees on if there is pre-departure formal cultural training
Agreement n %
Very disagree 3 10.0
Disagree 18 60.0
Neutral Opinion 9 30.0
Agree 0 0
Very Agree 0 0
Total 30 100.0
Distribution of respondents on if there is pre-departure formal language training
Table 4.14 shows the distribution of respondents’ opinions on if there was pre-departure formal language training. The majority of respondents disagreed that there was formal language training (60%). Five respondents very much disagreed that there was formal language training (16.7%). Six respondents had neutral opinions
(20%). Only 1 person agreed there was language training (3.3%). Exactly 76.7% of the respondents did not agree that they had formal pre-departure language training for expatriation assignments, while 20% of the respondents held neutral opinions.
Table 4.14. Perception of employees on if there is pre-departure formal language training
Agreement n %
Very disagree 5 16.7
Disagree 18 60.0
Neutral Opinion 6 20.0
Agree 1 3.3
Very Agree 0 0
Total 30 100.0
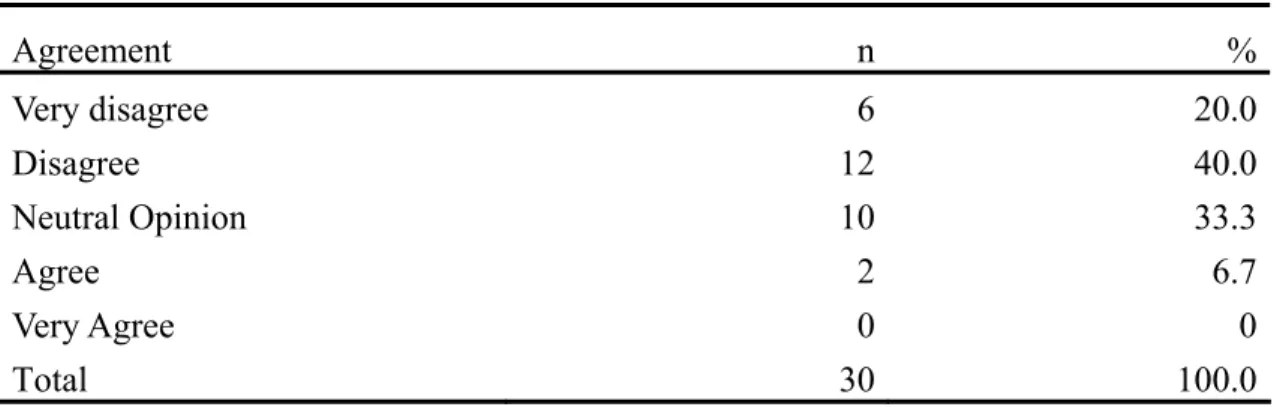
Distribution of respondents on if there is pre-departure formal practical training
Table 4.15, it shows that 12 people (40%) disagreed that there was formal pre-departure practical training. Six people (20%) very much disagreed that there was formal practical training. Ten people (33.3%) had neutral opinions. Only 2 people agreed there was formal practical training (6.7%). Exactly 60% of the respondents did not agree there was formal pre-departure practical training, while 33.3% of the respondents held neutral opinions.
Table 4.15. Perception of employees on if there is pre-departure formal practical training
Agreement n %
Very disagree 6 20.0
Disagree 12 40.0
Neutral Opinion 10 33.3
Agree 2 6.7
Very Agree 0 0
Total 30 100.0
Findings on Research Questions
Below present the findings of each research question regarding the relationship between respondents’ perceptions of pre-departure training programs and their subsequent adjustment.
Description for respondents on perceptions of training programs
Table 4.16, which displays the responses of respondents on different kinds of training programs shows that most of the respondents do not perceive that they have received formal training programs. The mean is low representing the situation of the respondents from these two companies. Respondents do not perceive formal and complete pre-departure training programs. It indicates that most companies still do not offer formal pre-departure training for employees for expatriation assignments. After interviewing some respondents in these two companies and also some other interviewees from other companies, it is clear to the author that Taiwanese companies do not offer very much formal pre-departure training.
Regarding the training programs, companies offer different training programs according to relative importance. For cultural training and language training, even
though China and Taiwan are different in some aspects, other aspects are similar one another after all. For the speaking or writing of Chinese, even though there are some differences between traditional and simplified Chinese, generally speaking, most Chinese words are similar. Without training, most words both spoken and written can be recognized by Taiwanese people. Therefore, most companies do not offer cultural and language training very much as is clear from the responses of the participants (Part I. Q1~ Q12), and is illustrated by the fact that most means of the questions are low.
As for practical training, companies emphasize this part. Since employees were sent to China for expatriation assignments, their basic needs are even more important as expatriates; for example, how to live in China, how to rent an apartment, how to dial back to Taiwan, how to register for cell phone, where to shop, where to eat, how to open a bank account. These questions are necessary for expatriates to have answers.
Therefore, the means for the responses regarding practical training are generally higher than other responses in cultural and language training (Part I. Q15, Q19, Q21).
The responses indicate the general perception of respondents’ situation currently.
From the means of each question in Part I of the questionnaire, the information shows that most means are low, which illustrates that expatriates did not have positive perceptions of formal pre-departure training programs. Most responses to the questions in Part I are below the average scores. They range from 2.10 to 3.60.
However, there are three of the questions above the average score. They are Q15 (M = 3.13, SD = 1.01), Q19 (M = 3.60, SD = .97), and Q21 (M = 3.03, SD = 1.03).
Part I Q15 is about whether the company offered ways for expatriates to protect company’s property and also expatriates’ safety. Q19 asks if companies offered the information about how to rent apartments, how to have cell phones or how to have a
do the grocery shopping etc.
Table 4.16. Means and standard deviations for each item of the questionnaire in Part I
Items Variables n M SD
part1 Q1 c1 30 2.77 1.01
part1 Q2 c2 30 2.43 .86
part1 Q3 c3 30 2.17 .79
part1 Q4 c4 30 2.63 .89
part1 Q5 c5 30 2.37 .85
part1 Q6 c6 30 2.20 .61
part1 Q7 l1 30 2.53 .90
part1 Q8 l2 30 2.53 .90
part1 Q9 l3 30 2.57 1.01
part1 Q10 l4 30 2.13 .68
part1_Q11 l5 30 1.93 .58
part1_Q12 l6 30 2.10 .71
part1 Q13 p1 30 2.90 1.06
part1 Q14 p2 30 2.47 .97
part1 Q15 p3 30 3.13 1.01
part1 Q16 p4 30 2.63 .93
part1 Q17 p5 30 2.73 1.14
part1 Q18 p6 30 2.60 .89
part1 Q19 p7 30 3.60 .97
part1 Q20 p8 30 2.40 1.00
part1 Q21 p9 30 3.03 1.03
part1 Q22 p10 30 2.27 .87
Description for respondents on adjustments
There are three types of adjustments in the study: adjustment to work, to interactions with host nationals and to the general living environment in China. The means from respondents shown in Table 4.17 show that most respondents adjusted to Chinese people, work, and environment. The means are not very high but in general, the means stay neutral (M = 2.33~3.73), which means that expatriates do not think adjust to China is difficult.
For adjustment to work, most respondents can adjust to work well (Part II. Q2 - Q6). They could adjust to their work and control the content of their work. They are satisfied with their performance. However, some thought they do not agree with the attitudes regarding work of Chinese people, but generally, they can handle the work and do it well.
As for adjusting to interactions with host nationals, most respondents replied that they adjusted to interactions with host nationals well. They adjusted to the social customs and got along with host nationals (Part II. Q9, Q10, Q12 - 14). However, some do not agree with the values of Chinese people (Part II. Q11).
Regarding adjustment to the general living environment, basically respondents adjusted to general environment, the food, and shopping places in China (Part II. Q15, Q17, Q22). However, most did not adjust to entertainment activities in China (Part II.
Q19). And most did not adjust to the sanitation situation in China (Part II. Q21). Most answers to the questions range from neutral opinions to agreement.
There are three types of adjustments: work adjustment, interaction adjustment and general living adjustment. In this part, there are 24 questions. Regarding the points, which indicated Likert’s scale point 1 to 5, if the study counts respondents to be satisfied while they adjust to China, the points should be above 3.4. Within these
that most respondents did not consider that they adjust to China well.
Table 4.17. Means and standard deviations for each item of the questionnaire in Part II
Items Variables n M SD
part2 Q1 wa1 30 2.33 .96
part2 Q2 wa2 30 3.47 .63
part2 Q3 wa3 30 3.70 .65
part2 Q4 wa4 30 3.77 .50
part2 Q5 wa5 30 3.67 .55
part2 Q6 wa6 30 2.63 .81
part2 Q7 wa7 30 2.77 .97
part2 Q8 rwa8 30 2.13 1.01
part2 Q9 ia1 30 3.30 .65
part2 Q10 ia2 30 3.20 .61
part2 Q11 ia3 30 2.90 .61
part2 Q12 ia4 30 3.33 .61
part2 Q13 ia5 30 3.73 .64
part2 Q14 ia6 30 3.73 .79
part2 Q15 ga1 30 3.43 .77
part2 Q16 ga2 30 2.83 .79
part2 Q17 ga3 30 3.57 .68
part2 Q18 ga4 30 2.23 .57
part2 Q19 ga5 30 2.63 .81
part2 Q20 rga6 30 2.77 .90
part2 Q21 rga7 30 3.13 .97
part2 Q22 rga8 30 2.90 .80
part2 Q23 ga9 30 3.60 .56
Correlations for perceptions on training programs and expatriates’ adjustments
After running Pearson correlation by SPSS12.0 windows version, on the data in Table 4.18, it did not show the significance. Each training programs did not have correlation with each other adjustments in this study. From the descriptive statistics on the training part of the questionnaire, the number is small, which means that most respondents did not perceive pre-departure training programs on cultural, language or practical training to be complete. However, the mean on questions of their adjustment was not really low. From some respondents, they offered that they did not perceive much training.
Table 4.18. Pearson correlation of training programs and different types of adjustments (n=30) Adjustment
Work Interaction General living
Training Cultural r -.005 -.030 -.058
Language r -.096 .037 .102
Practical r .249 .211 .288
*p<.05, **p<.01
Correlations for each item for perceptions on training programs and expatriates’
adjustments
In order to see the correlation between adjustments and each question of the questionnaire, Pearson correlation was run again. Table 4.19 presents the results of these adjustments on each item of the questionnaire on cultural, language and practical training part. According to the table on cultural training, there was not any significance.
Regarding the language training part, there was not any significance shown on the correlation between each item of language training and adjustments.
Pearson correlation was used again on the correlation between questions of practical training and adjustments. Four items showed significance. They are “Part I.
Q16, work adjustment”, “Part I. Q19, work adjustment”, “Part I. Q15, interaction adjustment”, and “Part I. Q19, general living adjustment”. All these items regard perceptions on practical training.
The reason all the questions are on practical training is that companies offered more information on how to live in China and how to solve problems if they face difficulties. Generally, the mean of questions on perceptions of practical training is higher than perceptions on other two training programs.
In Part I. Q16 (r = .462, p = .010), the question is about if the company offered certain people in China for expatriates to look for if expatriates encounter problems.
This item positively correlates with work adjustment. From the interview with the respondents, if companies offer certain information for expatriates to look for when they need help, it helps expatriates adjust to work more.
For Part I. Q19 (r = .416, p = .022), the question asks respondents if the company offers the information on how to live in China. For example, how to rent an apartment, how to register for cell phones, how to open a bank account etc. Generally, the mean for this question is high. Respondents perceived these kinds of training programs and they adjusted to work better.
For Part I. Q15 (r = .410, p = .025), the question is about if the company offered ways for expatriates to protect themselves and also company’s property. Respondents thought that companies offered ways to protect personal safety and also the company’s property and meanwhile the expatriates adjusted to interaction with host nationals better.
For Part I. Q19 (r = .450, p = .013), the question asks respondents if the company offers the information on how to live in China. For example, how to rent an apartment, how to register for cell phones, how to open a bank account, etc. Expatriates thought
China better. These are positively correlated.
Table 4.19. Pearson Correlation of each item on perceptions of training programs and different types of adjustments (n = 30)
adjustment
Work Interaction General living
Training Cultural Part I. Q1 r .004 -.032 .042
Part I. Q2 r .091 -.139 -.099
Part I. Q3 r -.164 -.220 -.071
Part I. Q4 r -.113 .129 -.071
Part I. Q5 r .151 .114 -.066
Language Part I. Q7 r -.198 -.003 .069
Part I. Q8 r -.115 .149 .117
Part I. Q9 r -.087 .156 .117
Part I. Q10 r -.038 -.088 .107
Part I. Q11 r .086 -.162 .012
Practical Part I. Q13 r -.056 .218 .231
Part I. Q14 r .202 .054 .127
Part I. Q15 r .195 .410* .180
Part I. Q16 r .462* .204 .296
Part I. Q17 r .216 .170 .130
Part I. Q18 r .243 .075 .219
Part I. Q19 r .416* .159 .450*
Part I. Q20 r .061 .020 .163
Part I. Q21 r -.011 .094 .160
*p < .05, **p < .01
T test and one-way ANOVA on work adjustment for different backgrounds of respondents
For the work adjustment, the result is different according to the different backgrounds of respondents. Table 4.20 presents the general depiction of each components of background part.
After independent sample t test for each group of respondents according to different backgrounds, there is one component with the marginal significance. It is employee status. Others do not show significance. For employee status, according to the result, the respondents who are in upper-class management or above adjusted to work better than those who are in middle-class management or below (t = -1.955, p
= .061).
Of the respondents, people who are in upper-class management or above adjusted to work better than those in middle-class management or below. People who are in upper-class or above always have worked longer than others in middle-class or below. They have more experience. They adjusted to work better as a result.
As for other components, it shows that for most of them, the means and standard deviations are not much different from each group. Therefore, there is no significance for other components. Even though there are differences in respondents’ backgrounds and they were divided into groups, because the answers to the questions are similar, there is not any significance to the result.
Table 4.20. The general depiction of background of respondents, for working adjustment
components groups n Mean SD t p
age ≤40 15 25.80 3.90 -.583 .565
>40 15 26.60 3.62
Marriage status
Married 22 26.45 3.67 .615 .543
Unmarried 8 25.50 4.00
Education level
Graduated from vocational school or
below
17 25.59 4.39 -1.105 -1.412
Have bachelor’s degree or above
13 27.00 2.55
Employee status
Middle-class managers or below
15 24.93 3.65 -1.955 .061
Upper-class managers or above
15 27.47 3.44
working years
≤10 14 26.07 4.58 -.169 .867
>10 16 26.31 2.92
working years in china
≤2 14 25.43 3.76 -1.066 .296
>2 16 26.88 3.67
*p < .05, **p < .01
Table 4.21 presents the general depiction of different departments of respondents.
After one-way ANOVA for different departments of respondents on work adjustment, the result did not show the significance. There was no significance of differences between different departments on working adjustment.
Table 4.21. The general depiction of departments of respondents, for working adjustment
groups n Mean SD F p
Human Resources
2 26.00 7.07 .327 .891
Manufacturing 6 26.00 5.22
Others 4 24.75 4.50
R&D 7 25.57 3.26
Finance 7 27.00 2.89
Marketing 4 27.75 2.22
Total 30 26.20 3.72
*p < .05, **p < .01
T test and one-way ANOVA on interaction adjustment for different backgrounds of respondents
On correlation of interaction adjustment and different backgrounds of respondents, Table 4.22 shows the general depiction of each component of backgrounds of different groups.
After independent sample t test, there was no significance of this part, which means
adjustment in the study. As can be seen from the depiction of means of interaction adjustment, the means from different backgrounds are similar. The respondents from different backgrounds adjusted to interactions with host nationals at similar level.
Most of respondents adjusted to interactions with host nationals well even though they were from different backgrounds.
Table 4.22. The general depiction of background of respondents, for interaction adjustment
components group n Mean SD t p
age ≤40 15 20.27 1.94 .129 .898
>40 15 20.13 3.48
Marriage status
Married 22 20.41 3.03 .679 .503
Unmarried 8 19.63 1.92
Education level
Graduated from vocational school or
below
17 19.82 3.19 -.847 .404
Have bachelor’s degree or above
13 20.69 2.14
Employee status
Middle-class managers or below
15 20.13 1.89 -.129 .898
Upper-class managers or above
15 20.27 3.52
Working years
≤10 14 20.43 2.14 .416 .680
>10 16 20.00 3.29
Table 4.22 (Continued)
components group n Mean SD t P
working yrs in china
≤2 14 20.29 2.02 .156 .877
>2 16 20.13 3.36
*p < .05, **p < .01
After one-way ANOVA on interaction adjustment for responses from different departments, Table 4.23 shows the general depiction of the results. From the table, it can be seen that there was no significance, which means respondents from different backgrounds did not differ from each other on adjustment to interactions with host nationals. From Table 4.23, it can be seen that two respondents in human resource department have lower means (M = 15.00) on interaction adjustment compared to other departments. Respondents from finance departments have higher means (M = 21.43) on interaction adjustment compared to other departments. However, there was no significance shown. Generally speaking, respondents from different department adjusted to interactions with host nationals with no problems.
Table 4.23. The general depiction of departments of respondents, for interaction adjustment
Groups n Mean SD F P
Human Resources 2 15.00 4.24 2.071 .104
Manufacturing 6 20.67 3.50
Others 4 20.25 2.63
R&D 7 19.86 1.57
Finance 7 21.43 1.99
Marketing 4 20.50 2.38
Total 30 20.20 2.77
*p < .05, **p < .01
T test and one-way ANOVA on general living adjustment for different backgrounds of respondents
After independent sample t test for responses from respondents from different backgrounds, the results are presented in Table 4.24. In Table 4.24, one of the items shows significance. This is educational level which is significant (t = -2.116, p = .043).
For respondents who have bachelor’s degrees or above, they adjusted to general living environment in China better than those who were graduated from vocational school or below. All the expatriates were given the same information from the companies.
However, respondents who have bachelor’s degrees or above looked for more information by themselves. They knew more information regarding the situation in China. This explains why respondents with higher educational levels adjusted to general living environment in China better.
Table 4.24. The general depiction of background of respondents, for general living adjustment
components groups n Mean SD t P
age ≤40 15 18.20 3.78 -1.101 .282
>40 15 19.47 2.36
Marriage status
Married 22 18.73 2.39 -.220 .831
Unmarried 8 19.13 4.91
Education level
Graduated from vocational school or
below
17 17.82 2.81 -2.116 .043*
Have bachelor’s degree or above
13 20.15 3.21
Employee status
Middle-class managers or below
15 18.53 3.68 -.513 .612
Upper-class managers or above
15 19.13 2.64
Working years
≤10 14 19.29 4.12 .697 .494
>10 16 18.44 2.07
Working years in
China
≤2 14 18.29 3.91 -.856 .402
>2 16 19.31 2.36
*p < .05, **p < .01
One-way ANOVA was run for respondents from different departments. Table 4.25 shows the significance (F = 3.175, p = .024). After post-hoc was run, it shows that the department of finance adjusted to general living environment better than the department of R&D. According to respondents, most R&D people did not have more experience than people in finance. They were generally younger. Therefore, it showed the significance between respondents in R&D and finance.
Table 4.25. The general depiction of departments of respondents, for general living adjustment
Departments n Mean SD F P Tukey HSD
Human Resources
2 17.50 3.54 3.175 .024*
Finance>R&D (5.143)
Manufacturing 6 20.00 2.28
Others 4 17.50 3.70
R&D 7 16.57 1.99
Finance 7 21.71 3.09
Marketing 4 18.00 2.16
Total 30 18.83 3.16
*p < .05, **p < .01