Historical research into tuberculosis control strategies and the implications of mortality trends in Taiwan
S-J. Chiou,* Y-T. Huang,† J-J. Lee,‡ S-I. Wang,* C-L. Yaung§
*Department of Healthcare Administration, College of Health Science, Asia University, Taichung, † Department of Gerontological Care and Management, Chang Gung Institute of Technology, Taoyuan, ‡ Buddhist Tzu Chi General Hospital, Hualien and Tzu Chi University, Hualien, § Department of Health, Executive Yuan, Taipei, Taiwan
Correspondence to: Shang-Jyh Chiou, Department of Healthcare Administration, College of Health Science Asia University, Taichung, Taiwan. Tel: (+886) 4 2332 3456. Fax: (+886) 4 2332 1206. e-mail: [email protected]
Article submitted 7 August 2010. Final version accepted 12 February 2011.
S E T T I N G : Taiwan.
O B J E C T I V E : To analyse mortality trends to determine whether government organisation structuring and activ- ities of disease control programmes affect outcomes.
D E S I G N : We conducted a Joinpoint regression analysis to identify changes in TB mortality trends from 1971 to 2008 in Taiwan. The annual percentage change (APC) was calculated for the time segments on either side of the Joinpoints. Mortality data were extracted from the cause-of-death registry database of the Taiwanese De- partment of Health.
R E S U LT S : Between 1971 and 1987, the TB mortality rate dropped from 51 per 100 000 population to 13.4/
100 000; during the period 1987–2000, it dropped from 13.4 to 7/100 000, with a lower APC; and from 2000 to 2008, it fell more rapidly, from 7 to 2.2/100 000, than during the previous two stages. These turning points are associated with organisational structure changes from the Joinpoint regression analysis.
C O N C L U S I O N : We found that organisational structure and availability of resources play an important role in TB control. We recommend that other countries con- sider these vital factors to enhance the effectiveness of their TB control programmes.
K E Y W O R D S : tuberculosis control; mortality; trend analysis; JP regression; Taiwan
HOW do government organisation structure and the activities of disease control programmes affect out- comes such as mortality? According to the World Health Organization (WHO), contagious diseases no longer represent a major threat of mortality in the world;1 however, tuberculosis (TB) still accounts for the majority of deaths caused by an infectious agent.
TB not only has a severe impact in Asia, it still poses a formidable challenge to public health worldwide.2,3 TB causes 25% of all avoidable deaths in the economi- cally productive age groups,4,5 and the TB treatment regimen is laborious and time-consuming. However, according to most previous studies, TB deaths are preventable if health authorities implement rigorous policies and if patients adhere to their treatment protocols.
Reduction in mortality is possible through various interventions such as medical treatment, health edu- cation and utilisation of disease control tools. These tools are diagnostics, drugs and vaccines, which are not ‘magic bullets’.6 In the West, the decline in the TB mortality rate was primarily due to the elimination of poverty, improved nutrition and better medical care (such as the use of streptomycin), which reduced deaths in the United Kingdom by 51% from 1948 to 1971.7 However, TB remains a leading cause of death
in low-income countries. Without adequate treat- ment, case fatality rates are high, over 50% within 5 to 8 years. With the availability of effective treatment, TB case fatality rates can be reduced from 50% to
<5% within 5 years.8–10
Previous research has focused on the effectiveness of treatment,11,12 the evaluation of interventions and the measurement of the disease burden from a clini- cal viewpoint. Few studies have investigated the public health perspective in health policy decision making.
Some Asian countries such as Taiwan have made tre- mendous progress in the prevention (e.g., bacille Calmette-Guérin, X-ray screening and a computer- ised reporting system) and treatment of TB in the past decades. However, TB control in Taiwan faces the same predicament as in other industrialised coun- tries. Most offi cials were optimistic in the 1980s, pre- dicting a positive outcome in TB control based on the declining trend of incidence and mortality. However, if the TB control programme is inattentive, we may face a resurgence of TB as seen in the United States in the 1980s.
Health authorities used a centralised approach in the early (pre-1988) stage of TB control in Taiwan, at which time the Bureau of TB Prevention was respon- sible for TB control. In 1989, the organisational
S U M M A R Y
structure of TB control was absorbed into the Bureau of Chronic Disease Prevention and Treatment (CDPT).
The Taiwanese government saw TB as a chronic dis- ease and not as a major infectious disease, unlike other industrialised countries. Following a govern- ment reorganisation in 1999, the Center for Disease Control (CDC) was established, replacing the CDPT as the organisation responsible for leading anti- tuberculosis efforts in Taiwan. Following the estab- lishment of the CDC, clinical and public health became completely separate. The former anti-tuberculosis or- ganisation was dismantled, and TB control became part of the Taiwan CDC, providing all Taiwanese cit- izens with access to TB treatment.13 Despite this or- ganisational change, the government budget for TB control remained steady until the launch of the na- tional TB programme (NTP) by the CDC in 2001.
Mortality trends refl ect efforts made to improve TB control, such as the creation of a seamless process of surveillance, treatment and case management, with strong political commitment to provide funding to enable this process. The purpose of the present study was to use Joinpoint regression to analyse mortality trends with respect to organisational changes. These fi ndings will help policy makers re-examine relevant issues related to mortality rates from fi eld experiments and re-identify some useful decisions that other coun- tries can learn from. TB control lessons in Taiwan may provide valuable information, especially regarding policy implementation and organisational changes.
METHODS
TB mortality data were extracted from the cause-of- death registry database maintained by the Depart- ment of Health of Taiwan. Population data were ob- tained from the household population registration system provided by the Ministry of the Interior of Taiwan. By law, all reported cases of death require a diagnosis of the cause of death by a qualifi ed physi- cian responsible for fi lling out the death certifi cate;
this information is then recorded in the cause-of- death registry, in accordance with international stan- dards. These data were used to calculate sex- and age- specifi c TB mortality rates. Causes of death were
classifi ed according to the International Classifi ca- tion of Diseases eighth revision (ICD-8) for the pe- riod 1971–1980 and the ninth revision (ICD-9) for the period 1981–2008, including 010-018 for ICD-8 and 010-019 for ICD-9, respectively.
To allow for changes in the composition of the population, the analysis included calculating age- standardised mortality rates (ASMR) using direct standardisation based on the 2000 WHO world stan- dard population. The ASMR is the sum of the prod- uct of mortality rate in the ith age stratum (0–4, 5–9, . . . , ⩾85 years) in a given year in Taiwan and the proportion of standard population in the same age stratum in the same year. Analyses were undertaken for all ages as well as for three specifi c age groups:
<45, 45–64 and ⩾65 years. This study also analysed trends by sex to generate more information.
We conducted Joinpoint (JP) regression analyses to identify changes in TB mortality rates from 1971 to 2008 in Taiwan. The JP regression methods were originally developed to identify points of signifi cant infl ection in cancer incidence/mortality trends.14,15 Statistically signifi cant changes in trends can be de- tected and quantifi ed. The best fi tting points are cho- sen in the fi nal model.16 This information assists in explaining or engendering further research on the causes of the changes in trends. The analysis begins with a minimum number of infl ections (join-points) and tests whether additional JPs are statistically sig- nifi cant and should be added to the model.17 The an- nual percentage change (APC) is calculated for each of these trends by means of a generalised linear model. Signifi cant changes include changes in direc- tion or in the rate of increase or decrease.18 The JP re- gression analyses were performed using Joinpoint Version 3.2 software obtained from the US National Cancer Institute.15
RESULTS
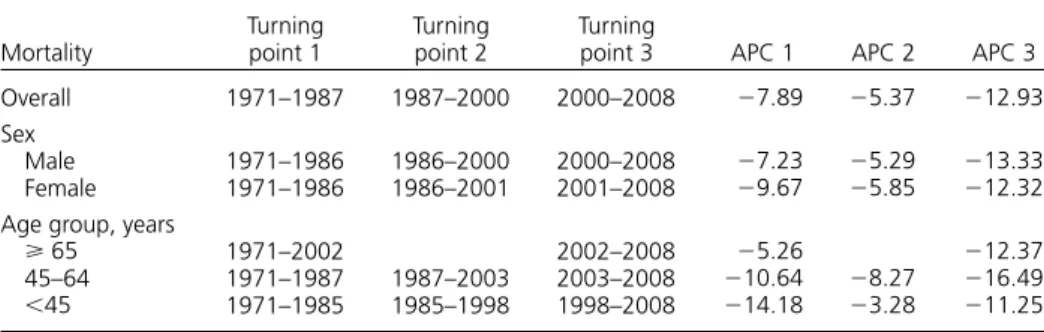
The present study focused only on the turning points and APC (Table 1), rather than on real mortality rates.
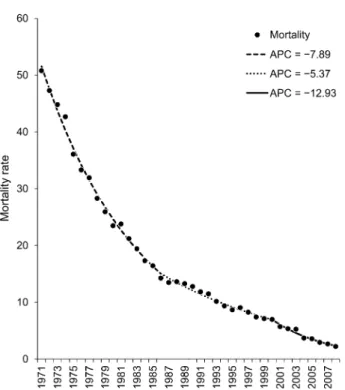
Figure 1 shows three turning points in the overall ASMR of TB; these occurred in the periods 1971–
1987, 1987–2000 and 2000–2008, with APCs of
Table 1 Turning points and APC of TB mortality rate from Joinpoint regression Mortality
Turning point 1
Turning point 2
Turning
point 3 APC 1 APC 2 APC 3
Overall 1971–1987 1987–2000 2000–2008 −7.89 −5.37 −12.93
Sex
Male 1971–1986 1986–2000 2000–2008 −7.23 −5.29 −13.33
Female 1971–1986 1986–2001 2001–2008 −9.67 −5.85 −12.32
Age group, years
⩾ 65 1971–2002 2002–2008 −5.26 −12.37
45–64 1971–1987 1987–2003 2003–2008 −10.64 −8.27 −16.49
<45 1971–1985 1985–1998 1998–2008 −14.18 −3.28 −11.25
APC = annual per cent change; TB = tuberculosis.
−7.89, −5.37 and −12.93, respectively. The APC characterises the trends of TB mortality rates in every slope. This means that rates were assumed to change at a constant percentage of the rate of the previous year. Between 1971 and 1987, the TB mortality rate dropped from 51 per 100 000 population to 13.4/
100 000; during the following period (1987–2000), the mortality rate dropped from 13.4 to 7/100 000, with a lower APC. From 2000 to 2008, the mortality decreased more rapidly, from 7 to 2.2/100 000, com- pared to the two previous stages. Interestingly, the three turning points closely refl ected the points of change in government structuring and organisational disease control measures, from the Bureau of TB Pre- vention in 1967 to the CDPT Bureau in 1988, then to the Taiwan CDC in 1999.
Table 1 illustrates additional data from the JP re- gression analyses by sex and age group. Females had a higher APC in the two previous stages despite being in the younger age group (<45 years). Furthermore, the mortality rate in the younger group declined more during the fi rst turning point (1971–1985), but did not show the same performance compared to the other two age groups.
DISCUSSION
Our study found changes in organisational structure that were associated with changes in the rate of de- cline of TB mortality among the population. This study assumed that organisational change would have a greater impact on TB mortality trends because TB control requires an enhanced programme that com-
prehensively integrates resources. Effective control of any infectious disease usually demands an organisa- tion with a high level of dedication to combining re- sources from public health and other medical entities.
Campbell used designs of fi eld experiments to in- terpret different approaches to disease control.19 Re- searchers used this method to determine whether programmes were effective and recognised outcomes that were based on immediate political implications.
The mortality rate, for example, is an important in- dex that is primarily used in the evaluation of TB control, as well as being basic and important infor- mation that identifi es serious issues in public health.
In general, numerous factors affected trends in mortality rates. In the majority of situations, factors related to reduction in mortality rates were improved nutrition, urbanisation, vaccination, medical treatment and public health.20 For example, in public health, extensive health education assisted patients in devel- oping a better understanding of TB and adherence to treatment schedules.21 Declining trends in mortality in Taiwan have supported the assumed effectiveness of the above improvements, particularly during the initial stages of TB control. Developing countries should commit more funds to basic resources such as public health infrastructure and nutrition to build a strong foundation for TB control.
The study also gives valuable insight into mortal- ity rates by sex and age group. Lu et al. found that the mortality rate in Taiwan increased with age,22 along with the turning points’ yearly trend. Checking the age effect, the ⩾65 years age group has two turn- ing points, while the other two age groups have three.
This means that the mortality trend for those aged
⩾65 years changed only once. However, according to the moving APC trend, organisational change af- fected the 45–64-year age group more signifi cantly than the other groups. The reason may be that TB prevention in the oldest group (⩾65 years) is more diffi cult due to comorbidies and other factors, whereas the youngest group (aged <45) received vac- cines and medication.
Does medication then affect mortality trends more signifi cantly than organisational change? TB chemo- therapy positively affects population-based TB con- trol efforts. In the past, more than 50% of TB pa- tients died and 25% became chronically infectious due to a lack of effective medication and treatment.23,24 In 1972, rifampicin (RMP) and isoniazid were being widely used in TB treatment, and Taiwan started pro- viding treatment free of charge, using medications (including RMP) to treat TB, in 1978. In 1990, the standard 6-month treatment regimen was introduced.
With adequate treatment, the mortality rate reached a turning point, with a decreasing trend. However, this study did not observe these turning points dur- ing or after the above-mentioned periods. We cannot deny that treatment was a major contribution, with
Figure 1 Mortality rate dynamics. APC = annual per cent change.
astonishing reductions in mortality rates in the fi rst stage (1971–1987). However, TB control cannot rely solely on the use of medication; it also requires other public health efforts, which is the reason for the re- versal of trends in the second stage.
Several other important TB control policies in Tai- wan may be associated with the TB mortality rate (Table 2). For example, BCG vaccination was imple- mented in 1951. From 1984, the authorities comput- erised the TB patient registry and case management, and National Health Insurance (NHI), launched in 1995, enhanced the completeness of TB reporting.
Two years later, the no-notifi cation-no-reimbursement policy for unreported cases of active TB was intro- duced.25 The Taiwan government also adopted a harm reduction programme for HIV and TB comor- bidity that produced positive results.26 However, these policies contributed little to the reduction in TB mortality rates. None of the aforementioned policies may have contributed more in changing the TB mor- tality rate than the organisational changes, as indi- cated in the Joinpoint regression.
Taiwan is a country of high population density and mobility, making case detection and management more diffi cult than if patients are treated in specialised TB clinics or hospitals. Some researchers worried over how organisational change from centralisation
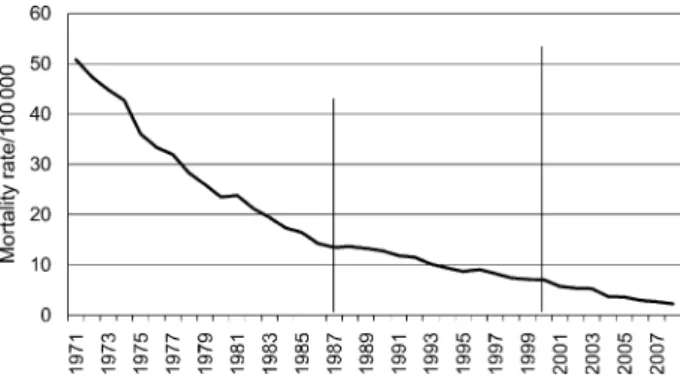
to decentralisation would affect TB control.27 The re- sults of this study showed that organisational changes correspond to turning points in TB mortality during the three stages illustrated in Figure 2, which displays the mortality rates during these three stages.
Another possible challenge encountered is lost ed- ucational value.28 An inexperienced doctor who en- counters an uncommon case of TB in an individual case history now has reduced ability to learn clinical skills and must rely primarily on publications.29 In- stinct and experience still play a major part in deter- mining whether treatment should be administered.30 Further, the government needed to integrate that sys- tem into a full-scale contact investigation network,31–33 rapid laboratory results, an effective vaccine and screening policy, and an effective treatment strategy such as DOTS, without which TB control in such a brief period would have been extremely diffi cult.
Taiwan’s experience shows that TB control re- quires not only effective medical treatment but also fi rm political commitment.34,35 Historically, TB con- trol operated independently in special programmes; in other words, the government combined personnel and budgets into an intensive operation. However, when the Bureau of TB Control ceased to exist, organisa- tional change spread resources throughout the coun- try, and the responsibility of TB control was trans- ferred to the Chronic Disease Control Centers. The situation changed again after the Taiwan CDC was established, as CDC Taiwan received a larger budget for the TB control programmes. This study shows that organisational change had a greater effect on TB mor- tality trends, as TB control requires an enhanced pro- gramme that comprehensively integrates resources.
According to one study,36 a single untreated TB patient can infect 10 to 15 persons. A successful TB programme needs political commitment.37,38 Without intensive strategies for contact investigation, protec- tion, prevention and treatment, success in the fi ght against TB will be far more diffi cult in the future.
We now face more challenges, such as multidrug- resistant TB (MDR-TB). The primary MDR-TB rate in Taiwan has increased from 0.2% in 1990 to the cur- rent 2.1%, a 10-fold increase in 10 years.39 The public
Table 2 Major events related to TB control
Year Events
JP turning point 1951 BCG vaccine introduced
1955 Taiwan started to develop a comprehensive system of TB prevention, control and case management with support from the WHO 1967 The government established the Taiwan
provincial bureau of TB prevention and gave it the full responsibility for TB prevention and treatment. (TB Control Bureau, TB Control Yuan and TB Control Center)
1972 RMP and INH used in treatment.
1978 Introduction of treatment free of charge, using medications (RMP) to treat TB for the fi rst 10 months
1984 Computerisation of TB patient registry and case management
1985 TB mortality lowered from the top 10 list 1986 Drop below 10/100 000 (standard mortality rate) 1988 The health authority optimistically predicted a
lower TB mortality rate and devolved the power of TB control to the Bureau of Chronic Disease Prevention and Treatment (Chronic Disease Control Centers)
1987
1990 Most hospitals introduced the standard 6-month regimen for the TB patients
1997 NHI discontinued drug reimbursement for unreported active TB
2001 CDC Taiwan established: in charge of all infectious diseases
2000 Roll-out of internet-based case reporting system,
open access and strengthening of surveillance reporting
TB = tuberculosis; JP = Joinpoint; BCG = bacille Calmette-Guérin; WHO = World Health Organization; RMP = rifampicin; INH = isoniazid; NHI = National Health Insurance; CDC = Centers for Disease Control.
Figure 2 Trends in tuberculosis mortality during three stages of organisation.
should be informed that TB is not a stigma, but a treat- able, preventable disease. The key to TB control lies in early detection and treatment and in combining public health resources and medical entities with the intensity of purpose that we have learned from our lessons.
CONCLUSIONS
This study found that organisational structure and the availability of resources play an important role in TB control. We recommend that other countries con- sider these vital factors to enhance the effectiveness of TB control programmes.
Acknowledgements
The authors thank the two anonymous reviewers for many valu- able suggestions; B Lavin for her contribution; and Dr Yaung, Dr Luh, Kwen-Tay and other professors for their valuable sugges- tions. This study was supported by the Research, Development and Evaluation Commission, Executive Yuan, for the investigation in the evaluation of effectiveness of the National TB Program: mo- bilisation plan to halve tuberculosis incidence in ten years, which was sponsored by the CDC Taiwan.
References
1 Murray C J L, Lopez A D, eds. The global burden of disease. A comprehensive assessment of mortality and disability from dis- eases, injuries and risk factors in 1990 and projected to 2020.
Cambridge, MA, USA: Harvard University Press; 1996.
2 Corbett E L, Watt C J, Walker N, et al. The growing burden of tuberculosis: global trends and interactions with the HIV epi- demic. Arch Intern Med 2003; 163: 1009–1021.
3 World Health Organization. Global tuberculosis control: epi- demiology, strategy, fi nancing. WHO report 2009. WHO/
HTM/TB/2009.411. Geneva, Switzerland: WHO, 2009.
4 Kiboss J K, Kibitok N K. The re-emergence of tuberculosis among the economically productive age group in Kenya: the case of Mombasa district. Afr J Social Work 2003; 18: 121–
132.
5 National Institutes of Health. Basic research in human tuber- culosis. NIH Guide. Bethesda, MD, USA: NIH, 1994.
6 Chaisson R E, Harrington M. How research can help control tuberculosis. Int J Tuberc Lung Dis 2009; 13: 558–568.
7 Hirsch A, Albert H. Prevention of respiratory diseases. Lon- don, UK: Informa Healthcare, 1993.
8 Cohn D L, Catlin B J, Peterson K L, Judson F N, Sbarbaro J A.
A 62-dose, 6-month therapy for pulmonary and extrapulmo- nary tuberculosis. A twice-weekly, directly observed, and cost- effective regimen. Ann Intern Med 1990; 112: 407–415.
9 Telzak E E, Sepkowitz K, Alpert P, et al. Multidrug-resistant tuberculosis in patients without HIV infection. N Engl J Med 1995; 333: 907–911.
10 Borgdorff M W, Floyd K, Broekmans J F. Interventions to reduce tuberculosis mortality and transmission in low- and middle- income countries. Bull World Health Organ 2002; 80: 217–
227.
11 Sterling T R, Lehmann H P, Frieden T R. Impact of DOTS com- pared with DOTS-plus on multidrug resistant tuberculosis and tuberculosis deaths: decision analysis. BMJ 2003; 326: 574.
12 Baltussen R, Floyd K, Dye C. Cost effectiveness analysis of strategies for tuberculosis control in developing countries. BMJ 2005; 331: 1364.
13 Suo J. The status of anti-tuberculosis efforts in Taiwan. Taiwan Epidemiol Bull 2008; 24: 169–176.
14 Weir H K, Thun M J, Hankey B F, et al. Annual report to the
nation on the status of cancer, 1975–2000, featuring the uses of surveillance data for cancer prevention and control. J Natl Cancer Inst 2003; 95: 1276–1299.
15 National Cancer Institute. Joinpoint regression program; ver- sion 3.3. Bethesda, MD, USA: National Cancer Institute, 2008.
16 Lerman P M. Fitting segmented regression models by grid search. Applied Stat 1980; 29: 77–84.
17 Kim H J, Fay M P, Feuer E J, Midthune D N. Permutation tests for Joinpoint regression with applications to cancer rates. Stat Med 2000; 19: 335–351.
18 Fay M P, Feuer E J. Confi dence intervals for directly standard- ized rates: a method based on the gamma distribution. Stat Med 1997; 16: 791–801.
19 Campbell D T. Reforms as experiments. Am Psychol 1969; 24:
409–429.
20 Cutler D, Deaton A, Lleras-Muney A. The determinants of mortality. J Econ Perspectives 2006; 20: 97–120.
21 Fairchild A L, Oppenheimer G M. Public health nihilism vs pragmatism: history, politics, and the control of tuberculosis.
Am J Public Health 1998; 88: 1105–1117.
22 Lu T H, Huang R M, Chang T D, Tsao S M, Wu T C. Tubercu- losis mortality trends in Taiwan: a resurgence of non-respiratory tuberculosis. Int J Tuberc Lung Dis 2005; 9: 105–110.
23 Snider G L. Tuberculosis then and now: a personal perspective on the last 50 years. Ann Intern Med 1997; 126: 237–243.
24 Brewer T F, Heymann S J. Long time due: reducing tuberculosis mortality in the 21st century. Arch Med Res 2005; 36: 617–
621.
25 Chiang C Y, Enarson D A, Yang S L, Suo J, Lin T P. The impact of national health insurance on the notifi cation of tuberculosis in Taiwan. Int J Tuberc Lung Dis 2002; 6: 974–979.
26 Chen Y M, Kuo S H. HIV-1 in Taiwan. Lancet 2007; 369:
623–625.
27 Jaung J-J, Sheu M-L. TB policy and related issues in Taiwan:
organizational developments and notifi cation policy changes.
Taiwan J Public Health 2004; 23: 292–296.
28 Chern J P, Chen D R, Wen T H. Delayed treatment of diag- nosed pulmonary tuberculosis in Taiwan. BMC Public Health 2008; 8: 236.
29 Davies P D, Pai M. The diagnosis and misdiagnosis of tubercu- losis. Int J Tuberc Lung Dis 2008; 12: 1226–1234.
30 Chung W S, Chang Y C, Yang M C. Factors infl uencing the successful treatment of infectious pulmonary tuberculosis. Int J Tuberc Lung Dis 2007; 11: 59–64.
31 Cook V J, Sun S J, Tapia J, et al. Transmission network analysis in tuberculosis contact investigations. J Infect Dis 2007; 196:
1517–1527.
32 Shrestha-Kuwahara R, Wilce M, DeLuca N, Taylor Z. Factors associated with identifying tuberculosis contacts. Int J Tuberc Lung Dis 2003; 7 (Suppl 3): S510–S516.
33 Nakatani H, Fujii N, Mori T, Hoshinot H. Epidemiological transition of tuberculosis and future agenda of control in Japan:
results of the Ad-Hoc National Survey of Tuberculosis 2000.
Int J Tuberc Lung Dis 2002; 6: 198–207.
34 Frieden T R, Sterling T R, Munsiff S S, Watt C J, Dye C. Tuber- culosis. Lancet 2003; 362: 887–899.
35 Arnadottir T. The Styblo model 20 years later: what holds true? Int J Tuberc Lung Dis 2009; 13: 672–690.
36 Musher D M. How contagious are common respiratory tract infections? N Engl J Med 2003; 348: 1256–1266.
37 Enarson D A. Tuberculosis: 12. Global disease and the role of international collaboration. CMAJ 2000; 162: 57–61.
38 Ebrahim G J. Tuberculosis—the global challenge. J Trop Pediatr 1996; 42: 190–191.
39 Centers for Disease Control and Prevention Taiwan. The dis- ease introduction: MDR-TB. Taipei, Taiwan: CDC, 2008.
http://www.cdc.gov.tw/sp.asp?xdurl=disease/disease_content_
pda.asp&id=1660&mp=998&ctnode=&topcat=1# Accessed May 2011.
R É S U M É
R E S U M E N C O N T E X T E : Taiwan.
O B J E C T I F : Analyser les tendances de mortalité indi- quant dans quelle mesure la structuration des organisa- tions gouvernementales et les activités d’un programme de lutte contre la maladie ont une infl uence sur les résultats.
S C H É M A : Nous avons mené une analyse de régression Joinpoint (JP) pour identifi er les modifi cations des ten- dances de mortalité par la tuberculose (TB) entre 1971 et 2008 à Taiwan. Le pourcentage annuel de modifi ca- tion (APC) a été calculé pour les périodes de temps de part et d’autre du JP. Les données de mortalité ont été prélevées dans la base de données du registre des causes de décès grâce au Département de la Santé de Taiwan.
R É S U LTAT S : Entre 1971 et 1987, le taux de mortalité
par TB a baissé de 51 à 13,4/100 000 ; pendant la péri- ode suivante (1987–2000) le taux de mortalité a baissé de 13,4 à 7/100 000 et l’APC a été plus faible. Entre 2000 et 2008, la mortalité a décru plus rapidement (de 7 à 2,2/
100 000) par comparaison avec les deux étapes précé- dentes. Ces tournants dans la mortalité sont en associa- tion avec des modifi cations de la structure organisation- nelle qui ressortent de l’analyse de régression Joinpoint.
C O N C L U S I O N : Cette étude a démontré que la structure organisationnelle et la disponibilité de ressources jouent des rôles importants dans la lutte contre la TB. Nous re- commandons que d’autres pays envisagent ces facteurs vitaux pour renforcer l’effi cience de leurs programmes de lutte contre la TB.
M A R C O D E R E F E R E N C I A : Taiwán.
O B J E T I V O : Mediante el análisis de las tendencias de mor- talidad por tuberculosis (TB), se buscó determinar si la organización gubernamental de la estructura y las activi- dades de un programa de control de la TB tiene repercu- siones en los desenlaces clínicos de la enfermedad.
M É T O D O S : Se llevó a cabo un análisis de regresión lineal segmentada con el fi n de detectar las modifi caciones en las tendencias de la mortalidad entre 1971 y el 2008 en Taiwán. Se calculó el porcentaje anual de cambio (APC) en los intervalos de un lado y de otro de los puntos de infl exión. Los datos sobre la mortalidad se extrajeron de la base de datos del registro de las causas de defunción del departamento de salud de Taiwán.
R E S U LTA D O S : La tasa de mortalidad por TB disminuyó de 51 por 100 000 habitantes a 13,4 por 100 000 entre
1971 y 1987; durante el período siguiente (del 1987 al 2000) esta tasa disminuyó hasta 7 por 100 000 habi- tantes, con un menor porcentaje anual de cambio. Entre el 2000 y el 2008, el ritmo de la disminución de la mor- talidad fue todavía más acelerado (de 7 por 100 000 a 2,2 por 100 000) que en los dos períodos previos. El análisis de regresión lineal segmentada permitió establecer la relación entre estos puntos de infl exión y las modifi ca- ciones en la estructura de la organización del programa de control de la TB.
C O N C L U S I Ó N : El presente estudio puso en evidencia la importante función que cumple la estructura organiza- tiva y la disponibilidad de recursos en la lucha contra la TB. Se recomienda que otros países tengan en cuenta es- tos factores primordiales, con miras a reforzar la efi ca- cia de los programas de control de la enfermedad.