行政院國家科學委員會專題研究計畫 成果報告
微奈米材料對混凝土骨材-水泥漿界面之研究 研究成果報告(精簡版)
計 畫 類 別 : 個別型
計 畫 編 號 : NSC 96-2221-E-011-116-
執 行 期 間 : 96 年 08 月 01 日至 97 年 07 月 31 日 執 行 單 位 : 國立臺灣科技大學營建工程系
計 畫 主 持 人 : 黃兆龍
計畫參與人員: 碩士班研究生-兼任助理人員:吳志偉
報 告 附 件 : 出席國際會議研究心得報告及發表論文
處 理 方 式 : 本計畫涉及專利或其他智慧財產權,2 年後可公開查詢
中 華 民 國 97 年 09 月 26 日
一、前言
(一)研究動機與目的
奈米技術可以分為二類,一種為「由大而小」係利用微加工等方法,將材料 不斷微小化,另一種為「由小而大」係利用操控分子、原子,進行設計與組合。
而在2007 年更利用飛灰純化各種技術方法,將其飛灰細粒化,使飛灰更為接近 奈米尺寸材料。
十九世紀以來卜作嵐材料與化學摻料的應用,混凝土科技不斷地提升,在強 度及工作度品質上都有很大的進步,影響其品質好壞的主因在於混凝土的緻密度 與其內部的微觀結構。混凝土中飛灰、矽灰尺度介於微米與奈米尺度之間,不僅 扮演了填充孔隙的要角,更由於本身所具卜作嵐反應,進一步提高了混凝土結構 的緻密度。材料結構的奈米化對提升材料的力學性質有極大的助益,而利用奈米 技術將混凝土之基本成分矽(Si)、鈣(Ca)、鋁(Al)、鐵(Fe)奈米化,將奈 米化的奈米粉體應用於水泥砂漿之中,可以提升其力學性質及微觀奈米結構緻密
度。而在骨材漿體界面上泌水處之高孔隙率、大晶粒的水化產物如CH 水化物優
先產生。一般強度混凝土,於裂縫尖端易有應力集中現象,容易從弱面處形成破 裂面,並向外延伸造成混凝土破裂。當混凝土受壓時,骨材顆粒會沿著界面產生 滑移現象,造成顆粒左右兩側形成張應變,致使劈裂破壞及部份界面的剪張破 壞,此情況為骨材強度大於膠體強度。而在高強度或輕質混凝土,由於骨材強度 低於膠結料,裂縫將穿過骨材,造成顆粒上下兩側形成張裂縫。因此,本研究將 針對微奈米卜作嵐混凝土的粒料與漿體界面及微奈米卜作嵐材料在界面上的效 能來探討。
本研究利用細粒材料之渦錐分選技術,利用不同礦漿濃度及水壓力進行渦 錐分選,進而得知粒徑分布小以及其分選成效之間的相關性。再其探討微奈米尺 寸卜作嵐材料對混凝土工程性質之影響。計畫以水泥、飛灰、微矽灰等膠結材料 之物理、化學特性為基礎,透過顆粒分布、漿量厚度對於膠結及次膠結反應過程 的影響,並以顯微技術量測分析其化學反應過程之界面微觀結構特徵與水化產物 成分之變動,利用混凝土巨觀性質之工程性質,建立骨材界面奈米微觀結構與巨 觀工程性質之關係;最後則由千年古建築碩果僅存的絲絲信息,透過奈米卜作嵐 對顯微孔洞的填封作用,加上巨觀空隙及孔洞的縮減技巧,達到近似古典之配 方,使結構物由奈米(nm)、微米(μm)、厘米(mm)以至至米(m)全盤緻 密化過程,達到材料生生不息,永續發展的使命。
(二)研究範圍
本研究範圍主要分二大部分,第一部份為飛灰的分選;第二部份為採用黃氏 富勒緻密設計法計算混凝土配比,並將已設計完成混凝土配比中的膠結材料(V
P
) 拌製成水泥漿,以瞭解漿質之影響。1.飛灰分選技術採用渦錐分選,其中將設計不同的礦漿濃度及三種不同噴流壓力 而進行分選,以探討其結果,並分析分選後粒徑及成效。
2.混凝土配比設計採黃氏富勒緻密設計法,以二組原樣卜作嵐材料(飛灰、矽灰)、
一組混合二種卜作嵐材料(飛灰+矽灰)及經過渦錐分選過後之飛灰,共四種不同 的卜作嵐材料變數,以及三種不同的漿質(W/B=0.23,0.35,0.47),共 12 組。水 泥漿配比設計將以設計完成混凝土配比的水泥漿(V
P
)部份的配比,亦共 12 組。測試一系列混凝土新拌、硬固、耐久性與微觀行為,規劃試驗將進行至91 天。
二、試驗計劃
(一)試驗變數
1. 離心(渦錐)分選變數
本研究之飛灰離心分選採用四種不同的礦漿濃度與三種不同的水壓力,分別 交叉選定7 種變數,變數表如表 3-7 所示。
2. 黃氏富勒緻密混凝土變數
本研究之黃氏富勒緻密混凝土採用三種不同漿質與三種不同矽質奈米材料 (原樣飛灰、矽灰、溢流(Overflow)飛灰)以及一種由原樣飛灰和矽灰混合,因此 共有 12 組試驗量,其中水泥漿變數亦為 12 組試驗量,變數表如表 3-8、表 3-9 所示。試驗之量測齡期為3 天、7 天、28 天、56 天、91 天。
(二)試驗項目 1. 材料基本性質
材料基本性質包括:比重、吸水率、篩分析、容積密度。
2. 離心(渦錐)分選
物理性質試驗:(1)比重測定(2)粒徑分佈測定(3)掃描式電子顯微鏡觀察(4) 卜作嵐活性指數。
化學性質試驗:(1)成分分析(2)燒失量測定(3)pH 值測定(4)EDS 分析。
3. 黃氏富勒緻密混凝土試驗
混凝土新拌性質包括:坍度、坍流度、容積密度、水化熱等試驗項目。
混凝土硬固性質包括:抗壓強度、超音波、塑性裂縫等試驗項目。
混凝土耐久性質包括:表面電阻、氯離子電滲、混凝土吸水率等試驗項目。
混凝土微觀性質包括:電子顯微鏡試驗(SEM)。
水泥漿新拌性質包括:流度值、水化熱等實驗項目。
水泥漿硬固性質包括:抗壓強度、塑性裂縫等試驗項目。
水泥漿耐久性質包括:混凝土吸水率等試驗項目。
水泥漿微觀性質包括:電子顯微鏡試驗(SEM)、壓汞 孔隙試驗(MIP)等試驗項目。
三、結果分析
(一)濕式離心(渦錐)分選後飛灰與原樣飛灰之物理性質 粒徑分佈
本研究之目的為採用渦錐分級方式進行飛灰樣品之細粒化處理,以便改善飛
灰應用高性能混凝土之工程性質。研究將採改變不同礦漿濃度及改變不同噴流壓 力為基本參數,飛灰樣品則取自台灣電力公司興達廠之原樣飛灰,探討渦錐對於 飛灰細化之影響。
飛灰渦錐分級技術下改變礦漿濃度或者不同的噴流壓力其呈現出結果有規 律的趨勢,其粒徑分佈圖及趨勢圖,如圖一及圖二所示。本研究飛灰進行渦錐分 選時之礦漿濃度變化溢流(Overflow)飛灰粒徑分佈,係受到礦漿濃度的變化而改 變,礦漿濃度愈高,其粒徑分佈愈粗,如圖二(a)所示,礦漿濃度 5~20%,中位 徑分別為11.05~14.08μm 範圍,顯示礦漿濃度愈高其中位粒徑(D
50
)愈大之關係;當噴流壓力改變時溢流(Overflow)飛灰粒徑分佈係受到噴流壓力的變化而改變,
噴流壓力愈大,其粒徑分佈愈細,溢流(Overflow)飛灰中位粒徑(D
50
)亦隨著噴流 壓力而改變,其噴流壓力愈高,如圖二(b)所示,噴流壓力 10~30psi,D50
分別為 6.53~11.05 範圍,中位粒徑(D50
)愈小。本研究之飛灰渦錐分選技術之 Overflow 與原樣飛灰之粒徑分佈皆有細化現象,而中位粒徑(D50
)從原樣飛灰 24.38μm 降 至6.53μm,降低幅度可達 73.2%。本研究對於渦錐分級實驗後的飛灰採雷射粒度分析儀測定粒徑分布情形,並 以中位粒徑D
50
作為分級效率指標,渦錐分級產物之產率計算結果,如圖三所示,得知當礦漿濃度增加其產率隨著增加,當礦漿濃度於5~20%時其溢流(Overflow) 飛灰產率介於35.6~50%之間;當噴流壓力於 10~30psi 時其溢流(Overflow)飛灰產 率介於35.8~23%之間,噴流壓力增加其產率隨著減少,。換言之,濕式渦錐分 選之溢流(Overflow)飛灰其粒徑愈細產率隨之降低。
上述之粒徑分佈分析及產率評估下,礦漿濃度為10~30%與 D
50
關係斜率明 顯上升,又噴流壓力20%時 D50
為9.357μm 為 10μm 以下且產率大於 30%,所以 選定礦漿濃度 10%;噴流壓力 20psi(F1020),此濕式渦錐分選變數之溢流 (Overflow)細粒飛灰及奈米級矽灰,應用於水泥漿與混凝土中。0.1 1 10 100
0 10 20 30 40 50 60 70 80 90 100
C u m u la ti v e P a s s in g (% )
Particle Size ( μ m) RF
F0510 F1010 F1510 F2010 F1020 F1030
0.1 1 10 100
Particle Size ( μ m) RF
F0510 F1010 F1510 F2010
0.1 1 10 100
100 90 80 70 60 50 40 30 20 10 0
C u m u la ti v e R e ta in (% )
Particle Size ( μ m) RF
F1010 F1020 F1030
(a) (b) (c)
圖一 飛灰經渦錐分選技術之(a)全部變數(b)礦漿濃度改變(c)噴流壓力改變粒徑分佈圖
5 10 15 20 0
2 4 6 8 10 12 14 16
D
50( μ m)
Consistency(%) F0510 F1010 F1510 F2010
0 2 4 6 8 10 12 14 16
0 10 20 30 40
Inlet Pressure(psi) F1010
F1020 F1030
(a) (b)
圖二 飛灰經鍋椎分選技術之(a)礦漿濃度-D
50
(b)噴流壓力-D50
關係圖0 10 20 30 40 50 60
5 10 15 20
0 5 10 15 20 25 30 35 40 45 50 55 60
O u tput E ff ici en cy (% )
Consistency(%) F0510 F1010 F1510 F2010
0 10 20 30 40 50 60
10 20 30
Inlet Pressure(psi) F1010 F2010 F3010
(a) (b)
圖三 飛灰經鍋椎分選技術之(a)礦漿濃度-產率 (b)噴流壓力-產率 關係圖 電子顯微鏡觀察(SEM)
渦錐分選之飛灰以及原樣飛灰,分別為原樣、溢流(Overflow)以及潛流 (Underflow)飛灰,經由 SEM 觀測;倍率分別為 1000、2000 以及 5000 倍,以觀 察粉粒外觀。
以SEM 1000 倍微觀觀察,如圖四所示,可觀察中三種飛灰以中空圓球為主 要,其中溢流(Overflow)飛灰之圓球顆粒微觀結構最為一致,如圖四(b);Underflow 飛灰之微觀結構圖,如圖四(c)所示,除了圓球顆粒之外,其中分佈許多不規則 形狀多孔顆粒;而原樣飛灰微觀結構圖,如圖四(a)所示,顯示圓球顆粒之分佈 為不規則顆粒,可明顯觀察這些不規則顆粒的分佈為潛流(Underflow)飛灰最多,
原樣飛灰次之,最後係以溢流(Overflow)飛灰為最少。然從 SEM 1000 倍微觀結 構各樣式之飛灰圓球顆粒大小,以潛流(Underflow)飛灰顆粒最大,原樣飛灰次 之,而溢流(Overflow)飛灰最小。
以SEM 2000 倍率下觀察微觀結構,如圖五所示,放大不規則顆粒微觀結構,
這些不規則形狀的顆粒大小,亦以潛流(Underflow)飛灰顆粒最大,原樣飛灰次 之,而溢流(Overflow)飛灰最小,可判斷其為煤粒。
(a) (b) (c) 圖四 各式(a)原樣(b)Overflow(c)Underflow 飛灰 FE-SEM 1000 倍之微觀結構圖
(a) (b) (c) 圖五 各式(a)原樣(b)Overflow(c)Underflow 飛灰 FE-SEM 2000 倍之微觀結構圖
(二)濕式離心(渦錐)分選後飛灰與原樣飛灰之化學性質 成分分析
由於本研究之矽質奈米材料,將應用於各種水泥基質材料中,如水泥漿、水 泥砂漿及混凝土等,這些矽質奈米材料可與水泥水化產物進行卜作嵐反應,因此 矽質奈米材料統稱為卜作嵐材料。然而經過濕式渦錐分選過後的各式飛灰,其化 學成分是否改變而影響卜作嵐反應,係本節討論之重點。
本試驗將針對原樣、溢流及潛流飛灰各別取樣,進行化學成分分析試驗,試 驗結果,如表ㄧ所示,化學成分以矽鋁酸鹽類為主要架構,其中主要成分:氧化 矽(SiO
2
)含量約有 54.49~55.59%、氧化鋁(Al2
O3
)約 23.87~25.36%、氧化鐵(Fe2
O3
) 約5.14~7.10%及氧化鈣(CaO)約 2.86~3.02%,次要成分:氧化鎂(MgO)、氧化硫 (SO3
)及鹼性物質等,分別為 1.16~1.40%、0.67~0.41%及 0.93~0.77%,由圖六之 C-A-S 三相圖,可得知各式飛灰之成分類似。表一 各式飛灰之化學成分表 成分
組別
SiO
2
(%)
Al
2
O3
(%)
Fe
2
O3
(%)
CaO (%)
MgO (%)
SO
3
(%)
K
2
O (%)Na
2
O (%) RF 55.59 24.04 5.84 2.86 1.16 0.67 0.87 - OF 54.50 25.36 5.14 3.14 1.28 0.41 0.93 - UF 54.49 23.87 7.10 3.02 1.40 0.44 0.77 -0.00 0.25 0.50 0.75 1.00 0.00
0.25
0.50
0.75
1.00 0.00
0.25 0.50 0.75 1.00
UF OF
RF A
2l O
3
C aO
SiO 2
圖六 各式飛灰 C-A-S 三相圖
燒失量分析
燒失量試驗主要目的係採用濕式渦錐分選過後之飛灰與原樣飛灰之未燃含 碳量之比較,其試驗結果可作為水泥漿以及混凝土之依據。未燃含碳量之多寡,
將影響混凝土之品質,係主要飛灰所含碳量易吸附大量水量,其影響混凝土之工 作性、安全性以及耐久性品質。
燒失量試驗結果,如圖七(a)所示,得知各式飛灰之燒失量介於
4.5~5.6%之間,其中潛流飛灰(UF)燒失量為 5.6%最高,原樣飛灰(RF)次之 5.3%,而溢流飛灰(OF)為最低 4.5%。另外,圖七(b)所示之趨勢圖,可得
知燒失量隨著D
50
的降低而減少,換言之,當飛灰粒徑細粒化後,其未燃含碳量降低。
UF RF OF
0 1 2 3 4 5 6
D 50 =9.357 D 50 =24.38
D 50 =38.01
LO I( % )
Mlxtures Y=6.23-0.55X R 2 =0.93
0 5 10 15 20 25 30 35 40
0 1 2 3 4 5 6
LO I( % )
D 50 ( μ m)
(a) (b)
圖七 各式飛灰之燒失量(a)材料與 LOI(b)D50-LOI 關係圖
富勒曲線粒料堆積分析
本研究依據Fuller’s curve:
h
D P d
⎟⎠
⎜ ⎞
⎝
=⎛ ,採用以通過1/2”篩(12.5mm)之粒 料,故採用D = 12.5 mm,並搭配不同的 h 次方數(h)=0.35、0.4、0.45、0.5、
0.55 進行計算,而求取到之計算結果如表 4-1 所示, Fuller’s curve 粒料堆積比 例分析結果ㄧ覽表。
而在計算過次方數(h)下之粒料使用比例後,並以圖八(a)之粒料堆積重量
比例,進行乾搗單位重試驗,並繪制乾搗單位重之不同堆積密度和容積密度與h
之關係圖,如圖八(b)與圖八(c)所示。由圖八(b)可得知最大之 h 值為 0.521;由圖 八(c)可得知最大之 h 值為 0.516,故本研究採用 h = 0.5 之 Fuller 指數作為粒料級 配曲線之堆積架構。
本研究以 h=0.5 計算之篩分析資料,繪製 Fuller’s curve 理論與實際粒徑分 佈曲線比較圖,如圖八(d)所示,此目的可再次確定理論之 Fuller’s curve 是否與 實際粒料分佈曲線有所差異。由圖八(d)可得知,h = 0.5 與理論曲線非常相近,
然可再次確定h 值為 0.5 作為混凝土配比之粒料堆積架構。
0.30 0.35 0.40 0.45 0.50 0.55 0.60
0 20 40 60 80 100
Sand Stone Fly ash
C a lc u la ti on P e rc e n ta ge of Ful le r' s C u rv e( % )
Power Number of Fuller's Curve(h) Silica fume
0.30 0.35 0.40 0.45 0.50 0.55 0.60
1750 1800 1850 1900 1950 2000 2050
Uni t W e ight (k g/ m
3)
h(Power Number) Uw(kg/m
3)=-203.04+8405.94h-8095.26h
2Uw
max=1979(kg/m
3)
h
max=0.521
(a) (b)
0.30 0.35 0.40 0.45 0.50 0.55 0.60
0.66 0.68 0.70 0.72 0.74 0.76 0.78
P a c k ing Vol u m e of A ggr e g at e (m
3/m
3)
h(Power Number) V(%)=-0.047+3.129h-3.057h
2V(%)=0.753
h
max=0.516
0.1 1 10
0 20 40 60 80 100
Pe rc e n t Pa ss ing( % )
Sieve Diameter(mm) D
max=12.5 h=0.5
Theoretical curve Design curve
(c) (d)
圖八 黃氏富勒緻密配比(a)不同 h 値材料比例(b)不同 h 値乾搗單位重(c)不同 h 値 容積密度(d)理論與實際粒徑分佈曲線比較圖(D=12.5mm, h=0.5)
(三)矽質微奈米材料混凝土試驗結果分析 水化熱偵測
透過水泥材料之中水泥和水產生之激發熱量過程,了解水泥材料由塑性至固 態之各種物理表徵。而在水化熱能量釋放過程中,對於水份散失影響甚大,所以 熱能釋放勢必對水泥材料硬固性質產生影響,然而水泥材料之塑性裂縫係為直接 被影響。換言之,水泥材料之塑性裂縫,將受到水泥水化過程中釋放之熱量有直 接關係,對於硬固性質以及耐久性質有間接影響關係。
(1) 矽質奈米材料改變
本研究混凝土水化熱偵測結果,如圖九所示,得知在各式系列混凝土水膠比 為0.23 時水化熱最高溫度介於 48.2~51.2℃,時間為 14.25~20.98 hrs 之間,其溫
度相差約3℃,但因受到強塑劑添加量的影響,使其水化反應時間有所差異;結
果顯示水膠比0.35 之水化熱溫度最高,介於 41.9~44.8℃,溫度最高峰時間約 15.5-19.46 hrs;水膠比 0.47 時水化熱之最高溫度介於 37.2~39.7℃,溫度最高峰 時間約14.25-24.94 hrs。因此,混凝土添加之矽質奈米材料改變,固定水膠比,
其水化溫度與時間之改變不大。
0 10 20 30 40 50 60 70
0 20 40 60 80 100
T e m p er at u re(
oC)
Time(hour) CFS23 CF23 CS23 COF23
0 10 20 30 40 50 60 70
Time(hour) CFS35 CF35 CS35 COF35
0 10 20 30 40 50 60 70
40 60 80 100 120 140 160 180 200
Te m p e ra tur e (
oF)
Time(hour) CFS47 CF47 CS47 COF47
(a) 0.23 (b) 0.35 (c) 0.47
圖九 各系列矽質奈米材料混凝土漿質改變之水化熱偵測與時間關係圖 本研究之水泥漿水化熱偵測結果,如圖十所示,當水膠比為0.23 時,水化 熱最高溫度介於92.9~96.7℃,溫度最高峰時間約 11.70~12.60 hrs;當水膠比為 0.35 時,水化熱最高溫度介於 66.0~98.0℃,溫度最高峰時間約 13.48~15.43 hrs;
水膠比為0.47 時,水化熱最高溫度介於 55.3~97.1℃,溫度最高峰時間約
11.33~18.33 hrs。由圖十得知,矽質奈米材料水泥漿(PFS、PF、POF 系列)隨著水 膠比增高,其水化熱溫度隨之降低,此趨勢以PF 系列最為明顯;由圖十(b)得知,
PS 系列之水泥漿水化最高溫度、時間不受水膠比的變化而改變。以上述結果,
推論PS 系列所添加矽灰其顆粒表面積與其他系列添加之矽質奈米材料顆粒表面
積相差甚大,因拌和過程中顆粒表面吸水搶水泥水化用水,然而導致水泥水化水 減少使之水化過程激烈,造成水化溫度升高。本研究各系列之矽質奈米水泥漿,
以水化熱之最高溫度、時間與水膠比趨勢明顯程度,依序為PF、POF、PFS 系
列而PS 並無此趨勢,以上述將可證實堆論之結果與試驗結果吻合。換言之,水
泥漿添加矽質奈米材料其顆粒表面積係影響其水化熱高低。
0 10 20 30 40 50 60 70 80
10 20 30 40 50 60 70 80 90 100
Te m p e ra tur e (
oC)
Time(hour) PFS23 PF23 PS23 POF23
0 10 20 30 40 50 60 70 80
Time(hour) PFS35 PF35 PS35 POF35
0 10 20 30 40 50 60 70 80
60 80 100 120 140 160 180 200 220
T e mp er a tu re(
oF)
Time(hour) PFS47 PF47 PS47 POF47
(a)0.23 (b)0.35 (c)0.47
圖十 各系列矽質奈米材料水泥漿漿質改變之水化熱偵測與時間關係圖 壓汞孔隙(MIP)
(1) 矽質奈米材料改變
由圖十ㄧ所示,得知在於7 及 91 天齡期奈米材料改變時,累積的孔隙是有 PS 之系列為最小,依序累積孔隙大小為 PS、PFS、POF、PF,以上述依序排列 順序原因是其顆粒排列大小與與SiO
2
有關,顆粒愈小其堆積排列愈佳以及SiO2
愈高卜作嵐反應產物填塞孔隙,使內部累積孔隙隨之愈小,;由圖4-52(b)、4-53(b) 所示在於早期(齡期 7 天)時此趨勢明顯,晚期矽質奈米材料產生卜作嵐反應填塞 孔隙,此趨勢較為不明顯。
1 10 100 1000 10000 100000 1000000
0.00 0.05 0.10 0.15 0.20 0.25 0.30 0.35
C u m u la tiv e V o lu m e (m L /g )
Pore diameter(nm) PFS23 7days
PF23 7days PS23 7days POF23 7days
1 10 100 1000 10000 100000 1000000
0.00 0.05 0.10 0.15 0.20 0.25 0.30 0.35
C u m u la tiv e V o lu m e (m L /g )
Pore diameter(nm) PFS23 91days
PF23 91days PS23 91days POF23 91days
(a) 7 天 (b) 91 天
圖十一 矽質奈米材料水泥漿孔隙大小與累積體積關係圖 抗壓強度
(1) 矽質奈米材料改變
由圖十二所示,得知各系列之混凝土在水膠比固定而矽質奈米材料改變時,
其各系列之混凝土抗壓強度,皆是以CS 系列抗壓強度明顯較高,抗壓強度高低
各系列依序為CS、CFS、COF、CF,以水膠比 0.23 為例齡期 91 天 CS23 強度達 87Mpa(12633psi);CFS23 強度達 78Mpa,其為 CS23 強度 90%、COF 強度達 72Mpa 其為CS 強度 83%、CF 強度達 66Mpa 其為 CS 強度 76%。而又由圖得知水膠比 固定時各系列混凝土之強度發展。於圖十二(a)(b)(c)中 CS 系列在早期時(齡期 28 天前)強度迅速,其斜率明顯高於其他系列,但在晚期(齡期 28 天以上)時強度發 展有停滯現象,然而其他系列強度發展持續;在於強度發展部份,各系列之混凝 土早期強度發展斜率高低依序為CS、CFS、COF、CF;晚期強度發展斜率高低 依序為COF、CF、CFS、CS。 綜觀上述現象之原因,係因 CS 系列所使用的矽 質奈米材料(Silica fume)顆粒小,其同體積之比表面積大,又矽灰所含 SiO
2
成分 極高(92%),促使矽質奈米材料快速產生卜作嵐反應,因此混凝土強度於早期迅 速發展,然而晚期強度發展斜率以COF 為高,係因各系飛灰中,係以 COF 所使 用之Overflow 飛灰顆粒較小,亦促使其產生卜作嵐反應而增加混凝土強度。1 10 100
0 10 20 30 40 50 60 70 80 90 100
Co m p re s s iv e st re n g th (M p a )
Age(days) CFS23 CF23 CS23 COF23
1 10 100
Age(days) CFS35 CF35 CS35 COF35
1 10 100 0
2000 4000 6000 8000 10000 12000 14000
C o m p re ssi v e st re n g th (p s i)
Age(days) CFS47 CF47 CS47 COF47
(a) 0.23 (b) 0.35 (c)0.47
圖十二 矽質奈米材料混凝土漿質之齡期與抗壓強度關係圖 超音波傳速率
(1) 矽質奈米材料改變
由圖4-36 及 4-38 中得知,於固定各種水膠比下,各系列之矽質奈米材料變
化下之關係,其任何水膠比下各系列之超音波傳速率最高為COF 之系列,其超
音波速率高低依序COF、CF、CFS、CS,以齡期 91 天水膠比為 0.23 為例,COF23 超音波傳速率達5005m/sec、CF23 超音波傳速率 4837m/sec、CFS23 超音波傳速 率達4733m/sec、CS23 超音波傳速率達 4613m/sec。以上述各系列混凝土超音波 傳速率與抗壓強度之關係未能相互呼應,而與混凝土新拌性質之新拌單位重與水 化熱偵測之最高溫度呼應。然而可分析,CS 系列混凝土由於矽灰之蓬鬆現象使 單位重較低,又新拌混凝土之水化熱之最高溫度引起內部產生裂縫;換言之,混 凝土之添加矽灰將使新拌單位重降低,新拌水化熱之溫度上升產生裂縫,然而導 致其超音波傳速率較低之緣由。
1 10 100 3600
3800 4000 4200 4400 4600 4800 5000 5200
Ul tr aso ni c Pul se V e lo ci ty (m /sec)
Age(days) CFS23 CF23 CS23 COF23
1 10 100
Age(days) CFS35 CF35 CS35 COF35
1 10 100
3600 3800 4000 4200 4400 4600 4800 5000 5200
Ul tr ason ic P u lse V e lo ci ty (m /s e c )
Age(days) CFS47 CF47 CS47 COF47
(a) 0.23 (b) 0.35 (c)0.47
圖十三 矽質奈米材料混凝土漿質之齡期與超音波速關係圖
四、結論
1. 飛灰進行 2 英吋渦錐分選時之礦漿濃度變化時 Overflow 粒徑分佈係受到礦 漿濃度的變化而改變,礦漿濃度愈高其粒徑分佈愈粗;噴流壓力改變時 Overflow 粒徑分佈係受到噴流壓力的變化而改變,噴流壓力愈大其粒徑分佈 愈細。
2. 飛灰進行渦錐分選時,礦漿濃度增加其產率隨著增加,噴流壓力增加其產率 隨著減少;本研究將選定礦漿濃度10%、噴流壓力 20psi(F1020),應用於水 泥漿與混凝土中,來進行下ㄧ部之研究。
3. 各式飛灰微觀結構上,Underflow 以及原樣飛灰中存在的不規則狀顆粒,為 未燃碳之顆粒,然而Overflow 飛灰為之不規則為在渦錐分選處理過程中,
小顆粒之間團聚現象。
4. 各式飛灰之成分分析,將從三相圖得知各式飛灰成分相異甚小;而隨著各式 飛灰D50 的降低其燒失量隨之減少,換言之,隨著粒徑細化其未燃之含碳 量降低。
5. 矽質奈米材料改變時,各系列混凝土與水膠比之水化熱最高溫度趨勢相似;
各系列之水泥漿與水膠比之水化熱最高溫度趨勢受其添加之矽質奈米材料 之顆粒表面積影響。
6. 各系列之混凝土早期之強度發展斜率高低依序為 CS、CFS、COF、CF;晚 期強度發展斜率高低依序為COF、CF、CFS、CS,係隨著添加之矽質奈米 材料之顆粒大小與所含SiO2 成分多寡相關。
7. 混凝土添加矽灰時,其超音波坡速成長,於短期內發生成長趨緩;混凝土添 加飛灰時,其超音波坡速成長隨齡期增加而成長。
8. 壓汞孔隙分析得知,矽質奈米材料改變下,以其顆粒排列大小與 SiO
2
有關,顆粒愈小其堆積排列愈佳以及SiO
2
愈高作嵐反應產物填塞孔隙,使內部累 積孔卜隙隨之愈小。出席國際學術會議心得報告
計畫編號 NSC96-2221-E011-116
計畫名稱 微奈米材料對混凝土骨材-水泥漿界面之研究
出國人員姓名 服務機關及職稱
黃兆龍
台灣科技大學營建工程系 會議時間地點 2007/09/03~05,比利時,根特
會議名稱 第五屆國際RILEM 自充填混凝土研討會(SCC2007)
發表論文題目 The effect of coating thickness on aggregate on the property of SCC by Fuller’s ideal curve and error function
一、參加會議經過
本次研討會論文共區分為九大主題:配比設計和新拌性質、拌和、流變性質、澆鑄、水化 和顯微結構、機械行為、耐久性和維修、特殊 SCC 和施工技術等。尤其是最後一個主題,特 別著重在世界各國所執行的案例上,藉以如「孔明擊鼓借箭」收集各種資訊,因此這次研討 會對自充填混凝土研究者和實務工作者都是具有相當意義的,會議上可以隨心所慾的討論使 用自充填混凝土碰到的問題,並共同透過腦力激盪,激發出具創意之解決方案,而且透過材 料應用技術來克服傳統混凝土給全世界「灰色不良」的印象。研討會共有三篇主題報告,一 百五十篇專題研究報告,共計有來自包含主辦國、法國、瑞典、德國、美國、西班牙等 33 個 國家,約 200 人參與,盛況空前。
二、與會心得 (一)、前言
本次SCC2007 研討會是繼 RILEM 於 1999 在瑞典斯德哥爾摩舉辦第一次國際自充填混凝 土後,陸續每二年不同地點舉行,以分享自充填混凝土學理及經驗,遂分別於日本東京 (2001)、冰島雷克雅未克(2003)、美國芝加哥(2005)及在比利時的根特鎮(2007)舉行,自充填 混凝土受到重視的程度,除了顯示它對混凝土的重要性,能夠解決過去傳統混凝土容昜產生 蜂窩、孔隙問題外,但也同時暗示它具有潛在頩頸存在,如泌水、析離、沉澱等問題,仍有 待世界共同解決。
(二)、專題報告內容
本人的文章被安排在第一天「配比設計和新拌性質」中A6 場次,論文內容(見附錄所示) 主要敘述台灣自從1983 年即已成熟發展的自充填混凝土及高性能混凝土,並且已經成功應用 在高雄東帝士85 摩天大樓及台北 101 國際金融中心等台灣地標性建築上,該研究係受到國科 會專案計畫補助,為應用 Fuller 級配曲線模擬「緻密配比」的固體粒料分佈曲線的方法,以 探討 HPC 及 SCC 之最適水泥漿「質」和「量」及其對混凝土性質之影響。研究首先將混凝
土顆粒組成部分進行理論與實際解分析,其次則以裹漿厚度 t 為變數(10、20 和 30mm),配合 不同水泥漿質(w/b=0.28、0.32 和 0.40)進行一系列試驗。研究結果顯示,在強塑劑減水性能允 許下,漿質越高與裹漿量厚度越薄之配比,其流動性能越佳,而漿量厚度愈厚,漿量愈多之 混凝土則早期強度較高,但於晚期後則如預期之發展,以漿量愈少之硬固性質較佳;使用較 多骨材能阻止氯離子滲透,降低裹漿厚度為降低混凝土電滲量最有效之方法。此種混凝土所 使用的水泥只有一般同一品質混凝土的一半以下,可減少大量CO
2
排放,是一種綠混凝土。(三)、後記
參加本次研討會可以看出各國的努力,想快速解決使用自充填混凝土的困擾,台灣幸運 很早就接觸到高流動化高性能混凝土的大型工程,實際上已解決國際上目前所碰到的問題,
為了避免沉澱、泌水的發生,最簡單的方法就是減少水泥及水量,增加骨材的使用量,如此 同時解決了CO
2
的排放、生態保護、永續存在及提昇長期強度的目的了,這也是本文發表的 主旨。The effect of coating thickness on aggregate on the property of SCC by Fuller’s ideal curve and error function
C.L. Hwang (1), S.L. Hsieh (2) and Y.Y. Chen (3)
(1) Department of Construction Engineering, National Taiwan University of Science and Technology, Taiwan, ROC
(2) NTUST, Nanya Institute of Technolog
,
, Taiwan, ROC(3) Department of Architecture Engineering, Hwa-Sha Institute of Technology, Taiwan, ROC
Abstract
The main theme of this study is to design the SCC mixture via Fuller’s gradation curve as well as minimum coating thickness. Such theoretical method is more practical than previous finding of Densified Mixture Design Algorithm (DMDA) for HPC with the least cement and water content.
The Fuller’s gradation curve and error function are applied to find the theoretical blended ratio of all solid materials down to nano-size particles. The surface area of aggregate is calculated by assuming spherical aggregate particles to simplify the calculation. Then, the void of paste (Vv) and the paste content with specific quality can be estimated. At the end the physical properties including fresh and hardened stages are used as a basis to select the optimal and proper thicknesses of paste for SCC to avoid bleeding and segregation problems. The result indicates that the thinner the coating thickness on aggregate the better the long-term property.
1. INTRODUCTION
A Essentially the common high performance concrete (HPC) and Japanese self-compacting concrete (SCC) adopt traditional formula, and the major consideration of these concretes is to increase workability of SCC or HPC by simply adding water depending on the maximum size of coarse aggregate and to increase strength by merely adding cement based on the same water content
[1]
. This way is often ended up with rich mix that is not only liable to cause bleeding or segregation, but also cause the volume instability[1, 2]
. According to some concrete research works[3, 4, 5, 6]
, reducing water content is the major strategy to reduce bleeding and segregation and as well to improve the volume stability[3, 4]
. In order to significantly reduce the quantity of lubricating paste but keep desired workability, the Hwang’s research group tried to achieve the maximum dry loose density by simply packing all solid particles including coarse aggregates, sand and fly ash[1, 7~15]
. As the kind of material is less than three, the blend ratio (α, β)[10, 11, 16~18]
of solid materials can be easily obtained by laboratory experimental work, whereas if the kinds of material are more than three the packing seems difficult especially as the material finer than mm in size. Therefore, it is suggested to adopt numerical analysis method to obtain proper packing order of all granularbeen successfully applied to asphalt concrete (AC), for concrete it has been only applied to blended coarse and fine aggregates but not been efficiently applied to fine particles
[20]
. This study will use Fuller’s Curve as the hypothetical curve and the aggregates in size ranging from mm, mm to nm to enable packing aggregate grading to satisfy the requirement of Fuller’s Curve. Through thecalculation of integration, the surface area of each aggregate S is gotten and the formula,
S V t V P
−v
= , is gained and serves as an approximation solution to the cement paste thickness after
the derivation of
V p
=N
×V v
=V v
+S
⋅t
. To simplify the derivation, the aggregates are presumed as circular, which definitely appears different from reality and thus gives rise to errors. After the determination of the cement paste thickness, in order to acquire the optimal thickness, a series of paste thickness are undertaken to observe its influence on concrete workability so as to obtain the minimum coating thickness (tmin
) under the optimal aggregate blended ratio. At the end, the physical properties including fresh stage and hardened stages are used as a basis to select the optimalthickness of paste for SCC or HPC to avoid bleeding and segregation problems. The result indicates that the thinner the coating thickness on aggregate the better the long-term property.
2. RESEARCH PLAN
The study stands on the theoretic structure of densified mix design and combines Fuller’s grading curve to simplify the process of concrete mix design by using calculation of derivation of each process and finally to optimize the mixture proportion of concrete.
2.1 Material and Mixture design
In this study type I Portland cement is used. Class F fly ash and BF Slag are from Taiwan Power Company, China Steel Corporation, respectively. The superplasticizer (SP) is Glenium 51 from Taiwan Durusle Company, Taiwan. Nine concrete mixtures were prepared using the mixture model of Fuller’s ideal curve theory and these mixtures were three coating thickness on aggregate (t
= 10, 20, 30mm) and three w/b ratios of 0.28, 0.32 and 0.4.
2.2 The mixture model of Fuller’s theory
Step1: To estimate mixture proportions of aggregates based on Fuller’s grading curve and error function:
P = 100 (d/D)
h
; h=1/3~1/2………..………(1)∑ ∑ = =
⎟ ⎠
⎜ ⎞
⎝
⎛ −
=
= m
j n
i
j j
i k
a R
M
1
2
1 , i
2 P v
...(2) Getting P1 : P 2 : P 3 ……: P n
(Ex : Pstone
: Psand
: Pfly ash
)Step2: To calculate total surface area (S) of aggregates by means of statistic:
This calculation requires the above-mentioned aggregate grading data, which uses
(
−)
⎜⎜⎝⎛ − ⎟⎟⎠⎞=
+
+ 1 , , , 1
,
1 1 ln
ln , 6
j i j i j i j
i
j d d d d
Kss
to get the surface area of each aggregate and to total theentire surface area of aggregates by using
∑
=
⎥⎦
⎢ ⎤
⎣
⎡ ⎟⎟⎠
⎜⎜ ⎞
⎝
⎛ +
=
10
1
, 2 2 2 , 1 1
1
,j
j j
j p a Kss
p a
Ksst
γ γ .Step3: To estimate the coating paste thickness:
The experiment is conducted to obtain the dry loose density (Uw) of blended aggregates. After determining the paste thickness (t), then uses the formula Vc (cement paste
volume)=
Vv S t r
G W
W si
i − = ⋅
∑ ⋅
to compute the cement amount.Step4: To compute the amount of each ingredient material
HPC in general consists of coarse aggregates (
w stone
), fine aggregates (w sand
), fly ash (w flyash
),cement (
w cement
), Blast-furnace slag (w slag
) and water (w water
). To solve the blended ratios of ingredient materials, six conditional equations can be enumerated according to relations, and the amount of each material can be derived via matrix analysis as the formula below:⎥⎥
⎥⎥
⎥⎥
⎥⎥
⎦
⎤
⎢⎢
⎢⎢
⎢⎢
⎢⎢
⎣
⎡
water slag cement
flyash sand stone
w w w w w w
⎥⎥
⎥⎥
⎥⎥
⎥⎥
⎦
⎤
⎢⎢
⎢⎢
⎢⎢
⎢⎢
⎣
⎡
−
−
−
⎥⎥
⎥⎥
⎥⎥
⎥⎥
⎦
⎤
⎢⎢
⎢⎢
⎢⎢
⎢⎢
⎣
⎡
−
−
−
− +
⋅ +
⋅
−
−
−
−
⋅
⋅
=
−
0 0 0 0 1
0 1 0
0 0
1 0
0
0 0
0 0
1
0 0
0 0
1
0 0
0 0
1 1
1
1 1
1 1
3 1 2
1
v a
v
b w b
w b
w p p p
p
V V
V t
Ksst t
Ksst
t Ksst t
Ksst
sand stone
water slag
cemcnt flyash
ξ ξ
γ γ
γ γ
γ γ
In addition, the dosage of the SP is calculated from experimental result by following formula
[1]
: SP1
(%)=3.8329+2.7156×10⁻²
×Wcement -1
×8.038×10-4
×Wcement 2
…………..………….(3)3. RESULTS AND DISCUSSIONS
In this study, proportion of each solid state material was decided according to Fuller’s curve and cumulative surface area S of each material was figured out according to this proportion and Vv.
Paste content was figured out with different thickness of paste byVp=Vv+S⋅t, concrete
proportion were figured out reversely with “matrix analysis” and optimal quantity and quality were finally decided with fresh and hardened concrete characteristics.
3.1
Property of Fresh ConcreteMixing group with high concentration paste has high viscosity and is not easy to bleed. High viscosity paste can enhance the dragging force of larger aggregate not to centralize when pouring concrete and concrete flows uniformly. As the quantity of paste is reduced, the aggregates will contact each other so as preventing sediment and segregation of aggregate. With the addition cementitious material and SP the aggregate will flow freely due to bearing effect of granular material and the repulsion effect of surfactant without bleeding and segregation. Therefore, the magic power of SP brings high density, low water content and low cement content mixture to flow as SCC without bleeding and segregation. The thicker the paste the lower the slump loss and the slump flow loss.
3.2
Influence of Quantity and Quality of Paste on Property of Hardened ConcreteCompressive strength
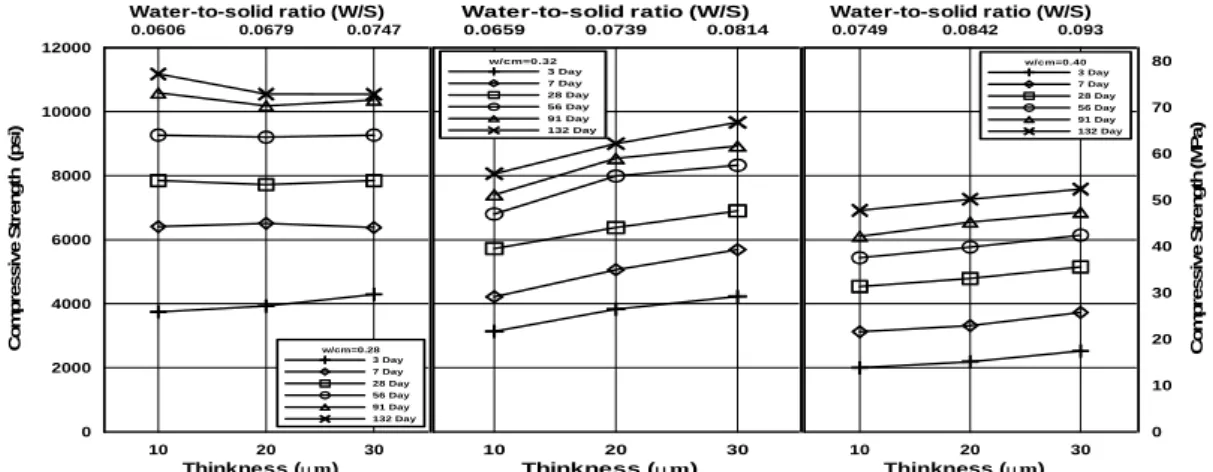
Fig. 1 shows relationship between compressive strength and coating thickness of paste ( mμ ) as well as w/s ratio. The slope of such curve reduces with the age of specimen. Based on the same water-to-binder (w/b) ratio, it shows the thicker the paste the better the strength at the early age.
However, the long-term growth for different thickness has shown the thicker the thickness the higher the w/s ratio and the lower the strength. It indicates that the water content significantly affect the long-term strength of concrete. The strength comes from packing of aggregate and hydration of both cement and pozzolanic material (PM) especially after 28-56 days. The group with low w/b ratio surely achieves higher strength than other mixture with high w/b ratio. As comparing the w/s ratio on the upper axia, it is shown that the higher the w/s will has more void space in the paste system and has more calcium hydroxide produced available for the reaction of PMs. Hence after 56 days age the strength continuously growth with high amount of paste but it will be expected in the long run the strength growth curve will look like the one with w/b ratio of 0.28.
Electrical Resistance
Fig. 2 shows relation between electrical resistance and coating thickness of concrete as well as w/s ratio. The general trend is the more the coating thickness, the higher the w/s ratio and the lower the resistance. It means the water content actually conducting current and reducing the resistance, but pozzolanic reaction tend to block the pore system and contribute to high resistance. Since large amount of PM, pozzolanic reaction is expected not significant in early age and resistivity is low.
Ultrasonic Pulse Velocity (UPV)
Fig. 3 shows relation between UPV and quantity and quality of paste. It shows that with fixed quality of paste, the thicker the paste the faster the UPV. With fixed thickness of paste, the better the quality of paste (i.e., lower w/b ratio), the less the macro-and micro- pores, the higher UPV.
Chloride Ion Permeability (CIP)
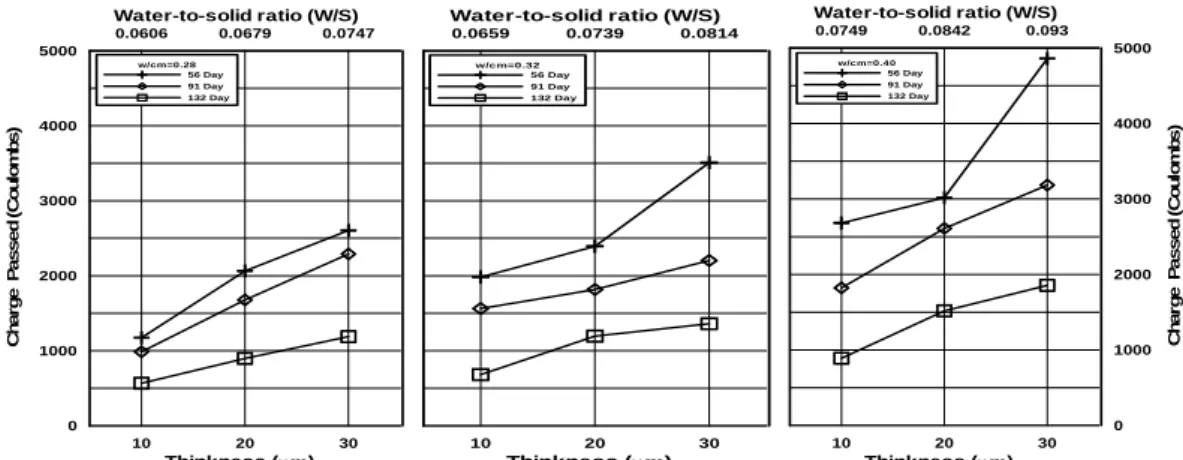
Fig. 4 shows that the value of CIP in 132 days are all well below 2000 coulomb. The result shows the thicker the paste the higher the density and the lower the CIP. Since large amount aggregate is adopted in all mixture which reduces the penetration path of chloride ion, and the low CIP is expected. Quality of the paste is improved and remaining large pores after cement hydration are being filled with PM. Permeability is reduced constantly with the growing of pozzolanic
reaction products. The mixing group with the minimum coating paste (t=10mm) has the lowest CIP value below 1000 coulomb at age of 132 days. It indicates that the best approach to reduce CIP is to reduce the thickness as well as the amount of paste and increase aggregate content.
10 20 30
Thinkness (μm) 0
4000 8000 12000
2000 6000 10000
C o m p re s s ive S tr e n g th ( p s i)
0.0606 0.0679 0.0747
Water-to-solid ratio (W/S)
w/cm=0.28 3 Day 7 Day 28 Day 56 Day 91 Day 132 Day
10 20 30
Thinkness (μm)
0.0659 0.0739 0.0814
Water-to-solid ratio (W/S)
w/cm=0.32 3 Day 7 Day 28 Day 56 Day 91 Day 132 Day
10 20 30
Thinkness (μm)
0.0749 0.0842 0.093
Water-to-solid ratio (W/S)
0 20 40 60 80
10 30 50 70
C o m p re ss iv e S tr e n g th ( M P a )
w/cm=0.40 3 Day 7 Day 28 Day 56 Day 91 Day 132 Day
Fig. 1 The compressive strength growth vs. quality and quantity of cementitious material.
10 20 30
Thinkness (μm) 0
20 40 60 80 100
E le c tr ical r e s ist an c y ( k Ω -c m )
0.0606 0.0679 0.0747
Water-to-solid ratio (W/S)
w/cm=0.28 3 Day 7 Day 28 Day 42 Day 56 Day 91 Day 132 Day
10 20 30
Thinkness (μm)
0.0659 0.0739 0.0814
Water-to-solid ratio (W/S)
w/cm=0.32 3 Day 7 Day 28 Day 42 Day 56 Day 91 Day 132 Day
10 20 30
Thinkness (μm)
0.0749 0.0842 0.093
Water-to-solid ratio (W/S)
0 20 40 60 80 100
E lect ri cal r e si st an c y ( k Ω -c m )
w/cm=0.40 3 Day 7 Day 28 Day 42 Day 56 Day 91 Day 132 Day
Fig. 2 The concrete resistivity vs. quality and quantity of cementitious
10 20 30
Thinkness (μm) 3600
4000 4400 4800 5200
U lt ra s o n ic p u lse v e lo ci ty ( m /s e c )
0.0606 0.0679 0.0747
Water-to-solid ratio (W/S)
w/cm=0.28 3 Day 7 Day 28 Day 42 Day 56 Day 91 Day 132 Day
10 20 30
Thinkness (μm)
0.0659 0.0739 0.0814
Water-to-solid ratio (W/S)
w/cm=0.32 3 Day 7 Day 28 Day 42 Day 56 Day 91 Day 132 Day
10 20 30
Thinkness (μm)
0.0749 0.0842 0.093
Water-to-solid ratio (W/S)
3600 4000 4400 4800 5200
U lt ras o n ic p u ls e v e lo c it y ( m /sec )
w/cm=0.40 3 Day 7 Day 28 Day 42 Day 56 Day 91 Day 132 Day
Fig. 3 The ultrasonic pulse velocity vs. quality and quantity of cementitious material.
10 20 30 Thinkness (μm) 0
1000 2000 3000 4000 5000
C h ar g e P a sse d ( C o u lo m b s )
0.0606 0.0679 0.0747
Water-to-solid ratio (W/S)
w/cm=0.28 56 Day 91 Day 132 Day
10 20 30
Thinkness (μm)
0.0659 0.0739 0.0814
Water-to-solid ratio (W/S)
w/cm=0.32 56 Day 91 Day 132 Day
10 20 30
Thinkness (μm)
0.0749 0.0842 0.093
Water-to-solid ratio (W/S)
0 1000 2000 3000 4000 5000
C h a rg e P ass ed ( C o u lo m b s)
w/cm=0.40 56 Day 91 Day 132 Day
Fig. 4 The chloride ion penetration vs. quality and quantity of cementitious
4. CONCLUSIONS
− Under Fuller’s ideal grading curve and error function, the quantitative approach may be introduced into concrete science especially for composite material with efficiency. The aggregate blended ratio including micro and nanosize particle obtained by Fuller’s curve analysis method met the dense requirement of solid material.
− The fresh property of concrete so designed with low water and low cement content can flow as SCC or high flowing HPC without bleeding and segregation. The thicker the paste the lower the slump loss and the slump flow loss.
− The compressive strength relates well with coating thickness of paste (mm) as well as w/s ratio. The slope of such curve reduces with the age of specimen, the long-term growth for different thickness has shown the thicker the thickness the lower the strength while the higher the w/s ratio.
− The Fuller’s ideal gradation method that is reducing whole void by using dense aggregate structure could not only achieve the objective of macroscopic dense but also reduce the amount of paste in concrete and inferior gene in concrete. Reducing electrical resistance of concrete is to reduce the thickness of paste and to use more aggregates shall be adopted to prevent permeability of chloride ion.
ACKNOWLEDGEMENTS
The authors are grateful thank for the support of this work by the National Science Council of the Republic of China (Contract # NSC 94-2211-E-011-032). And many thanks to C. C. Chang and S. T. Yeh of Hwang’s research group for their help in providing the laboratory test results.
REFERENCES
[1] Hwang, C.L., ‘The Theory and Practice of High Performance Concrete, Janes’ Book Publisher Co.
(Taiwan, 2003).
[2] Okamura, H., ‘Self Compacting High Performance Concrete’, ACI Concrete International (July 1997).
[3] Neville, A., ‘How Useful is the Water-Cement Ratio’, Concrete International (September, 1999).
[4] Neville, A., ‘Water and Concrete: A Love-Hate Relationship’, ACI concrete International 22 (12) (1997) 34-38.
[5] Steeven, H.K., Kerkhoff, B. and Panarese, W.C., ‘Design and Control of Concrete Mixtures’, Portland Cement Association, Skokie, Illionois (U. S. A., 2003).
[6] H. Okamula, K. Maekawa and K. Ozawa, High performance Concrete, Social System Institute (Tokyo, 1993).
[7] Lin, C.H., Ling, F.S. and Hwang, C.L., ‘Flexural Behavior of High Strength Fly Ash Concrete Beams’, Journal of Chinese Institute of Engineering 15 (1) (1992) 85-92.
[8] Chang, T.P., Ling, C.Y., Hwang, C.L. and Wang, Y.F., ‘The Influence of Steel Fiber and Silica Fume on the Properties of Cold-bond Fly Ash Aggregate High Strength Concrete’, Journal of The Chinese Institute of Civil and Hydraulic Engineering 7 (3) (1995) 379-385.
[9] Hwang, C.L. and Liu, J.J., ‘Effect of Fly Ash on the Characteristics of High-Performance Concrete’, Fifth CANMET/ACI International Conference on Fly Ash, Silica Fume, Slag and Natural Pozzolans in Concrete, Milwaukee, 1995, 171-188.
[10] Hwang, C.L., Chen, J.C., Jiang, M.Y. and Guo, J.X., ‘The Effects of Water Content on the Properties of High Performance Concrete’, Journal of The Chinese Institute of Civil and Hydraulic Engineering 9 (4) (1997) 561-570.
[11] Tsai, Z.X. and Hwang, C.L., ‘The Effects of Cement Type and Paste Content on the Properties of High Performance Concrete’, Journal of The Chinese Institute of Civil and Hydraulic Engineering 12 (1) (2000) 1-9.
[12] Liu, C.G., ‘The Surrounding Compact Theory of Concrete Aggregate’, Journal of Hydraulic Engineer (China, 1964) 59-64.
[13] Chen, Y.Y. and Hwang, C.L., ‘The Effect of Total Binder Amount on the Properties of HPC’, Journal of The Chinese Institute of Civil and Hydraulic Engineering 13 (1) (2001) 207-215.
[14] Hwang, C.L. and Chen, Y.Y., ‘The Property of Self-Consolidating Concrete Designed by Densified Mixture Design Algorithm’, The Proceedings of First North American Conference On The Design And Use of Self-Consolidating Concrete (ACBM, 2002) 121-126.
[15] Lee, L.S. and Hwang, C.L, ‘A Quality Assurance System of SCC in Taiwan’, The Proceedings of First North American Conference on the Design and Use of Consolidating Concrete (ACBM, 2002) 275-280.
[16] Hwang, C.L., ‘Overall Planning of the Application of HPC to T & C Tower’, Seminar on High-Performance Concrete (Taipei, 1993) 147-160.
[17] Chang, T.P., Hwang, C.L., Ling, C.Y. and Wang, Y.F., ‘The Engineering Properties of Cold-bond Fly Ash Aggregates and the Characteristics of the High-Strength Concrete with these Aggregates’, Journal of The Chinese Institute of Civil and Hydraulic Engineering 7 (2) (1995) 191-198.
[18] Tsai, C.T., Lee, L.S. and Hwang, C.L., ‘The Effect of Aggregate Gradation on Engineering Properties of High Performance Concrete’, Journal of ASTM International 3 (3) 2006.
[19] Fuller, W. B. and Thompson, J. E., ‘The Laws of Proportioning Concrete’, A.S.C.E. Transactions (LIX) (1926) 67-172.
[20] Shakhmenko, G. and Birsh, J., ‘Concrete Mix Design and Optimization’, PhD Symposium in Civil Engineering (Budapest, 1998).