R E S E A R C H Open Access
Glycogen production for biofuels by the euryhaline cyanobacteria Synechococcus sp. strain PCC 7002 from an oceanic environment
Shimpei Aikawa 1,2 † , Atsumi Nishida 1 † , Shih-Hsin Ho 3 , Jo-Shu Chang 4,5,6 , Tomohisa Hasunuma 3,7 and Akihiko Kondo 1,2,8,9*
Abstract
Background: Oxygenic photosynthetic microorganisms such as cyanobacteria and microalgae have attracted attention as an alternative carbon source for the next generation of biofuels. Glycogen abundantly accumulated in cyanobacteria is a promising feedstock which can be converted to ethanol through saccharification and fermentation processes. In addition, the utilization of marine cyanobacteria as a glycogen producer can eliminate the need for a freshwater supply. Synechococcus sp. strain PCC 7002 is a fast-growing marine coastal euryhaline cyanobacteria, however, the glycogen yield has not yet been determined. In the present study, the effects of light intensity, CO 2 concentration, and salinity on the cell growth and glycogen content were investigated in order to maximize glycogen production in Synechococcus sp. strain PCC 7002.
Results: The optimal culture conditions for glycogen production in Synechococcus sp. strain PCC 7002 were investigated. The maximum glycogen production of 3.5 g L −1 for 7 days (a glycogen productivity of 0.5 g L −1 d −1 ) was obtained under a high light intensity, a high CO 2 level, and a nitrogen-depleted condition in brackish water. The glycogen production performance in Synechococcus sp. strain PCC 7002 was the best ever reported in the α-polyglucan (glycogen or starch) production of cyanobacteria and microalgae. In addition, the
robustness of glycogen production in Synechococcus sp. strain PCC 7002 to salinity was evaluated in seawater and freshwater. The peak of glycogen production of Synechococcus sp. strain PCC 7002 in seawater and freshwater were 3.0 and 1.8 g L −1 in 7 days, respectively. Glycogen production in Synechococcus sp. strain PCC 7002 maintained the same level in seawater and half of the level in freshwater compared with the optimal result obtained in brackish water.
Conclusions: We conclude that Synechococcus sp. strain PCC 7002 has high glycogen production activity and glycogen can be provided from coastal water accompanied by a fluctuation of salinity. This work supports Synechococcus sp. strain PCC 7002 as a promising carbohydrate source for biofuel production.
Keywords: Carbon source, Cyanobacteria, Glycogen, Salinity, Synechococcus sp. strain PCC 7002
* Correspondence: [email protected]
†
Equal contributors
1
Department of Chemical Science and Engineering, Graduate School of Engineering, Kobe University, 1-1 Rokkodai, Nada, Kobe 657-8501, Japan
2
Core Research for Evolutional Science and Technology, Japan Science and Technology Agency, 3-5 Sanban, Chiyoda, Tokyo 102-0075, Japan Full list of author information is available at the end of the article
© 2014 Aikawa et al.; licensee BioMed Central Ltd. This is an Open Access article distributed under the terms of the Creative
Commons Attribution License (http://creativecommons.org/licenses/by/2.0), which permits unrestricted use, distribution, and
reproduction in any medium, provided the original work is properly credited. The Creative Commons Public Domain
Dedication waiver (http://creativecommons.org/publicdomain/zero/1.0/) applies to the data made available in this article,
unless otherwise stated.
Background
Currently, biorefinery, including production of biofuels and bio-based chemicals, has received considerable at- tention. Additionally, environmental concerns and the depletion of oil reserves have resulted in promoting re- search on more environmentally benign and sustain- able biofuels such as bioethanol.
Oxygenic photosynthetic microorganisms, including cyanobacteria and microalgae, have attracted attention as an alternative carbon source for biorefineries [1-3]. Cyano- bacteria and microalgae convert solar energy to biomass more efficiently (0.5 to 2.0% efficiency) than energy crops such as switchgrass (0.2% efficiency) [4], and their α- polyglucans such as glycogen from cyanobacteria or starch from microalgae, can be converted to bioethanol by yeast fermentation [5-9]. In addition, they are capable of growing in aquatic environments, providing the additional benefit of whole-year cultivation using non-arable land. In particu- lar, the cultivation of cyanobacteria and microalgae using seawater or brackish water eliminates the impact on fresh- water resources [10]. These carbohydrate-producing spe- cies need to tolerate a wide salinity range because the salinity of coastal water fluctuates with changes in fresh- water inflow by climate, weather, and diurnal tidal current.
Therefore, in the current study, the euryhaline cyanobac- teria Synechococcus sp. strain PCC 7002, which is well- suited for growing in a coastal region, was selected as a carbohydrate producer. Synechococcus sp. strain PCC 7002 is naturally transformable and its genome has been fully sequenced [11]. Based on these superior characteristics, Synechococcus sp. strain PCC 7002 is a model organism for research on cyanobacterial metabolites and is expected to be a platform for biotechnological applications by meta- bolic engineering [12-17].
According to definition, glycogen productivity is estimated from glycogen content and biomass productivity. To im- prove glycogen productivity in cyanobacteria, both the glyco- gen content and biomass productivity need to be enhanced.
In general, glycogen is accumulated via nitrogen depletion in many cyanobacteria species, such as Synechococcus sp. strain PCC 7002, Synechocystis sp. strain PCC 6803, Arthrospira platensis, Arthrospira maxima, Anabaena variabilis, and Anacystis nidulans [16-23]. Unfortunately, high glycogen content is generated under nitrogen depletion which is asso- ciated with low biomass productivity [19,23]. Hence, it is important to obtain a high biomass productivity with a satis- factory glycogen content. However, the integral effect of growth conditions on glycogen production in Synechococcus sp. strain PCC 7002 has not been fully investigated.
In the present study, the glycogen production activity of euryhaline cyanobacteria Synechococcus sp. strain PCC 7002 was examined under several combined growth condi- tions, including CO 2 concentration, light intensity, salinity, and nitrate supply.
Results
Effect of light intensity and CO 2 concentration on cell growth
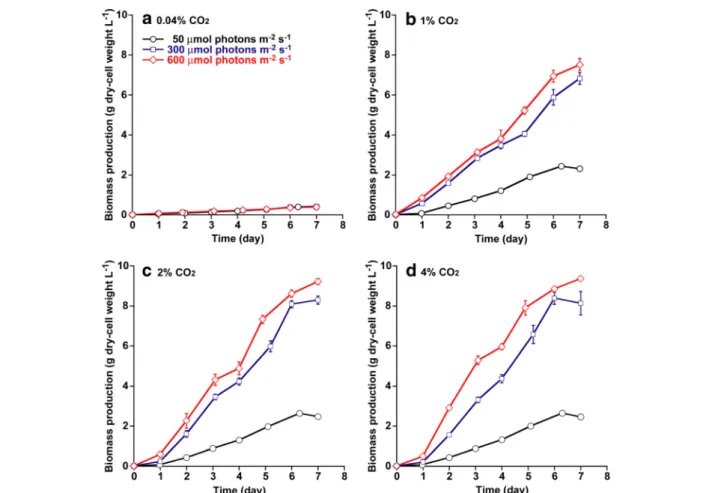
Light intensity and CO 2 concentration are the key envir- onmental factors for cyanobacterial cell growth [1]. In this study, Synechococcus sp. strain PCC 7002 was cultivated on medium A for 7 days under a light intensity of 50 to 600 μmol photons m −2 s −1 with various CO 2 concentra- tions as depicted in Figure 1 (for example, 0.04 to 4% CO 2
in air). As shown in Figure 1a, cell growth in 0.04% CO 2
in air (the atmospheric CO 2 level) was not altered by an increase in light intensity. On the other hand, the cell density of Synechococcus sp. strain PCC 7002 tended to in- crease when increasing CO 2 concentration from 0.04 to 2% and increasing light intensity from 50 to 600 μmol photons m −2 s −1 . However, further increases in CO 2 con- centration to 4% resulted in no significant difference in cell growth under low and high light intensity, suggesting that excess CO 2 supply (4%) would not provide a positive effect on cell growth. According to Figure 1, Synechococcus sp. strain PCC 7002 cultivated under conditions of high CO 2 concentration (2 and 4% CO 2 ) with high illumination (600 μmol photons m −2 s −1 ) reached the highest cell density of around 9 g L −1 after 7 days of cultivation. Thus, both enriched CO 2 supply and high light intensity enhanced the cell growth of Synechococcus sp. strain PCC 7002.
Effect of light intensity and CO 2 concentration on glycogen content and glycogen production
Light intensity and CO 2 supply do not only influence the growth of photosynthetic organism but also alter their carbohydrate content [24-26]. Therefore, in this study, the effect of light intensity (50 to 600 μmol photons m −2 s −1 ) and CO 2 concentration (such as 0.04 to 4% CO 2 ) on glycogen content were explored, as shown in Figure 2a.
Glycogen content increased with an increase in light in- tensity from 50 to 600 μmol photons m −2 s −1 .
As shown in Figure 2a, the glycogen content under 300 μmol photons m −2 s −1 increased from 0.8 to 19% as the CO 2 concentration increased from 0.04 to 1%, and under the same range of CO 2 concentrations at 600 μmol photons m −2 s −1 , it increased from 9.4 to 31%. However, further in- crease in CO 2 concentration to 2% under 300 or 600 μmol photons m −2 s −1 did not enhance glycogen content.
Glycogen production under 50 to 600 μmol photons m −2 s −1 in 0.04 to 4% CO 2 after 7 days was calculated from biomass production and glycogen content, as shown in Figure 2b. The maximum glycogen produc- tion of 2.5 g L −1 was obtained under 600 μmol photons m −2 s −1 in 2% CO 2 . Hence, glycogen production in Synechococcus sp. strain PCC 7002 was significantly im- proved by the combined optimization of CO 2 concen- tration and light intensity.
Aikawa et al. Biotechnology for Biofuels 2014, 7:88 Page 2 of 8
http://www.biotechnologyforbiofuels.com/content/7/1/88
Effect of nitrate supply in different salinity media on glycogen production under high light and high CO 2 conditions
The accumulation of glycogen occurs in many cyanobacteria, such as Synechococcus sp. strain PCC 7002, Synechocystis sp.
strain PCC 6803, A. platensis, A. maxima, A. variabilis, and A. nidulans, under nitrogen-depleted conditions [16-23].
However, high levels of glycogen are generated under nitro- gen depletion, which is associated with low biomass product- ivity [19,23]. Therefore, in this study, the effect of nitrate
Figure 2 Glycogen content and glycogen production after 1 week under different light intensities and CO
2concentrations.
(a) Glycogen content; (b) glycogen production. Light intensities are 50 (white bars), 300 (gray bars), and 600 μmol photons m
−2s
−1(Black bars).
Data points are mean values from three separate cultures with SD of triplicates.
Figure 1 Growth curve under different light intensities and CO
2concentrations. (a) Growth curve under 0.04% CO
2; (b), 1% CO
2; (c), 2%
CO
2; and (d), 4% CO
2. Light intensities are 50 (circles), 300 (squares), and 600 μmol photons m
−2s
−1(diamonds). Error bars indicate standard
deviations (SD) of three replicated experiments. In some data points, error bars obtained by three replications are smaller than symbols.
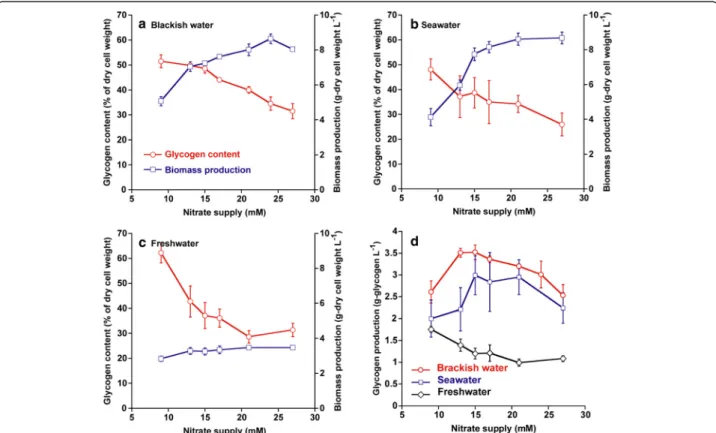
supply on both glycogen content and biomass production in Synechococcus sp. strain PCC 7002 under 600 μmol photons m −2 s −1 and 2% CO 2 was investigated. Addition- ally, in case of cultivation in brackish water or seawater at a coastal region, the salinity of medium was fluctuated ac- cording to climate, weather, and diurnal tidal current.
Therefore, to estimate the glycogen productivity of Syne- chococcus sp. strain PCC 7002 under different salinity con- ditions, the glycogen content and biomass production in brackish water (Figure 3a), seawater (Figure 3b), and fresh- water (Figure 3c) media were examined. The glycogen content of Synechococcus sp. strain PCC 7002 in all media increased with a drop of nitrate concentration from 27 to 9 mM, reaching 52, 50, or 62% of dry-cell weight in brack- ish water, seawater, or freshwater medium, respectively.
Unfortunately, the biomass productions were suppressed below 21 mM in brackish water and below 15 mM in sea- water (Figure 3a,b). Thus, in this study, the glycogen pro- duction of Synechococcus sp. strain PCC 7002 in each medium was calculated in order to optimize the nitrate concentration to obtain a suitable combination of biomass production and glycogen content, as shown in Figure 3d.
The peak of glycogen production was 3.5 g L −1 in brackish water with 13 and 15 mM nitrate, 3.0 g L −1 in seawater
with 15 mM nitrate, or 1.8 g L −1 in freshwater with 9 mM nitrate (Figure 3d). Glycogen production in Synechococcus sp. strain PCC 7002 maintained the same level in seawater and half of the level in freshwater compared with the level achieved in brackish water.
Discussion
Cyanobacterial glycogen is remarkable carbon source for bioethanol production by yeast fermentation [5]. As shown in Figure 2a, glycogen accumulated under high light inten- sity and high CO 2 concentration. In vitro and in situ kinetic experiments have revealed that cyanobacterial glycogen synthesis is regulated by adenosine diphosphate (ADP)-glu- cose pyrophosphorylase (AGPase) activity, which is en- hanced by 3-phosphoglycerate (3-PG) accumulation and inhibited by inorganic phosphorus accumulation [27].
Therefore, 3-PG might be accumulated by the increase in light intensity and CO 2 concentration, which would lead to glycogen accumulation in Synechococcus sp. strain PCC 7002.
The glycogen production of Synechococcus sp. strain PCC 7002 was examined under different nitrate additions in a brackish water medium (Figure 3a). As shown in Additional file 1: Figure S1, cell growth in brackish water media under
Figure 3 Biomass production, glycogen content, and glycogen production after 1 week under different salinity conditions. (a) Biomass production (circles) and glycogen content (squares) in brackish water; (b) in seawater; and (c) in freshwater; (d) glycogen production under different nitrate supplies in brackish water (circles), seawater (squares), and freshwater (diamonds). Cells were cultivated under 600 μmol photons m
−2s
−1and 2% CO
2. Data points are mean values from three separate cultures with SD of triplicates.
Aikawa et al. Biotechnology for Biofuels 2014, 7:88 Page 4 of 8
http://www.biotechnologyforbiofuels.com/content/7/1/88
9 and 15 mM nitrate supplies were inhibited by nitrogen limitation. Under nitrogen-limiting conditions, biomass production would be strongly inhibited due to the rela- tively low photosynthesis efficiency, expecting that light- harvesting proteins (such as phycobiliproteins) would be degraded to compensate for the insufficient nitrogen avail- ability [28]. On the other hand, the glycogen content in cyanobacteria is accumulated by nitrogen depletion [16-20].
Since lower initial nitrate supplies caused faster nitrate de- pletion (as shown in Additional file 2: Figure S2), glycogen content increased gradually with a decrease in initial sup- plied nitrate as shown in Figure 3a.
In addition, glycogen production was influenced by salinity in medium as shown in Figure 3a-d. Glycogen production in seawater was a little lower than brackish water, which was caused by the lower glycogen content (Figure 3a,b,d). Glycogen content in seawater would be reduced by the accumulation of osmolytes, such as glu- cosylglycerol, glucosylglycerate, and sucrose in Synecho- coccus sp. strain PCC 7002, with an increase in sodium chloride concentration [16,17,30]. Also, the decline of glycogen production in freshwater was due to lower bio- mass production (Figure 3a,c,d). High cell density in Synechococcus sp. strain PCC 7002 could not be ob- tained in the freshwater medium.
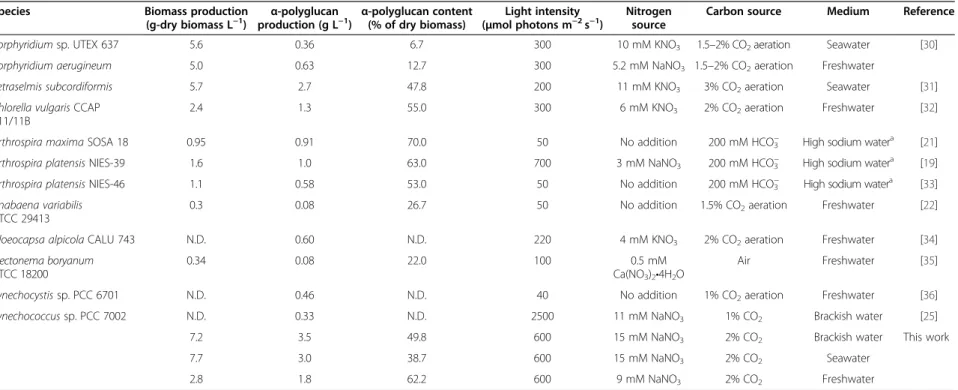
The biomass production and α-polyglucan production in various cyanobacteria and microalgae are summarized in Table 1. The highest biomass production (7.2 g L −1 ) and α-polyglucan production (3.5 g L −1 ) from Synecho- coccus sp. strain PCC 7002 under the optimal conditions with the brackish water medium are higher than that re- ported by other studies [19,21,22,25,30-36]. In addition, glycogen production of Synechococcus sp. strain PCC 7002 in a seawater and freshwater environment is greater than or similar with other cyanobacteria and microalgae as shown in Table 1. Therefore, Synechococ- cus sp. strain PCC 7002 would not only provide glycogen from coastal seawaters without the need for freshwater resources, but also can produce the highest level of α- polyglucan among microalgae and cyanobacteria in wide salinity conditions.
To further improve glycogen productivity in Synechococ- cus sp. strain PCC 7002, the glycogen accumulation rate should be accelerated through metabolic engineering. Ac- cording to Kumaraswamy et al., the intracellular glycogen content in Synechococcus sp. strain PCC 7002 is positively correlated with the expression level of the NAD + -dependent glyceraldehyde 3-phosphate dehydrogenase (GAPDH-1) gene under photoautotrophic conditions [15]. Accordingly, glycogen productivity in Synechococcus sp. strain PCC 7002 may be further improved by a combination of the optimization of growth conditions and the overexpression of GAPDH-1. Glycogen produced by Synechococcus sp.
strain PCC 7002 in this study was converted to ethanol by
yeast fermentation (Additional file 3: Figure S3). The en- hancement of glycogen production by Synechococcus sp.
strain PCC 7002 would contribute to biofuel production.
Conclusions
Synechococcus sp. strain PCC 7002 which combines a wide salinity tolerance and high glycogen production cap- acity could become an important carbon source for the development of biofuels and bio-based chemicals produc- tion. The glycogen productivity of Synechococcus sp. strain PCC 7002 would be further enhanced through genetic en- gineering or metabolic engineering in the next step, which could accelerate the glycogen accumulation rate under ni- trogen depletion.
Methods
Microorganism and growth conditions
The cyanobacteria Synechococcus sp. strain PCC 7002 was obtained from the Pasteur Culture Collection (Paris, France). Cells were pre-cultured in 500 mL Erlenmeyer flasks containing 250 mL of modified medium A (3.0 g L −1 NaNO 3 , 50 mg L −1 KH 2 PO 4 , 18 g L −1 NaCl, 5.0 g L −1 MgSO 4 •7H 2 O, 0.37 g L −1 CaCl 2 •2H 2 O, 0.60 g L −1 KCl, 32 mg L −1 Na 2 EDTA•2H 2 O, 8.0 mg L −1 FeCl 3 •6H 2 O, 34 mg L −1 H 3 BO 3 , 4.3 mg L −1 MnCl 2 •4H 2 O, 0.32 mg L −1 ZnCl 2 , 30 μg L −1 MoO 3 , 3.0 μg L −1 CuSO 4 •5H 2 O, 12 μg L −1 CoCl 2 •6H 2 O, 4.0 μg L −1 cobalamin, and 8.3 mM Tris ami- nomethane, all of which were purchased from Nacalai Teque, Inc., (Kyoto, Japan)) [37] with 100 rpm agitation under continuous illumination at 50 μmol photons m −2 s −1 for 7 days in air at 30 ± 2 °C in an NC350-HC plant chamber (Nippon Medical and Chemical Instruments, Osaka, Japan).
Experiments were carried out in a closed double-deck flask, containing in the first stage 50 mL of 2 M NaHCO 3 /Na 2 CO 3
buffer with the appropriate pH to obtain the desired CO 2
concentration [38,39], and containing in the second stage 70 mL of culture medium. NaHCO 3 /Na 2 CO 3 buffer was ex- changed after 4 days to maintain the desired CO 2 concentra- tion. Pre-cultured cells were inoculated into fresh medium at a dry-based biomass concentration of 0.01 g dry-cell weight L −1 (the optical density at 750 nm (OD750) value was 0.04) and cultivated for 7 days at 33 ± 3 °C with 80 rpm agitation.
The effects of light intensity and CO 2 concentration on
glycogen production were examined under 50, 300, or
600 μmol photons m −2 s −1 at 0.04 (atmospheric level), 1, 2,
or 4% (v/v) CO 2 in air. Light intensity was measured in the
middle of the medium using an LI-250A light meter (LI-
COR, Lincoln, Nebraska, USA) equipped with an LI-190SA
quantum sensor (LI-COR). To study the effect of nitrate
supply in different salinity media under 600 μmol photons
m −2 s −1 in 2% CO 2 in air, pre-cultured cells were transferred
into 3-types of media with 9 to 35 mM nitrate. : 1) medium
A (brackish water medium; salinity at 2.7%), 2) medium A
containing 0.075 g L −1 MgSO 4 •7H 2 O, 0.036 g L −1
Table 1 Production of biomass and α-polyglucan by microalgae and cyanobacteria under phototrophic condition
Species Biomass production
(g-dry biomass L
−1) α-polyglucan
production (g L
−1) α-polyglucan content (% of dry biomass)
Light intensity ( μmol photons m
−2s
−1)
Nitrogen source
Carbon source Medium Reference
Porphyridium sp. UTEX 637 5.6 0.36 6.7 300 10 mM KNO
31.5 –2% CO
2aeration Seawater [30]
Porphyridium aerugineum 5.0 0.63 12.7 300 5.2 mM NaNO
31.5 –2% CO
2aeration Freshwater
Tetraselmis subcordiformis 5.7 2.7 47.8 200 11 mM KNO
33% CO
2aeration Seawater [31]
Chlorella vulgaris CCAP 211/11B
2.4 1.3 55.0 300 6 mM KNO
32% CO
2aeration Freshwater [32]
Arthrospira maxima SOSA 18 0.95 0.91 70.0 50 No addition 200 mM HCO
3−High sodium water
a[21]
Arthrospira platensis NIES-39 1.6 1.0 63.0 700 3 mM NaNO
3200 mM HCO
3−High sodium water
a[19]
Arthrospira platensis NIES-46 1.1 0.58 53.0 50 No addition 200 mM HCO
3−High sodium water
a[33]
Anabaena variabilis ATCC 29413
0.3 0.08 26.7 50 No addition 1.5% CO
2aeration Freshwater [22]
Gloeocapsa alpicola CALU 743 N.D. 0.60 N.D. 220 4 mM KNO
32% CO
2aeration Freshwater [34]
Plectonema boryanum ATCC 18200
0.34 0.08 22.0 100 0.5 mM
Ca(NO
3)
2•4H
2O
Air Freshwater [35]
Synechocystis sp. PCC 6701 N.D. 0.46 N.D. 40 No addition 1% CO
2aeration Freshwater [36]
Synechococcus sp. PCC 7002 N.D. 0.33 N.D. 2500 11 mM NaNO
31% CO
2Brackish water [25]
7.2 3.5 49.8 600 15 mM NaNO
32% CO
2Brackish water This work
7.7 3.0 38.7 600 15 mM NaNO
32% CO
2Seawater
2.8 1.8 62.2 600 9 mM NaNO
32% CO
2Freshwater
N.D.: Not determined.
a
High sodium water indicates SOT medium [19].
Aikawa et al. Biotechnolo gy for Biofuels 2014, 7 :88 Page 6 o f 8 http://ww w.biotechn ologyforbiofu els.com/c ontent/7/1/ 88
CaCl 2 •2H 2 O, 0.04 g L −1 K 2 HPO 4 without NaCl (fresh- water medium; salinity at 0.3%), 3) medium A containing 29.2 g L −1 NaCl, 7 g L −1 MgSO 4 •7H 2 O, 4 g L −1 MgCl 2 •6H 2 O, 1.47 g L −1 CaCl 2 •2H 2 O, 0.6 g L −1 KCl, 0.05 g L −1 KH 2 PO 4 (seawater medium; salinity at 4.0%).
Medium salinity were measured with a refractometer (S/
Mill-E; Atago Co. Ltd, Tokyo, Japan).
Analytical methods
Cell growth was monitored by measuring OD750 in a spec- trophotometer (UVmini-1240, Shimadzu, Kyoto, Japan) [29]. Cell concentration was shown as dry-cell weight dur- ing cultivation and was converted using a pre-established calibration between dry-cell weight and optical density of cell suspension (1.0 OD750 equals approximately 0.32 g dry-cell weight L −1 ). Dry-cell weight was determined by centrifugation of serial diluted cell-suspension (6,300 × g for 2 minutes at 25 °C), washing the pellet once with 0.3 M ammonium carbonate and lyophilization.
Glycogen content and concentration were determined by high performance liquid chromatography (HPLC) (Shimadzu, Kyoto, Japan) using a size exclusion HPLC column (OHpak SB-806 M HQ; Shodex, Tokyo, Japan) and a reflective index detector (RID-10A; Shimadzu, Kyoto, Japan) [40]. Glycogen was extracted from the dried cells by the modified method of Ernst and Böger [22]. Glycogen productivity (g L −1 d −1 ) was estimated by dividing glycogen production by cultivation time. Experimental data were means of triplicate samples and error bars in the figures in- dicate the standard deviation.
Additional files
Additional file 1: Figure S1. Growth curve under different nitrate supplies in brackish water medium. Cells were cultivated under 600 μmol photons m
−2s
−1and 2% CO
2condition with 9 to 27 mM nitrate supplies.
Error bars indicate standard deviations (SD) of three replicated experiments. In some data points, error bars obtained by three replications are smaller than symbols.
Additional file 2: Figure S2. Nitrate consumption under different nitrate supplies in brackish water medium. Nitrate concentrations were determine according to method proposed by American Public Health Association [41]. Cells were cultivated under 600 μmol photons m
−2s
−1and 2% CO
2from 35 to 9 mM nitrate supplies. Error bars indicate standard deviations (SD) of three replicated experiments. In some data points, error bars obtained by three replications are smaller than symbols.
Additional file 3: Figure S3. Ethanol production from glycogen extracts of Synechococcus sp. strain PCC 7002 following yeast fermentation. Ethanol was produced from glycogen extracts of
Synechococcus sp. strain PCC 7002 by Saccharomyces cerevisiae MT8-1 in the presence of 0.3 U L
−1α-amylase and 0.1 U L
−1glucoamylase. Glycogen extracts of Synechococcus sp. strain PCC 7002 were prepared as described in Methods and then adjusted to pH 7.0 using 98% H
2SO
4(w/w). S. cerevisiae MT8-1 cells were grown aerobically in 1-L Erlenmeyer flasks containing 500 mL YPD medium (10 g L
−1yeast extract, 20 g L
−1peptone, and 20 g L
−1glucose) at 30°C with 150 rpm agitation for 48 hours, and then collected by centrifugation at 5,000 × g for 3 minutes at 25°C, washed twice with distilled water, and then inoculated into 50 mL YPG medium (10 g L
−1yeast extract, 20 g L
−1peptone, 0.1 M phosphate buffer adjusted to pH 6.0,
10 mM disodium EDTA, and 10 g L
−1Synechococcus sp. strain PCC 7002 glycogen extract). Ethanol production was performed at 30°C and an agitation speed of 500 rpm in 100-mL closed bottles equipped with a bubbling CO
2outlet and a stir bar under oxygen-limited conditions.
Agitation speed was maintained with a magnetic stirrer (VARIOMAG Telesystem; Thermo Fisher Scientific, Waltham, Massachusetts, United States).
Abbreviations
3-PG: 3-phosphoglycerate; ADP: Adenosine diphosphate; AGPase: ADP-glucose pyrophosphorylase; HPLC: High liquid chromatography; OD: Optical density;
SD: Standard deviations.
Competing interests
The authors declare that they have no competing interests.
Authors ’ contributions
SA designed the study and wrote the manuscript. AN performed the experiments and analyzed the data. SHH revised manuscript. TH designed the study and revised manuscript. JSC and AK coordinated the study. All authors read and approved the final manuscript.
Acknowledgements
The authors thank Dr Hiroshi Teramura and Dr Ancy Joseph for their valuable comments. This work was supported by the Core Research for Evolutional Science and Technology (CREST) of Promoting Globalization on Strategic Basic Research Programs of the Japan Science and Technology Agency. The study was also partially supported by a National Cheng Kung University project, as part of a second-phase 5-year 50 billion dollar grant from the Taiwanese government to JSC, and a Grant-in-Aid for Kurita Water and Environment Foundation to SA (Number 13A021).
Author details
1
Department of Chemical Science and Engineering, Graduate School of Engineering, Kobe University, 1-1 Rokkodai, Nada, Kobe 657-8501, Japan.
2
Core Research for Evolutional Science and Technology, Japan Science and Technology Agency, 3-5 Sanban, Chiyoda, Tokyo 102-0075, Japan.
3