doi:10.6342/NTU201601970
國立臺灣大學工學院化學工程學系 碩士論文
Department of Chemical Engineering College of Engineering National Taiwan University
Master Thesis
建構與研究鋰離子電池正極鋰鎳鈷錳氧 表面高分子固態-電解液介面層
Construction of Polymeric Artificial Solid-Electrolyte- Interphases on LiNi
1/3Co
1/3Mn
1/3O
2Cathode for
Lithium-ion Batteries
邵培賢 Pei-Sian Shao
指導教授:吳乃立 博士 Advisor: Nae-Lih Wu, Ph.D.
中華民國 105 年 7 月
July, 2016
doi:10.6342/NTU201601970
2
doi:10.6342/NTU201601970
I
致謝
在此論文完成之際,首先我想感謝我的指導教授 吳乃立博士,在老師循循 善誘的指導下,讓我在實驗分析與研究邏輯上能漸漸有所啟發,並且感謝老師提 供豐富的實驗資源使我在研究上能有多方探索與嘗試的機會,承蒙老師的帶領,
兩年來在專業學識上的訓練與研究經驗上的累積皆實然充實,這些歷練勢必成為 我人生中寶貴的經歷,同時也非常感謝工研院材化所 吳弘俊博士與 方家振博士 對此篇碩士論文給予的專業建議與指點,讓此篇論文更臻於完善,對此表示深摯 的謝忱。
回首兩年的研究所生涯,感謝能源材料實驗室每位夥伴的提攜與陪伴,讓我 在研究所的生活增添了不少色彩,感謝同窗的兩位夥伴,人豪與羅婧的相互砥礪,
讓我們不論是在修課、實驗或是出席國際會議上遇到的各種曲折挑戰都能一一克 服,最終一起順利完成學業。感謝實驗室的學長姐們,熱心善解人意的郁婷學姐,
總是記得大家的生日並幫大家慶生,認真勤奮的哲凱,讓我見識了研究者的衝勁 與毅力,直率穩重的 Baskar 讓實驗室充滿動力,正派有氣魄的揚恆,帶給我們 不少歡樂時光,以及感謝畢業的學長姊們,文勤、富生、乃璇、宏侑、勁良、孝 安、點子王榮川、勇者朱昀、全能子洋、開心果心惠,有你們的經驗分享與傳承,
成就了 EML 這充滿愛的實驗室,感謝來自國外短暫停留的交換夥伴 Erwin、Vilko、
Lukas、一格、臻卓,期望未來有機會能在世界各地再相聚,感謝實驗室的生力 軍,老實的聖翔老大、精明能幹的建廷、明日股王忠憲、健康女孩李洋、細心暖 男秉逸、熱情開朗的 Mozaffar、內斂樂觀的玉祥、外向陽光的昌恩,以及專題生,
律動彥丞、雙主修承歆、沉著哲民,你們的加入為實驗室注入一波新的能量,期 盼你們未來都能有很好的發展,感謝貼心的曉婷在實驗室公務上的幫忙大大減輕
doi:10.6342/NTU201601970
II
研究生的負擔。
此外,也要特別感謝 徐振哲教授、曜禎哥、柏緯在電漿實驗上的協助,讓 我能順利完成低溫電漿部分的實驗,感謝台大貴重儀器中心的紀素貞小姐與簡佳 盈小姐在電子顯微鏡上提供專業的輔助,感謝工研院的語婷姊、勝瑋哥在實驗上 的協助。
最後,我要感謝我最摯愛的家人,爸爸、媽媽、大哥、二哥及四弟在這些年 來給我的支持鼓勵與悉心關懷,因為有你們,讓我在這兩年的求學路上可以無後 顧之憂的全心投入於研究,才能順利的完成學業。並且身為金門人在桃園的子弟,
我要誠心地向阿公阿嬤與外公外婆在早期亂世期間仍努力奮鬥與教育下一代的 精神致敬,這讓我有更不能懈怠的理由,今日往後我也會繼續努力督促自己,期 望能善用所學,有朝一日能回饋鄉里回饋社會,謝謝您們。
謹將此論文,獻給我摯愛的家人、朋友及所有關心我的人!
培賢 謹識 2016 年 夏
doi:10.6342/NTU201601970
III
摘要
層狀鋰離子三元系過渡金屬氧化物 LiNixCoyMn1-x-yO2 以及層狀富鋰錳基 過渡金屬氧化物材料 xLi2MnO3‧(1-x)Li(Mn, M)O2 (M= Mn, Ni, Co),此系列之材 料具有甚高的比電容量、熱穩定性、低成本與毒性小的優點,使它們成為鋰離子 電池中頗具發展性的正極材料。然而,它們的循環壽命穩定性卻會隨著操作溫度 的增加而導致嚴重的劣化, 較高的操作溫度會使固態電解液介面層上,電解液與 電極材料間的交互作用更激烈,因而導致固態電解液介面層急速的生成於電極表 面,除了造成電池內阻抗的增加外也會造成過渡金屬的溶出。
在本研究中,有別於傳統的方式,吾人發展了一套新穎且簡單的製程,藉由 高分子人造固態電解液介面層來對正極材料進行表面改質,進而提升鋰離子電池 在高溫環境下循環與充放速率的表現。在本實驗中,兩種不同的方式應用在正極 材料的表面改質上,且數種高分子與高分子摻合物被選用作為鋰離子正極材料表 面改質的原料以達到提升鋰離子電池在高溫下操作的性能
在第一個方法中,聚四氟乙烯亦為熟知的鐵氟龍被選用作為表面改質劑,而 此高分子對正極材料的表面改質是應用在富鋰鎳錳氧化物的電極極板,並且藉由 電漿輔助化學氣相層析的製程將鐵氟龍鍍於極板上。在本實驗中,經不同層積時 間處理的極板會組成鈕扣型半電池進行性能測試。其對電性表現的影響亦會在此 研究中討論。
在第二個方法中,正極材料的表面改質會直接在層狀鋰離子三元系過渡金屬 氧化物的粉體上進行修飾,並藉由水系的批覆製程,將離子型高分子如聚苯乙烯 磺酸基以及聚二烯丙基二甲基氯化銨高分子批覆於粉體表面。此外,為了增加經 高分子批覆之金屬氧化物材料的電子導電性,導電性添加劑如 Super P 以及奈米
doi:10.6342/NTU201601970
IV
碳管亦會參與於高分子披覆的製程。在本實驗中,材料在電化學操作前後的表面 型態與結構變化都會加以檢視以及進一步的分析與研究來了解高分子披覆的影 響。
結果顯示,吾人所建構之人造高分子固態電解液介面層能夠大幅的抑制電極 材料與電解液間的劣化反應,進而增進材料的結構穩定性,並在電化學操作過程 中,降低電極材料的極化效應。相較於未經改質的材料,改質後的材料在循環壽 命以及充放速率的電性表現上都有較佳的結果,並且,因為有效的降低電解液的 分解以及提升材料的結構穩定性,改質後的材料,其半電池也能因而保有較低的 內部阻抗。 最後在這些提升電池性能表現的後面,其原理以及機制亦會在此研 究中進一步的討論。
關鍵字 : 鋰離子電池、層狀三元系過渡金屬氧化物、層狀富鋰氧化物、相轉變、
固態電解質介面層、表面改質
doi:10.6342/NTU201601970
V
Abstract
Layered lithium ternary transition metal oxides, LiNixCoyMn1-x-yO2 (abbreviated as NCM) and the layered lithium-rich manganese-transition metal oxide composites cathode, xLi2MnO3‧(1-x)Li(Mn, M)O2 (M= Mn, Ni, Co) (abbreviated as LrMOs), are important cathode materials for lithium ion batteries because of their high specific capacity, thermal stability, lower cost, and less toxicity. However, their cycle life deteriorates rapidly with increasing operating temperature, because of strong interaction at the solid-electrolyte interface causing rapid solid-electrolyte-interphase (SEI) formation and dissolution of the transitional metal ions.
In this research, distinct from traditional methods, a novel simple approach is developed using polymeric artificial SEIs (A-SEIs) to modify the surface of cathode materials to enhance the cyclic and rate performance of Li-ion batteries at the elevated temperatures. Two different modification approaches were applied to modify the cathode surfaces and various polymeric blends were employed to promote the cell performance at the elevated temperature.
In the first approach, the surface modification was performed on the surface of the electrode using plasma enhanced chemical vapor deposition (PECVD) process.
Polytetrafluoroethene known as Teflon was selected for the deposition on electrodes and the lithium-rich Nickel-Manganese Oxide (LrMNO) electrodes were adopted for the modification. PECVD deposition time on electrodes was varied and their impact on the electrochemical performance discussed in detail.
In the second approach, the modification was directly conducted onto the NCM particles. Here, the polymeric coating was achieved using water-based coating process with polystyrene sulfonate-based polymers (PSS) and Poly dially dimethyl ammonium chloride (PDDA). Conductive additives such as Super P and carbon nanotube (CNT)
doi:10.6342/NTU201601970
VI
were incorporated into the coating procedure for the purpose of improving the conductivity loss due to the polymeric coating on the metal oxide materials. Impact of polymeric coating on materials were examined by investigating structure and morphological changes before and after the electrochemical operations.
The result showed that the polymeric artificial SEIs could substantially suppress the side reactions between the electrolyte and electrode, improve the structural stability and decrease the polarization of the material during the electrochemical operations.
Compared to the pristine cell, the modified cells showed better performance both in terms of cycle life and rate capability, maintained lower cell impedance due to the reduced electrolyte decomposition and enhanced structure stability.
Keywords: Li-ion batteries, Li mixed transition metal oxides, Li-rich layered oxide, phase transformation, SEI, Surface modification
doi:10.6342/NTU201601970
VII
Table of Contents
致謝
... I摘要
... IIIAbstract
... VTable of Contents
... VIIList of Tables
... XList of Figures
... XIIChapter 1 Introduction
... 1Chapter 2 Literature Review
... 32-1 Features of Rechargeable Lithium-ion Batteries ... 3
2-1-1 Basic Concepts of Lithium-ion Batteries ... 3
2-1-2 Developments of Lithium Batteries ... 6
2-2 Introduction to Cathode Materials for Li-ion Batteries ... 9
2-2-1 Olivine Structure ... 9
2-2-2 Spinel Structure ... 12
2-2-3 Layered Structure ... 14
2-3 Surface Evolution of Cathode Materials for Li-ion Batteries ... 23
2-3-1 Formation of Solid Electrolyte Interphase ... 23
2-3-2 Phase transformation of Layered Structure Cathode ... 26
2-3-3 Modification of Cathode Materials ... 28
Chapter 3 Experimental
... 353-1 Materials and Chemicals ... 35
doi:10.6342/NTU201601970
VIII
3-2 Preparation of Poly (lithium 4-styrenesulfonate) ... 37
3-3 Polymeric Modification of Cathode Materials ... 38
3-3-1 Plasma Enhanced Chemical Vapor Deposition on Lithium-rich Nickel- Manganese Oxide Cathode Electrode ... 38
3-3-2 Single-polymeric Coating on Lithium Nickel-Cobalt-Manganese Dioxide Powder ... 40
3-3-3 Multi-polymeric Coating on Lithium Nickel-Cobalt-Manganese Dioxide Powder ... 42
3-3-4 Preparation of 1%-Super P-PSSNa @ NCM-PDDA Composites ... 44
3-3-5 Preparation of Carbon Nanotube Wrapped and Polymer Coated Lithium Nickel-Cobalt-Manganese Dioxide Powder ... 46
3-4 Material Characterizations and Analyses ... 48
3-4-1 Microscopy ... 48
3-4-2 X-ray Diffraction ... 49
3-4-3 X-ray Absorption Spectroscopy ... 49
3-4-4 Zeta Potential... 50
3-4-5 Fourier Transform Infrared Spectroscopy ... 50
3-4-6 Inductively Coupled Plasma Analysis ... 51
3-5 Electrochemical Characterization ... 54
3-5-1 Preparation of Electrodes ... 54
3-5-2 Cell-Fabricating Process ... 54
3-5-3 Charge/Discharge Test ... 56
3-5-4 Electrochemical Impedance Spectroscopy ... 56
Chapter 4 Plasma Enhanced Chemical Vapor Deposition on Lithium-
rich Nickel-Manganese Oxide Cathode Electrode
... 57doi:10.6342/NTU201601970
IX
4-1 Introduction ... 57
4-2 Temperature Determination for Elevated Temperature Test ... 59
4-3 Characterization of PECVD Treated Lithium-rich Nickel-Manganese Oxide Cathode Electrode ... 66
4-4 Electrochemical Performance ... 69
Chapter 5 Polymeric Artificial SEI Modification on Li(NiCoMn)
1/3O
2Cathode Material
... 835-1 Introduction ... 83
5-2 Polymer Modification on First Batch of NCM Powder: ... 86
5-2-1 Materials characterizations ... 86
5-2-2 Electrochemical Performance ... 93
5-2-3 Morphology and Surface Structure Evolution of Electrode ... 104
5-3 Polymer Modification on Second Batch of NCM Powder: ... 110
5-3-1 Materials characterizations ... 110
5-3-2 Electrochemical performance ... 116
5-3-3 Surface Morphology Evolution of Electrode ... 130
5-4 High Cut-off Potential Operation of NCM Cells ... 133
5-4-1 Electrochemical Performance ... 133
5-4-2 Structure Evolution of NCM Particles ... 142
Chapter 6 Conclusions
... 144Reference
... 146Appendix A
... 163doi:10.6342/NTU201601970
X
List of Tables
Table 2-1 Modification strategies for cathode materials ... 34
Table 3-1 List of Materials and Chemicals ... 35
Table 3-2 Recipe of electrode slurry ... 55
Table 4-1 Potential of the redox peaks in the 1st, 15th, and 30th cycle for the LrMNO cell operated at different temperature. ... 65
Table 4-2 EDS analysis of the spherical LrMNO based electrode with different PECVD treated time... 68
Table 4-3 Electrochemical performance of LrMNOelectrodes in formation cycles. . 75
Table 4-4. Equivalent-circuit parameters of the LrMNO based cells in fifth charge state at room temperature. ... 77
Table 4-5 Electrochemical performance of LrMNOelectrodes in cycling test. ... 79
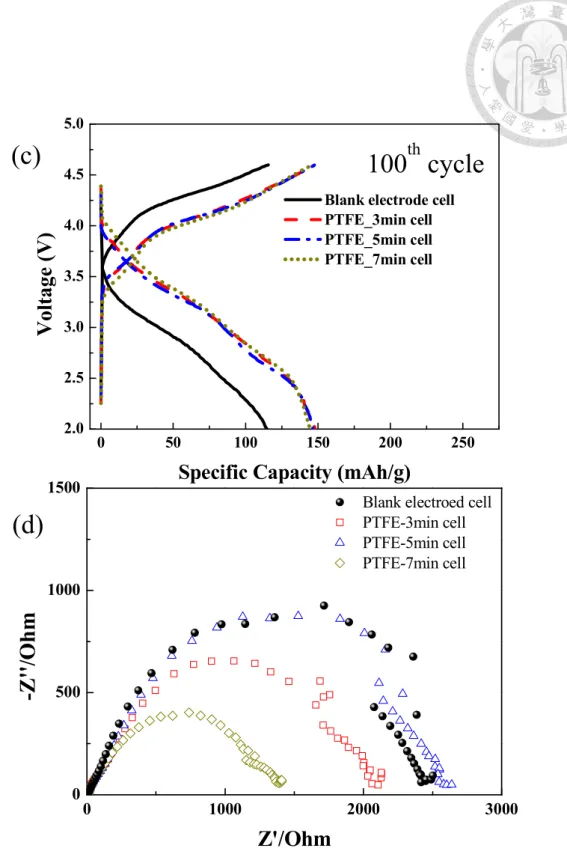
Table 4-6 Potential of the redox peaks in the 1st, 50th, and 100th cycle for the LrMNO cells operated at 55 oC... 80
Table 5-1 Zeta potential of the particles before and after polymer coating. ... 88
Table 5-2 XPS binding energy. of 2p3/2 orbital ... 89
Table 5-3 EDS analysis of the NCM-2%-PDDA-PSSNa particles ... 91
Table 5-4 Electrochemical performance of NCMcells in formation cycles. (the first batch of NCM) ... 98
Table 5-5 Cycling performance of NCM cells at 55 oC. (the first batch of NCM) ... 102
Table 5-6 EDS analysis of the NCM-2%-PSSLi particles ... 112
Table 5-7 Electrochemical performance of NCMcells in formation cycles. (the second batch of NCM) ... 120 Table 5-8 Equivalent-circuit parameters of the NCM cells in fifth charge state at room
doi:10.6342/NTU201601970
XI
temperature. ... 122 Table 5-9 Cycling performance of NCM cells at 55 oC. (the second batch of NCM) ... 125 Table 5-10 Data points of coulombic efficiency out of a standard deviation during the electrochemical cycling. ... 126 Table 5-11 Equivalent-circuit parameters of the NCM cells before/after 100 cycles at 55 oC... 128 Table 5-12 Results of the inductively coupled plasma-mass spectrometer (ICP-MS) analysis for NCM electrodes after cycling at 55 oC. ... 132 Table 5-13 Electrochemical performance of NCMcells in formation cycles (2.5-4.6 V) ... 137 Table 5-14 Cycling performance of NCM cells in 2.5-4.6 V at room temperature 139 Table 5-15 Equivalent-circuit parameters of the NCM cells before/after 100 cycles at room temperature. ... 141 Table 5-16 Intensity ratio between the (003) and (104) peaks ... 143
Table A-1 Cycling performance of NCM cells at 55 oC. (after CCCV operation of rate test) ... 172 Table A-2 Equivalent-circuit parameters of the NCM cells before/after 100 cycles at 55
oC. (in CCCV case) ... 176
doi:10.6342/NTU201601970
XII
List of Figures
Figure 2-1 Comparison of the different battery technologies in terms of volumetric and gravimetric energy density [6]. ... 5 Figure 2-2 Schematic illustration of the charge/discharge process in a Li-ion cell consisting of Li insertion compounds as both anode and cathode. ... 5 Figure 2-3 Schematic drawing showing the shape and components of various Li-ion battery configuration: a: cylindrical; b: coin; c: prismatic; d: thin and flat [6]. ... 8 Figure 2-4 Voltage versus capacity for positive- and negative-electrode materials [16].
... 8 Figure 2-5 Representative crystal structures of cathode materials for lithium-ion batteries: (a) layered; (b) spinel; (c) olivine structured. Black lines demarcate one unit cell in each structure [17]. ... 9 Figure 2-6 Discharge curves of olivine LiFePO4 at high rates [22]. ... 11 Figure 2-7 (a) Profile of discharge curve in spinel lithium manganite and schematic structure of (b) cubic spinel of LiMn2O4 and (c) tetragonal spinel of Li2Mn2O4 [28]. 13 Figure 2-8 The layered structure of LiCoO2 with R m3 symmetry [33]. ... 15 Figure 2-9 Voltage vs. capacity profiles for the cell, Li/ Li(Ni1/3Co1/3Mn1/3)O2 in (a) 2.5
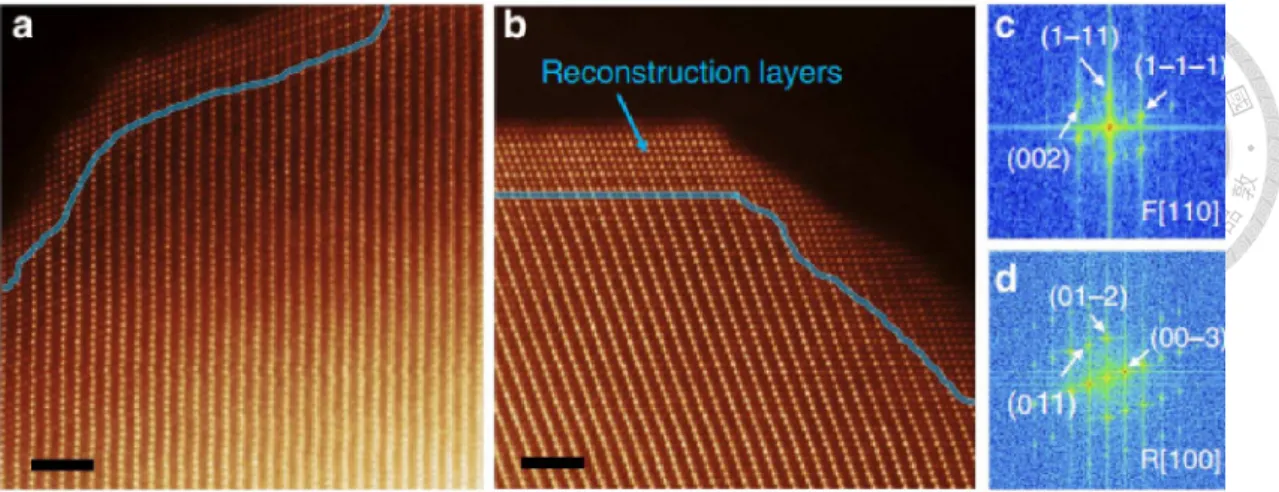
-4.4 V. (b)2.5-4.7 V (c) Cycling performance of the cells [55]. ... 18 Figure 2-10. Trigonal (R m3 ) LiMO2 (a) unit cell and (b) atomic arrangement in the transition-metal layer [73]. ... 20 Figure 2-11. Monoclinic (C2/m) Li2MnO3 (a) unit cell and (b) atomic arrangement in the transition-metal layer. S1 and S2 indicate sites occupied, respectively, by excess Li atoms and Mn atoms [73]. ... 20 Figure 2-12 Compositional phase diagram showing the electrochemical reaction
doi:10.6342/NTU201601970
XIII
pathways for a xLi2MnO3・(1-x) LiMO2 electrode [60]. ... 22 Figure 2-13 Schematic of a negative electrode and electrolyte interface showing the growth of the SEI layer [91]. ... 24 Figure 2-14 Illustration of the microstructure and composition of the SEI at the surface of Ni-rich cathode materials [92]. ... 25 Figure 2-15 O 1s, F 1s, P 2p and C 1s XPS spectra of cathode electrodes after 0 to 50 cycles [94] ... 25 Figure 2-16 ADF-STEM images of NMC particles. (a) After electrolyte exposure. (b) After 1 cycle (2.0–4.7 V); (c,d) FFT results showing the surface reconstruction layer and the NMC layered structure in (b) [97]... 27 Figure 2-17 Schematic drawing showing that the initial material is composed of three phases:R3m, C2/m, and nanocomposite of intergrowth ofR3mand C2/m. The transition from the R3m and C2/m layered structure to the spinel follows different routes, leading to different structural features of the spinel grains [98]. ... 27 Figure 2-18 Schematic diagram of atomic layer deposition of Al2O3 coating on cathode electrodes [106]. ... 30 Figure 2-19 (a) TEM image and (b) elemental mapping of Al and P on the particle surface of 4 wt % AlPO4-modified Li(Li0.2Mn0.54Ni0.13Co0.13)O2 [107]. ... 30 Figure 2-20 (a) Schematic illustration of the preparation process for Li2ZrO3@ LNCMO (b) Cycling performance of bare LNCMO and Li2ZrO3@ LNCMO samples at 25 oC [108]. ... 31 Figure 2-21 (a) Rate performances of bare LNCMO and Li2ZrO3@ LNCMO. (b) Discharge curves of LNCMO at different current density. (c) Discharge curves of Li2ZrO3@LNCMO at different current density. (d) Charge-discharge curves of LNCMO and Li2ZrO3@LNCMO at 10 C [108]. ... 31
doi:10.6342/NTU201601970
XIV
Figure 2-22 (a) Schematic view of a core-shell particle with hetero-structures. (b)
Schematic diagrams for the preparation of the core-shells [111]. ... 32
Figure 2-23 Schematic view of the layered cathode material with a pillar layer at the surface [112]. ... 32
Figure 2-24 FE-SEM photographs of: (a) pristine NCM; (b) PI-wrapped NCM. (c) A TEM photograph of PI-wrapped LiNi1/3Co1/3Mn1/3O2. (d) An EDS image of PI-wrapped NCM, wherein the bright dots signify nitrogen (N) elements of PI wrapping layers [113]. ... 33
Figure 2-25 SEM images of pristine NCM (a, c) and 2 wt% PEDOT-300 oC (b, d) [114]. ... 33
Figure 3-1 Schematic illustration of neutralization ... 37
Figure 3-2 Schematic installation of the low- temperature plasma system. ... 39
Figure 3-3 Schematic illustration of single-polymeric coating process ... 41
Figure 3-4 Flowchart of preparation of NCM-2%-PSSNa particles. ... 41
Figure 3-5 Flowchart of preparation of NCM-(0.8% PDDA + 1.2% PSS) particles. . 43
Figure 3-6 Flowchart of preparation of 1%-Super P-PSSNa@NCM-PDDA composites. ... 45
Figure 3-7 Flowchart of preparation of NCM-1%-CNT-2%-PSSLi particles. ... 47
Figure 3-8 Schematic representative for the Bragg’s law ... 52
Figure 3-9 Basic features of XRD experiment ... 52
Figure 3-10 Distribution of charges in a colloidal suspension ... 53
Figure 3-11 Illustration of parts for the coin cells CR2032. ... 55
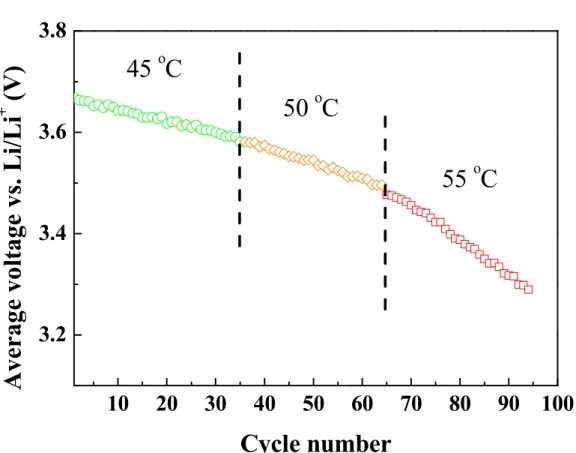
Figure 4-1 Cycling performance of the LrMNO cells at (a) 40 oC; (b) varying temperatures from 45 to 55 oC; (c) 55 oC in 0.3 C (67.5 mA/g). ... 61 Figure 4-2 Average potential as the function of cycle number of the LrMNO cells at
doi:10.6342/NTU201601970
XV
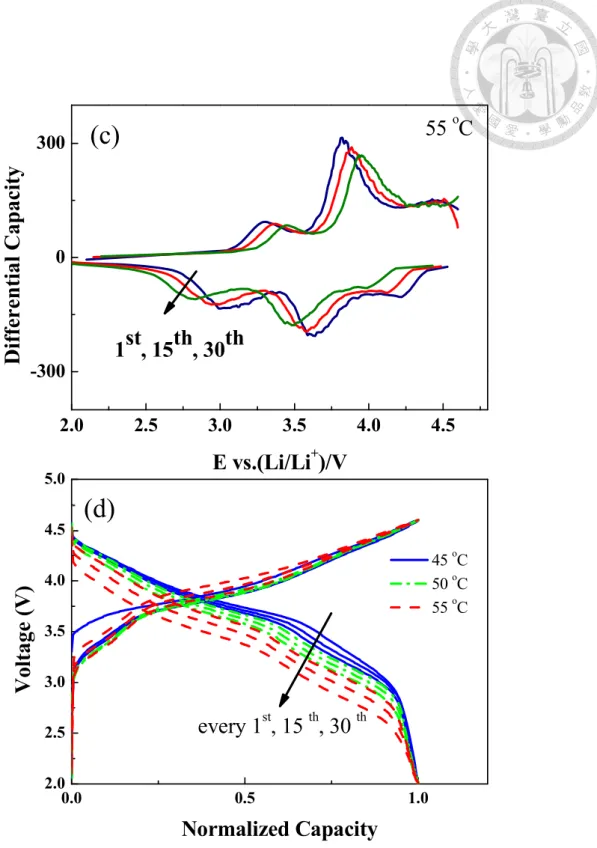
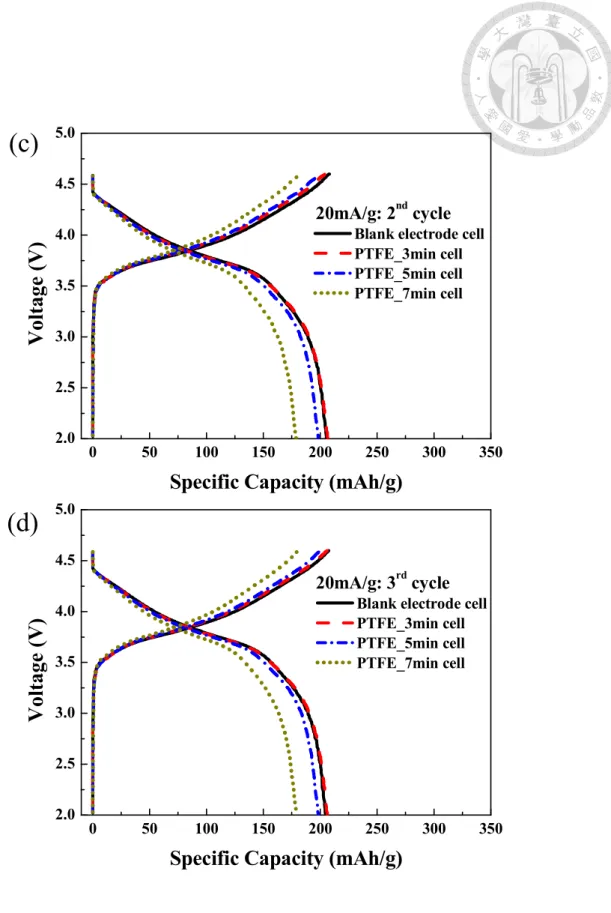
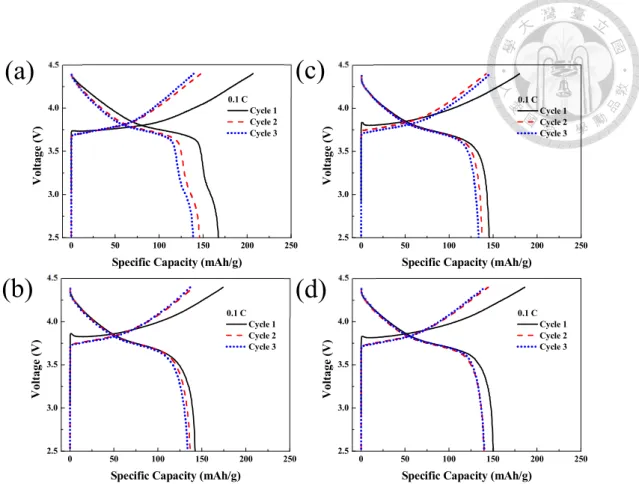
varying temperatures from 45 to 55 oC. ... 62 Figure 4-3 Differential capacity versus voltage (dQ/dV) plots for 1st, 15th, 30th cycles in 0.3 C (67.5 mA/g) at: (a) 45 oC; (b) 50 oC; (c) 55 oC. (d) Normalized Charge/discharge curves for every 1st, 15th, and 30th cycles at 45, 50 and 55 oC. ... 64 Figure 4-4 SEM micrographs of spherical LrMNO based (a)/(e) Blank; (b)/(f) PTFE- 3min; (c)/(g) PTFE-5min; (d)/(h) PTFE-7min electrode in the magnification of 500/2000. ... 67 Figure 4-5 Comparison of the charge/discharge voltage profiles of the (a) first cycle;
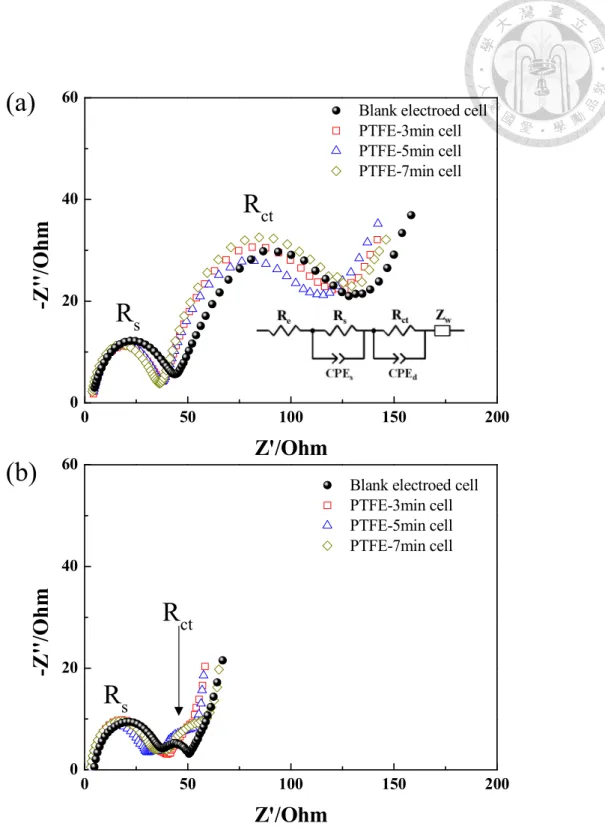
(b) second cycle; (c) third cycle; (d) forth cycle in formation test at room temperature ... 74 Figure 4-6 Nyquist plots performed at 4.0 V in the (a) fifth charge cycle at room temperature; (b) sixth cycle at 55 oC of the electrodes. ... 76 Figure 4-7 Cycling performance in the (a) Discharge capacity ; (b) Normalized discharge capacity as the function of cycle number of LrNMO based cells charge/discharge in 0.3C (67.5mAh/g) at 55oC ... 78 Figure 4-8 dQ/dV plots in 1st, 50th, and 100th cycle for the (a) Blank electrode, (b) PTFE-3min (c) PTFE-5min, and (d) PTFE-7min at 55 oC under the current density of 67.5 mA/g ... 80 Figure 4-9 Charge/discharge curves of LrMNO electrodes in (a) 1st cycle, (b) 50th cycle, and (c) 100th cycle.; (d) Nyquist plots performed at 4.0 V after 100 cycling at 55 oC of the electrodes. ... 82 Figure 5-1 Chemical formula of (a) polystyrene sulfonate, (b) poly(sodium-4-styrene sulfonate), (c) poly(lithium-4-styrene sulfonate) and (d) polu(diallydimethyammonium chloride) ... 84 Figure 5-2 Schematic illustration of the fabrication of Super P-PSSNa @ NCM-PDDA
doi:10.6342/NTU201601970
XVI
powders through electrostatic attraction of ionic polymers ... 85 Figure 5-3 Schematic illustration of CNT-wrapped and polymer-coated NCM composite powder. ... 85 Figure 5-4 XPS profiles of bare NCM (a)~(c) and polymer-coated NCM (d)~(f) after 3 second etching. ... 89 Figure 5-5 SEM micrographs of (a) NCM-Pristine, (b) NCM-2%-PSSNa, (c) NCM- 2%-PDDA-PSSNa, and (d) Super P-PSS @NCM-PDDA particles ... 90 Figure 5-6 EDS profile of the NCM-2%-PDDA-PSSNa particles ... 91 Figure 5-7 TEM micrographs of (a) NCM-Pristine, (b) NCM-2%-PSSNa, (c) NCM- 2%-PDDA-PSSNa, and (d) Super P-PSS @NCM-PDDA particles ... 92 Figure 5-8 Charge/discharge voltage profiles of the (a) NCM-Pristine, (b) NCM-2%- PSSNa, (c) NCM-2%-PDDA-PSSNa, and (d) Super P-PSSNa@NCM-PDDA cells in 0.1 C at room temperature. ... 98 Figure 5-9 dQ/dV plots of the (a) NCM-Pristine, (b) NCM-2%-PSSNa, (c) NCM-2%- PDDA-PSSNa, and (d) Super P-PSSNa@NCM-PDDA cells. ... 99 Figure 5-10 Nyquist plot of NCM cells performed at 4.0 V in the fifth charge cycle at room temperature. (the first batch of NCM) ... 99 Figure 5-11 Rate performance of the different NCM samples in (a) discharge capacity;
(b) capacity retentionto the cycle number at various rates from 0.1 C to 10 C (1 C = 160 mA/g) at 55 oC (the first batch of NCM). ... 100 Figure 5-12 Cycling performance showing (a) Specific discharge capacity; (b) capacity retention versus the cycle number of different NCM samples charge/discharge in 0.3C (1C=160 mAh/g) at 55 oC. (the first batch of NCM) ... 101 Figure 5-13 Normalized voltage profiles of (a) NCM-Pristine, (b) NCM-2%-PSSNa, (c) NCM-2%-PDDA-PSSNa, and (d) Super P-PSSNa@NCM-PDDA cells in every 50
doi:10.6342/NTU201601970
XVII
cycles of cycling test. ... 102 Figure 5-14 Nyquist plot of NCM cells performed at 4.0 V after 100 cycles at 55 oC ... 103 Figure 5-15 SEM micrographs of the (a) (e) NCM-Pristine, (b) (f) NCM-2%-PSSNa, (c) (g) NCM-2%-PDDA-PSSNa, and (d) (h) Super P-PSSNa@ NCM-PDDA fresh and after 100 cycled electrode. ... 107 Figure 5-16 EDS results of the (a) Fluorine and (b) Phosphorus content versus the cycle number in the different NCM electrodes. ... 108 Figure 5-17 STEM micrographs of the (a) NCM-Pristine and (b) NCM-2%-PSSNa electrodes after cycling at 55 oC. (c)~(f) are the FFT images in region I and II of (a) and (b) respectively. ... 109 Figure 5-18 SEM micrographs of (a) NCM-2%-PSSLi particle and its EDS mapping of (b) sulfur, (c) nickel, and (d) EDS results ... 112 Figure 5-19 FTIR spectrum of the NCM Pristine and NCM-2%-PSSLi particles ... 113 Figure 5-20 SEM micrographs of NCM-1%-CNT-2%-PSSLi particles in the magnification of (a) 25000 and (b) 50000. ... 113 Figure 5-21 TEM micrographs of (a) NCM-2%-PSSLi, (b) NCM-1%-CNT-2%-PSSLi particles. ... 114 Figure 5-22 XRD patterns of (a) NCM-Pristine, (b) NCM-2%-PSSNa, (c) NCM-2%- PDDA-PSSNa, and (d) Super P-PSS @NCM-PDDA particles in first batch NCM . 115 Figure 5-23 XRD patterns of (a) NCM-Pristine, (b) NCM-2%-PSSLi, and (c) NCM- 1%-CNT-2%-PSSLi particles in the second batch NCN ... 115 Figure 5-24 Charge/discharge voltage profiles of the (a) NCM-Pristine, (b) NCM-2%- PSSNa, (c) NCM-2%-PSSLi, and (d) NCM-1%-CNT-2%-PSSLi cells in 0.1 C at room temperature. ... 120
doi:10.6342/NTU201601970
XVIII
Figure 5-25 Charge/discharge voltage profiles of the NCM-Pristine and NCM-2%- PSSLi cell with CCCV operation in (a) 0.5 C; (b) 1 C at room temperature. ... 121 Figure 5-26 Nyquist plot of NCM cells performed at 4.0 V in the fifth charge cycle at room temperature. (the second batch of NCM) ... 122 Figure 5-27 Rate performance of the different NCM samples in (a) discharge capacity;
(b) capacity retention to the cycle number at various rates from 0.1 C to 10 C (1 C = 160 mA/g) at 55 oC (the second batch of NCM). ... 123 Figure 5-28 Cycling performance showing (a) Specific discharge capacity; (b) capacity retention versus the cycle number of different NCM samples charge/discharge in 0.3C (1C=160 mAh/g) at 55 oC. (the second batch of NCM) ... 124 Figure 5-29 Coulombic efficiency versus the cycle number of (a) NCM-Pristine; (b) NCM-2%-PSSLi; (c) NCM-1%-CNT-2%-PSSLi; (c) NCM-2%-PSSNa cell at 55 oC ... 126 Figure 5-30 Nyquist plot of NCM cells performed at 4.0 V (a) before and (a) after 100 cycles at 55 oC. ... 127 Figure 5-31 Rate performance of the different NCM samples in (a) discharge capacity;
(b) capacity retention to the cycle number at various rates from 0.1 C to 10 C (1 C = 160 mA/g) at 55 oC after the cycling test. ... 129 Figure 5-32 SEM micrographs of the (a)/(b) NCM-Pristine, (c)/(d) NCM-2%-PSSLi, (e)/(f) NCM-1%-CNT-2%-PSSLi fresh/ cycled electrodes ... 131 Figure 5-33 SEM micrographs of the (a) NCM-Pristine, (b) NCM-2%-PSSLi, (c) NCM-1%-CNT-2%-PSSLi electrodes after cycling at 55 oC. (d) EDS results of the F and P content in fresh and cycled electrodes. ... 132 Figure 5-34 Charge/discharge voltage profiles of the (a) NCM-Pristine, (b) NCM-2%- PSSLi, (c) NCM-1%-CNT-2%-PSSLi cells in 2.5-4.6 V at room temperature. ... 137
doi:10.6342/NTU201601970
XIX
Figure 5-35 Cycling performance showing (a) Specific discharge capacity; (b) capacity retention versus the cycle number of different NCM samples charge/discharge in 0.3 C (1C=160 mAh/g) in 2.5-4.6 V at room temperature ... 138 Figure 5-36 Normalized voltage profiles and dQ/dV polts of (a)(b) NCM-Pristine, (c)(d) NCM-2%-PSSLi, (e)(f) NCM-1%-CNT-2%-PSSLi, cells in every 50 cycles of cycling test. ... 139 Figure 5-37 Nyquist plot of NCM cells performed at 4.0 V (a) before and (a) after 100 cycles at room temperature. ... 140 Figure 5-38 Synchrotron XRD patterns of (a) NCM-Pristine, (b) NCM-2%-PSSLi, (c) NCM-1%-CNT-2%-PSSLi particles after 100 cycles at room temperature. ... 143
Figure A-1 Cell performance in (a) formation cycle, (b) rate test at room temperature, (c) rate and (d) cycling test at 55 oC between the NCM cells w/o water coated process (no polymer additive). ... 163 Figure A-2 Voltage profiles of (a) NCM-Pristine, (b) NCM-2%-PSSNa, (c) NCM-2%- PDDA-PSSNa, and (d) Super P-PSSNa@NCM-PDDA cells in rate test at 55 oC. ... 164 Figure A-3 Voltage profiles of (a) NCM-Pristine, (b) NCM-2%-PSSNa, (c) NCM-2%- PSSLi, and (d) NCM-1%-CNT-2%-PSSLi cells in rate test at 55 oC. ... 165 Figure A-4 Voltage profiles of (a) NCM-Pristine, (b) NCM-2%-PSSNa, (c) NCM-2%- PSSLi, and (d) NCM-1%-CNT-2%-PSSLi cells in rate test at 55 oC after cycling. .. 166 Figure A-5 Rate performance of the different NCM samples in (a) discharge capacity;
(b) capacity retention to the cycle number at various rates from 0.1 C to 10 C (1 C = 160 mA/g) with CCCV operation at room temperature. ... 167 Figure A-6 Voltage profiles of (a) NCM-Pristine, (b) NCM-2%-PSSNa, (c) NCM-2%- PSSLi, and (d) NCM-1%-CNT-2%-PSSLi cells in rate test with CCCV operation at
doi:10.6342/NTU201601970
XX
room temperature. ... 168 Figure A-7 Rate performance of the different NCM samples in (a) discharge capacity;
(b) capacity retention to the cycle number at various rates from 0.1 C to 10 C (1 C = 160 mA/g) with CCCV operation at 55 oC. ... 169 Figure A-8 Voltage profiles of (a) NCM-Pristine, (b) NCM-2%-PSSNa, (c) NCM-2%- PSSLi, and (d) NCM-1%-CNT-2%-PSSLi cells in rate test with CCCV operation at 55
oC ... 170 Figure A-9 Cycling performance showing (a) Specific discharge capacity; (b) capacity retention versus the cycle number of different NCM samples charge/discharge in 0.3C (1C=160 mAh/g) at 55 oC. (after CCCV operation of rate test)... 171 Figure A-10 Rate performance of the different NCM samples in (a) discharge capacity;
(b) capacity retention to the cycle number at various rates from 0.1 C to 10 C (1 C = 160 mA/g) with CCCV operation at 55 oC after cycling... 173 Figure A-11 Voltage profiles of (a) NCM-Pristine, (b) NCM-2%-PSSNa, (c) NCM-2%- PSSLi, and (d) NCM-1%-CNT-2%-PSSLi cells in rate test with CCCV operation at 55
oC after cycling. ... 174 Figure A-12 Nyquist plot of NCM cells performed at 4.0 V (a) before and (a) after 100 cycles at 55 oC. (in CCCV case) ... 175
doi:10.6342/NTU201601970
1
Chapter 1 Introduction
Discovery of Lithium-ion batteries (LIBs) in the late 1980s and its first commercialization in 1990 by the Sony Corporation with LiCoO2 cathode electrode, carbon-based anode electrode and non-aqueous electrolyte system brought revolutionary changes in the field of energy and portable electronics[1]. After that, LIBs started to dominate as the power source for portable electronic devices such as mobile phones, digital cameras, and laptops, etc. In addition, worsening global climate problem and continuous emission of greenhouse gas carbon dioxide due to the increasing fossil fuel based energy production lead the governments to develop policies to reduce carbon dioxide emissions by planning alternate renewable energies and energy storage devices.
Hence, LIBs holding very significant role for the important power source and leaping towards to fulfill the need of high energy and power density applications for the hybrid electric vehicles (HEVs) and electric vehicles (EVs), as well as the residential energy- storage systems.
However, these potential applications require stable energy source with extended cycle life. To achieve this goal, research and development focused on multiple fronts such as development of novel stable cathode / anode materials, new electrolytes, and electrolyte additives that could suppress side reactions between the electrolytes and the electrode materials. Among these, recent research concerned more about the interface between the electrodes and the electrolytes which has great impact on the electrochemical performance of LIB[2]. Intensive research is going on studying the cathode interface to improve the cathode materials suitable for high energy and high power applications.
Various cathode materials, such as layered LiCoO2, LiMn1/3Ni1/3Co1/3O2, lithium-
doi:10.6342/NTU201601970
2
rich Li1+x (M,Mn)1-xOy, spinel LiMn2O4, and olivine LiFePO4, having different or similar lattice structures have been developed[3, 4]. Among the cathode materials, the most widely used cathode material is LiCoO2. However, higher cost of the cobalt hindering utilization of this material for the emerging applications. On the other hand, the Mn and Ni substituted materialshave been considered as the most promising cathode materials for EVs due to the relatively higher capacity, abundant in nature, low cost, environmental friendliness, and thermal stability, which are the key factors for a large scale EV battery[5].But, deterioration of the cycle life at the elevated temperature of these electrodes limiting its usage which should be addressed for applying these materials for the EVs application.
In this work, the electrochemical performance of lithium-rich Li1.2Ni0.4Mn0.6O2.2
and lithium mixed transition metal oxide LiMn1/3Ni1/3Co1/3O2 at elevated temperature improved by forming artificial solid-electrolyte-interphases (A-SEI). The various functional polymers, which act as A-SEI, were modified onto these cathode materials.
The electrochemical performance of these polymer modified electrodes was compared and discussed. The rate capability and cycling stability of these electrodes at the elevated temperature were performed and morphological change before and after electrochemical performance also investigated. Being simple, possibility of scaling up to the industrial level and environmental friendliness of this developed method make highly suitable for practical applications.
doi:10.6342/NTU201601970
3
Chapter 2 Literature Review
2-1 Features of Rechargeable Lithium-ion Batteries 2-1-1 Basic Concepts of Lithium-ion Batteries
The rechargeable lithium-ion battery has been considered as the most promising battery because of its high power/energy density, long cycling life, environmentally friendly and no memory effect. The energy densities per unit volume (Wh/l) and per unit weight (Wh/kg) of various rechargeable batteries are shown in Fig. 2-1 [6].
Lithium-ion batteries are appealing for these high power applications since they provide higher energy density than the other rechargeable battery systems, such as lead-acid, nickel-cadmium (Ni-Cd), and nickel-metal hydride (Ni-MH) batteries. The nominal voltage of a lithium-ion battery is around 3.7 V, which is much larger than that of conventional nickel batteries (1.2 V) and lead-acid batteries (2 V). The high voltage of the lithium-ion battery arises as it uses the chemistry of intercalation reactions of Li- ion with the cathode and anode.
Rechargeable lithium-ion batteries are generally composed of Li-containing transition metal oxide as the positive electrode and a carbon material as the negative electrode material. When the cell is constructed, it is in the discharge state. When charged, Li-ions move from the positive electrode through the electrolyte and electrons also move from the positive electrode to the negative electrode through the external circuit with the charger. As the potential of the positive electrode rises and that of the negative electrode descends during charging, the voltage of the cell becomes higher.
The cell is discharged by the connection of a load between the positive and negative electrodes. In this case, the Li-ions and electrons move in opposite directions to charging. Consequently, electrical energy is obtained. The principle charge/discharge
doi:10.6342/NTU201601970
4
for Li-ion batteries, such as C/LiCoO2 system, is illustrated in Fig. 2-2. The reaction mechanisms are shown as follows:
Cathode reaction:
LiCoO2 e arg Disch
e arg Ch
Li1-xCoO2 + x Li+ + x e- (2-1)
Anode reaction:
C6 + x Li+ + x e-
e arg Disch
e arg Ch
LixC6 (2-2)
Net reaction:
LiCoO2 + C6 e arg Disch
e arg Ch
Li1-xCoO2 + LixC6 (2-3)
During first charging, the lithium ions are inserted into the van der Waals gap between graphene layers of carbon and the charge balance is maintained by a oxidation of the Co3+ ions to Co4+. During discharge, exactly the reverse process involving the extraction of lithium from the graphene layers and an reduction of Co4+ ions to Co3+
occurs. In other words, when the battery is charged, the Li ions in the LiCoO2 migrate via a separator to between the layers of carbon material that form the anode, and charging current is applied. When the battery is discharged, the Li ions in the carbon material migrate via a separator to the LiCoO2, and a discharging current occurs.
doi:10.6342/NTU201601970
5
Figure 2-1 Comparison of the different battery technologies in terms of volumetric and gravimetric energy density [6].
Figure 2-2 Schematic illustration of the charge/discharge process in a Li-ion cell consisting of Li insertion compounds as both anode and cathode.
doi:10.6342/NTU201601970
6
2-1-2 Developments of Lithium Batteries
Over the past decades, there has been enormous research in the development of Li-based batteries, especially for rechargeable Li-ion batteries. The motivation for using a battery technology based on metallic Li as anode relied on the fact that Li has low atomic mass (6.94 g/mol), high specific capacity (3862 mAh/g) and a high electrochemical reduction potential (-3.045V versus standard hydrogen electrode) [7].
The advantage in using Li metal was first demonstrated in the 1970s with the assembly of primary (for example, non-rechargeable) Li cells by Ikeda et.al [6]. In 1972, a first secondary rechargeable Li battery was proposed by Exxon [8]. The battery was composed of TiS2 as the positive electrode, Li metal as the negative electrode and Li perchlorate in dioxolane as the electrolyte. TiS2 was the best intercalation compound available at the time, having a very favorable layered-type structure. Though all these cathode materials have proven their competence for Li batteries, it soon encountered the shortcomings of a metallic Li/non-aqueous electrolyte combination. Uneven (dendritic) Li metal deposit was formed onto anode during repeated recharge cycles, which caused the electrode to swell and led to explosive hazard.
Because of the safety issues of using metallic Li, several alternative approaches were pursued in which either the electrolyte or the anode was modified. The first approach [9] involved substituting Li metal for a second insertion material. The concept was first demonstrated in the laboratory by Murphy et al. [10] and then by Lazzari et al. [11], in which LiWO2 was demonstrated to be able to work as a new anode without the above safety problem since the presence of Li was then in the ionic state, but not metallic. Since then, the name of Li battery was changed to Li-ion battery. In June 1991, Sony Corporation [12] marketed the all-time most successfully commercialized LIB (to date) of LiCoO2/C system. And just as the circumstances mentioned at the beginning,
doi:10.6342/NTU201601970
7
this small but long-time usable battery was quickly applied in those portable electronic devices immediately made the sale number of mobile phones skyrocket.
The second approach [13] involved with replacing the liquid electrolyte by a dry polymer electrolyte, which was called Li solid polymer electrolyte (Li-SPE) batteries.
But this technology required temperature up to 80 oC; therefore it was limited to large systems and not to portable devices. After that, Kelly et al [14] tried to develop a Li hybrid polymer electrolyte (Li-HPE) battery. However, Li-metal dendrites were still a safety issue to HPE systems. In 1996, Bellcore researchers introduced polymeric electrolyte in a liquid Li-ion system [15], which is called plastic Li-ion (PLiON) batteries. PLiON system can be manufactured in various size and shape (Fig. 2-3) [6].
Such a thin film battery technology that offers shape versatility, flexibility and lightness, has been developed commercially since 1999.
Until now, rechargeable Li-ion battery is the fastest growing battery technology in the world. With so much effort of researchers, various electrode materials have been investigated and developed. For the cathode materials, there are LiNiO2, LiMn2O4, Li(NixCoyMn1-x-y)O2, LiFePO4, and LiMnPO4, etc. And for the anode materials, there are still TiO2, Li4Ti5O12, Si-C composites, Sn/C/Co and the other metals or alloys.
Each material shows distinct advantages and drawbacks. The potential window versus capacity for positive and negative electrode materials is show in Fig. 2-4 [16]. In the following sections, some specific materials were selected to be particularly discussed.
doi:10.6342/NTU201601970
8
Figure 2-3 Schematic drawing showing the shape and components of various Li-ion battery configuration: a: cylindrical; b: coin; c: prismatic; d: thin and flat [6].
Figure 2-4 Voltage versus capacity for positive- and negative-electrode materials [16].
doi:10.6342/NTU201601970
9
2-2 Introduction to Cathode Materials for Li-ion Batteries
For advanced the energy density of LIB, various alternatives to LiCoO2 cathode have been investigated and developed, such as LiNiO2, Li(M, Mn)2O4, LiCoxNiyMn1-x- yO2, Li1+x(M,Mn)1-xOy, LiFePO4, and LiMnPO4…etc. Each material shows distinct advantages and drawbacks. From a crystal structural point of view, we can categorize the cathode materials into three major groups: layered structure, spinel structure and olivine structure as shown in Fig.. 2-5.
Figure 2-5 Representative crystal structures of cathode materials for lithium-ion batteries: (a) layered; (b) spinel; (c) olivine structured. Black lines demarcate one unit cell in each structure [17].
2-2-1 Olivine Structure
LiMPO4 (M=Fe, Mn, Co) with olivine structure are the advanced Li insertion cathode materials. In 1997, Goodenough’s group firstly proposed lithium iron phosphate (LiFePO4) as a cathode material for secondary Li-ion batteries [18]. This compound has the orthorhombic unit cell with space group of Pmna, containing a nearly close-packed-hexagonal oxide-ion array. The unit cell parameters are a=1.0332(4) nm, b=0.6010(5) nm, and c=4.692(2) nm [19], LiFePO4 is basically composed of edge-
doi:10.6342/NTU201601970
10
shared LiO6 octahedra, corner-shared FeO6 octahedra, and PO4 tetrahedra, as shown in Fig. 2-5 (c). The P-O covalent bonds in PO43- not only strongly bind the oxygen from easily release with large thermal energy causing thermal runaway, but also lower the energy of Fe3+/Fe2+ redox couple and hence raise open-circuit voltage vs. Li, as in other cases of polyanions [20, 21]. For the former effect of P-O covalent bond, in fact, using polyanions was the initial concept to overcome the structural instability of layered iron oxide, LiFeO2, in which the Fe3+ ions tended to migrate from octahedral to tetrahedral sites. The open circuit voltage of LiFePO4 is ~3.4V. When charging and discharging at low rate, i.e., at nearly equilibrium condition, LiFePO4 exhibits a flat plateau at ~3.4V as well, implying that the reversible electrochemical process is via a two-phase reaction.
The typical charge and discharge curves show flat-plateau feature, and this feature of flat plateau would remain even at considerable high C-rate as shown in Fig. 2-6, though the voltage is lower at higher C-rate due to high polarization [22]. Padhi et al. further demonstrated that the other phase could be FePO4. They used chemical de-lithiation method to obtain FePO4 and showed that it had similar discharge curve as LiFePO4
discharged [18]. This assumption was then confirmed by Anderssen et al. by using in- situ X-ray diffraction and Mössbauer spectroscopy technique [23]. This reversible electrochemical reaction can thus be described as the following equations:
During charge:
4 4
4
Li xe ( 1 x ) LiFePO xFePO
LiFePO
(2-4)During discharge:
4 4
4
xLi xe xLiFePO ( 1 x ) FePO
FePO
(2-5)doi:10.6342/NTU201601970
11
The densities of two end compounds have a difference of 2.59 % since the volume of FePO4 decreases by 6.81% after Li ions diffuse out from LiFePO4. This small volume change along cycling is one of the reasons that LiFePO4 being considered as a cathode material with high stability. According to the data of Delacourt’s group [24], the electronic conductivity of LiFePO4 is as low as 2.39×10⁻⁹ S/cm at 25 oC, while the ones of the currently used LiCoO2 and LiMn2O4 are ~10-3 and ~10-5S/cm, respectively.
Following the success in the development of LiFePO4 cathode, there have been encouraging efforts in investigating the LiMnPO4 and LiCoPO4 as cathode materials.
The former has the moderate redox potentials of 4.1V, while the latter has the highest one of 4.8V among olivine cathodes [25]. However, LiCoPO4 cathode suffers from stability problems caused from itself and non-aqueous electrolytes that are reflected in a relatively low specific capacity <120 mAh/g (versus 165 mAh/g theoretical) and capacity fading during prolonged cycling.
Figure 2-6 Discharge curves of olivine LiFePO4 at high rates [22].
doi:10.6342/NTU201601970
12
2-2-2 Spinel Structure
Another promising cathode material is LiMn2O4 that forms a spinel structure ( Fd3m ), where manganese occupies the octahedral sites and lithium predominantly occupies the tetrahedral sites. In spinel structure, the lithium ion migration pathways are a 3-dimensional network of channels rather than planes, as in the α-NaFeO2 structure. It can deliver a high energy density comparable to LiCoO2
because of its high voltage and high specific capacity which is only 10% less than that of LiCoO2. In addition to energy density, spinel LiMn2O4 also has friendly properties, such as low cost, low toxicity and safety in overcharge [26, 27]. The characteristic potential signatures for LiMn2O4 exhibit two plateaus at 4.1 V and 4.05 V (Fig. 2-7 (a) [28]). Further discharged to about 2.8 V, another plateau corresponding to a cubic- tetragonal phase transition (Fig. 2-7 (b),(c)), LiMn2O4→ Li2Mn2O4 (valence state:
+3.5+3, in Fig. 2-7.)
For the spinel lithium manganite, several reasons have been proposed for the capacity loss of Li//LixMn2O4 cells as follows [27, 29, 30] :
(i) The disproportional reaction according to 2Mn(III)Mn(IV) + Mn(II) , resulting in the dissolution of manganese metal. The dissolution of Mn could also result in higher fading rate of cycle life of LiMn2O4 cathode. Its own in that a coating of MnO2 coming from the second reaction shown above on LiMn2O4 particles was observed as well.
Surface coating with transition metal oxides has been shown as an effective way to solve the dissolution problem [27].
(ii) The instability of the delithiated spinel structure by oxygen loss in organic electrolyte solvents in the end of the charge.
(iii) Jahn-Teller distortion at the end of discharge. A phase transition from cubic to tetragonal can cause a large and anisotropic volume change that results in the severe
doi:10.6342/NTU201601970
13
damage to spinel LiMn2O4 cathode. It is due to the incompatibility between oxygen arrays in cubic and tetragonal structure, which can decrease the electrical contact between particle surfaces.
In addition, Substitution of cations into the Mn sites in LiMn2O4 structure has been proven to be another effective way to improve the drawbacks as mentioned. Among these doped spinel cathode materials, Ni-substituted LiNi0.5Mn1.5O4 spinel has been regarded as special and drawn more attention because of its high operational voltage (~4.7 V vs. Li+/Li0), good cycling and rate capabilities at room temperature. It shows great potential as one of the next generation cathode materials with higher energy density. However, it is need to overcome that the fact that spinel LiNi0.5Mn1.5O4 exhibits a significant capacity loss at an elevated temperature, which is a critical environment for HEV/EV applications [31].
Figure 2-7 (a) Profile of discharge curve in spinel lithium manganite and schematic structure of (b) cubic spinel of LiMn2O4 and (c) tetragonal spinel of Li2Mn2O4 [28].
doi:10.6342/NTU201601970
14
2-2-3 Layered Structure
Layered Lithium cobalt oxide (LiCoO2)
LiCoO2 was first proposed as a cathode material by Goodenough et al. in 1980 [32]. Even now, The LiCoO2 cathode material is most commonly used in lithium ion batteries. LiCoO2 has α-NaFeO2 crystal structure (space group: R m3 ) with oxygen in a cubic closed-packed arrangement (Fig. 2-8 [33]). With the CoO6 octahedrons formed as planes, LiCoO2 shows a layered structure which enables Li ions diffuse in the lattice.
Theoretically, LiCoO2 has a capacity of 274 mAh/g when fully de-lithiated, but the total de-lithiation would go through an unfavorable phase change, hexagonal- monoclinic transition, which may cause 50% volume expansion along c-axis [34, 35].
This phase change occurs around 4.3V. Hence, in practical, LiCoO2-based Li-ion battery would be prevented from charging to higher than 4.3V, corresponding to Li0.5CoO2, and shows only half of theoretical capacity, 140 mAh/g. In this range, LiCoO2 exhibits great stability and low self-discharge capacity.
In addition, LiCoO2 is its high cost because Co element is less available, and thereby limits its applications on electric vehicles. The other one is the toxicity over environments. And the final one is the Co dissolution which is induced by HF when using LiPF6 as electrolyte or poly-vinylidene-fluoride (PVdF) as binder, particularly at high temperatures or with moisture. Some researchers have tried to coat metal oxides on LiCoO2 particles to reduce the contact between HF and LiCoO2. And it was revealed that metal oxide coating can not only effectively enhance the cycle life, but also improve the reversible capacity to 170 mAh/g by the oxide coating suppressing the volumetric expansion [36-38].
doi:10.6342/NTU201601970
15
Figure 2-8 The layered structure of LiCoO2 with R m3 symmetry [33].
Layered lithium nickel oxide (LiNiO2)
LiNiO2 has the same structure with LiCoO2 (Fig. 2-8 [33]), only the Ni atoms occupy the Co sites. It was first reported as a cathode material for lithium ion batteries early in 1979. Its theoretical capacity is also very close to LiCoO2, but it can deliver higher practical capacity over 180 mAh/g. However, LiNiO2 is not widely fabricated for Li-ion batteries because of some annoying problems. First, LiNiO2 has the high irreversible capacity at the first cycle. Second, it was discovered that dramatic capacity
doi:10.6342/NTU201601970
16
fading would occur after tens of cycles which might be due to the migration of Ni ions from original layers to Li layers. The presence of Ni ions in Li layers may induce anisotropic volumetric lattice change along a- and c-axis resulting in cracks and reducing the diffusion coefficient of Li ions [39]. Third, the most serious problem is its stability at high temperatures. LiNiO2 become unstable at high temperature and is easy to release oxygen at charged state, which would react with electrolyte as well as lithiated carbon anode and lead to thermal runaway [40, 41]. The structure limitations of LiNiO2 can be partly overcome by replacement of Ni. LiMxN1-x, such as Co, Mn, Mg, Al, and Cr was proposed and thus result in some promising multi-cation oxides.
Layered lithium manganese oxide (LiMnO2)
LiMnO2 has also been extensively studied for rechargeable lithium batteries because of its high theoretical capacity 285 mAh/g based on a Mn3+/Mn4+ couple, about twice that of LiMn2O4, and low cost compared to LiCoO2. LiMnO2 is not thermodynamically stable as the layered structure, but as an orthorhombic phase o- LiMnO2. It is well known that LiMnO2 transforms irreversibly to a material with spinel- like structure during electrochemical cycling [42-45]. However, the mesostable LiMnO2 could be stabilized in the layer structure by a number of possible substituent elements. For example, substituting a small fraction (< 5%) of the Mn with Al [46] and with Cr [47]. Another phase of interest in this system is the monoclinic polymorph of LiMnO2, which has the cation ordering of the α-NaFeO2 structure, where Li ions are located in octahedral sites between MnO6 sheets. Unlike LiCoO2, which is rhombohedral ( R m3 ), LiMnO2 is monoclinic (C2/m) because the coordination polyhedron around the Mn3+ ions is distorted from a regular octahedron due to the Jahn- Teller effect.
doi:10.6342/NTU201601970
17
Layered lithium multi-cation oxide (LiNixCoyMn1-x-yO2)
LiNixCoyMn1-x-yO2 is the cathode material which successfully integrates the advantages of LiCoO2, LiNiO2 and LiMnO2, and has garnered the attention of both fundamental scientists and applied researchers. LiNixCoyMn1-x-yO2 has the same structure as LiCoO2 and LiNiO2 in -NaFeO2 with a cubic close-packed arrangement of the oxide ions. The doped Co and Mn ions homogeneously substitute the Ni sites. Of course, some exceptions, like doping into Li sites, are also possible. To identify the doping sites of cations, the ratio of “a”, the distance between metal ions, to “c”, the distance between the slabs of interlayer (also shown in Fig. 2-8), was considered an important index. For ideal cubic close-packed lattice, the ratio of c/3a should be 1.633.
With higher content of transition metal cations in Li sites, the ratio would be closer to this value. And it was found that the ratio of c/3a of LiNiO2 was 1.639 [48] while the ratio of LiNi1/3Co1/3Mn1/3O2 was 1.657 [49].
Flashing back to the development of mixed-transition material. Delmas [39, 50] et al. developed that the homogeneous Co doping in LiNiO2 to form LiNi1-xCoxO2. The effects of Co doping include higher structural stability from suppressing Ni migration to Li sites and higher thermal stability from less losing oxygen [51]. In 1992, Dahn et al. [52] suggested doping Mn, instead of Co, into Ni sites forming LiNi1-yMnyO and found the optimum performance on capacity and cycle life when y=0.5. Furthermore, oxides with three-transition-metal mixing were proposed one from another from 1999 [53]. Because these new materials showed the attractive properties of higher capacity, higher operating voltage, and longer cycle life compared with LiCoO2 and LiNiO2, many related studies were soon published. Ohzuku et al. [54] introduced an oxide of LiNi1/3Co1/3Mn1/3O2 synthesized at 1000 oC and characterized a capacity of 150 mAh/g between 2.5–4.2 V. Its reversible capacity was measured to be 160 mAh/g in the cut-
doi:10.6342/NTU201601970
18
off range of 2.5–4.4 V (Fig. 2-9 [55]). Additionally, It was then further revealed that the capacity could be raised to more than 200 mAh/g when charging to 4.6 V and the cycle life was still good [49]. Electronic structure studies have shown that it consists of Ni2+, Mn4+ and Co3+, and reversible capacity involves the oxidation of Ni2+ to Ni4+ with a two-electron transfer during the initial stage of Co3+ to Co4+ in the later stage [56, 57].
Thus the higher capacity of layered LiNi1/3Co1/3Mn1/3O2 could be due to the improved chemical stability associated Ni2+/3+ and the Ni3+/4+ redox couple compared to Co3+/4+
redox couple
Figure 2-9 Voltage vs. capacity profiles for the cell, Li/ Li(Ni1/3Co1/3Mn1/3)O2 in (a) 2.5-4.4 V. (b)2.5-4.7 V (c) Cycling performance of the cells [55].
doi:10.6342/NTU201601970
19
Layered Lithium-rich Cathode Materials (LrMOs)
The layered lithium-rich Mn-transition metal oxides (LrMOs), generally represented as Li1+y(Mn, M)1-yO2 (M = Mn, Ni, Co), are of interest as a new generation of cathode materials for high energy density of lithium ion batteries. In 2001, the series of compounds Li[Li1/3-2x/3NixMn2/3-x/3]O2 (0≦x≦1/2) with the absence of expensive and toxic Co element were first reported by Lu and Dahn et al [58]. On the other hand, Thackeray et al. applied the ‘‘composite oxide’’ concept, by which the Li-rich Mn- based layered oxide can be regarded as a ‘‘composite oxide’’ consisting of LiMO2 (M=
Mn, Ni, Co) and Li2MnO3 components [59, 60]. This is an alternative approach to stabilize the structural of delithated Li1-xMO2 and improve the electrochemical properties of solid electrode and solid electrolyte materials by using structural units rather than cation or anion substituents. In fact, these composite formulae can be normalized to the more general notation xLi2MnO3.(1-x) LiMO2 (M= Mn, Ni, Co) in the notation as the Li[Li1/3-2x/3NixMn2/3-x/3]O2 because the Li2MnO3 can be considered as Li[Li1/3Mn2/3]O2. For example, The 0.5Li2MnO3 ・ 0.5 Li Mn0.5Ni0.5O2 and 0.5Li2MnO3 ・ 0.5 Li Co0.33Mn0.33Ni0.33O2 material can also described as Li[Li0.2Ni0.2Mn0.6]O2 and Li[Li0.2Ni0.2Mn0.6]O2 [61, 62], respectively.
However, until now, there has been an ongoing debate in the literature on whether these LrMOs form homogeneous solid solutions or Li2MnO3 domains within a LiMO2
matrix [31, 63-78]. Li2MnO3 and LiMO2 both have the same layered rocksalt structure but differ in the space group symmetry depending on the ordering of ions in the unit cell [59]. LiMO2 belongs to a trigonal (rhombohedral) crystal system with R m3 space group symmetry (Fig. 2-10) and Li2MnO3 belongs to a monoclinic crystal system with C2/m space group symmetry (Fig. 2-11) [73]. The unit cell parameters of the former are a=b=2.8873 Å, and c=14.2901 Å, while the one of the latter are a=4.937 Å, b=
doi:10.6342/NTU201601970
20
8.532 Å, and c=5.030 Å. In the case of Li2MnO3, the Li+ and Mn4+ ions occupy the transition metal layer, whereas for the LiMO2 structure, the transition metal layers are occupied by only transition metal ions (as shown in Fig. 2-9). However, these two structures have similar cubic closed-packed layers with interlayer spacing of 4.7Å ((001) for monoclinic and (003) for trigonal), which allows for integration of these structures at an atomic level to form Li2MnO3・LiMO2 (M= Mn, Ni, Co) composite [79].
Figure 2-10. Trigonal (R m3 ) LiMO2 (a) unit cell and (b) atomic arrangement in the transition-metal layer [73].
Figure 2-11. Monoclinic (C2/m) Li2MnO3 (a) unit cell and (b) atomic arrangement in the transition-metal layer. S1 and S2 indicate sites occupied, respectively, by excess Li atoms and Mn atoms [73].
The typical the electrochemical reactions of the xLi2MnO3・(1-x) LiMO2
![Figure 2-3 Schematic drawing showing the shape and components of various Li-ion battery configuration: a: cylindrical; b: coin; c: prismatic; d: thin and flat [6].](https://thumb-ap.123doks.com/thumbv2/9libinfo/9600347.628813/30.892.140.782.111.556/figure-schematic-drawing-showing-components-configuration-cylindrical-prismatic.webp)
![Figure 2-15 O 1s, F 1s, P 2p and C 1s XPS spectra of cathode electrodes after 0 to 50 cycles [94]](https://thumb-ap.123doks.com/thumbv2/9libinfo/9600347.628813/47.892.138.752.629.909/figure-o-f-xps-spectra-cathode-electrodes-cycles.webp)
![Figure 2-23 Schematic view of the layered cathode material with a pillar layer at the surface [112]](https://thumb-ap.123doks.com/thumbv2/9libinfo/9600347.628813/54.892.160.749.693.944/figure-schematic-layered-cathode-material-pillar-layer-surface.webp)