Assessment to improve learning in mathematics:
The BEAR Assessment System
Abstract
This paper discusses how assessment practices in mathematics education can improve or hinder learning. We describe a principles-based system of assessment, called the BEAR Assessment System. The system was designed to build upon methodological and conceptual advances in assessment. We outline the four principles and the four “building blocks” of the assessment system, and provide an example of each of these components from our work in the context of a German Mathematical Literacy Test.
Keywords:assessment, mathematics education, BEAR assessment system, item response models, construct map
摘 要
本文討論數學教育中評量實務,是如何來促進或阻礙學習。我們介紹 一個原則基準的評量系統,稱做 BEAR評量系統。該系統是建立在先進的 評量方法和概念上。我們簡述評量系統的四項原則以及四個基石( building blocks),並且以我們對德國數學能力測驗的工作架構為例,舉例說明每一 個成分。
關鍵詞:評量、數學教育、 BEAR評量系統、試題反應模式、建構圖 Mark Wilson
Professor, University of California, Berkeley USA
Claus Carstensen
Junior-Professor, IPN - Leibniz Institute for Science Education, Kiel Germany
促進數學學習的評量: BEAR評量系統
Introduction
The Berkeley Evaluation and Assessment Research (BEAR) Center has for the last several years been involved in the development of an assessment system, which we call the BEAR Assessment System. The system consists of four principles, each associated with a practical “building block” (Wilson, 2005) as well as an integrative activity that can take on different aspects under different circumstances (e.g., assessment moderation/cut score setting). Its original deployment was as a curriculum-embedded system in Science (Wilson & Sloane, 2000), but it has clear and logical extensions to other contexts such as in higher education (Wilson & Scalise, in press), in large scale assessment (Wilson &
Draney, 2005) and across other disciplinary areas, such as chemistry (Claesgens, Scalise, Draney, Wilson, & Stacy, 2002), and the focus of this paper, mathematics.
Inn this paper, the four principles of the BEAR Assessment System are discussed, and their application to large scale assessment is described using an example based on a German assessment of mathematical literacy used in conjunction with the international PISA assessments (OECD 2005a). The BEAR Assessment System is based on a conception of a tight interrelationship between classroom-level and large-scale assessment (Wilson, 2004b; Wilson & Draney, 2004), and hence, in the process of discussing this large-scale application, a certain amount of the argumentation and exemplification will be directed towards classroom level applications, or, more accurately, towards the common framework that binds the two together (Wilson, 2004a).
The Assessment Triangle and the BEAR Approach
Three broad elements on which every assessment should rest are described by the Assessment Triangle from the Knowing What Students Know report (NRC, 2001, p. 296), shown in Figure 1.
Figure 1. The KWSK assessment triangle.
According to the Committee Report, an effective assessment design requires:
• a model of student cognition and learning in the field of study;
• well-designed and tested assessment questions and tasks, often called items;
• and ways to make inferences about student competence for the particular context of use.
These elements are of course inextricably linked, and reflect concerns similar to those addressed in the conception of constructive alignment (Biggs, 1999), regarding the desirability of achieving goodness-of-fit among learning outcomes, instructional approach and assessment.
Models of student learning should specify the most important aspects of student achievement to assess, and they provide clues about the types of tasks that will elicit evidence and the types of inferences that can relate observations back to learning models and ideas of cognition. To serve as quality evidence, items themselves need to be systematically developed with both the learning model and subsequent inferences in mind, and they need to be tried out and the results of the trials systematically examined.
Finally, the inferences provide the “why” of it all - if we don’t know what we want to do with the assessment information, then we can’t figure out what the student model or the items should be. Of course, context determines many specifics of the assessment.
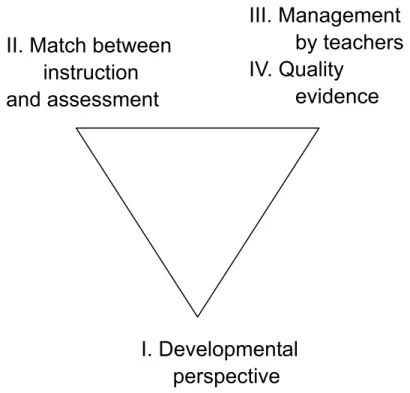
The BEAR Assessment System is based on the idea that good assessment addresses these considerations through four principles: (1) a developmental perspective, (2) a
observations interpretation
cognition
match between instruction and assessment, (3) the generating of quality evidence, and (4) management by instructors to allow appropriate feedback, feed forward and follow-up.
The way that these four principles map onto the assessment triangle is shown in Figure 2. See Wilson (2005) for a detailed account of an instrument development process that works through these steps. Below we take up each of these issues in turn.
Figure 2. The Principles of the BEAR Assessment System.
Principle 1: Developmental Perspective
A "developmental perspective" regarding student learning means assessing the development of student understanding of particular concepts and skills over time, as opposed to, for instance, making a single measurement at some final or supposedly significant time point. Criteria for developmental perspectives have been challenging goals for educators for many years. What to assess and how to assess it, whether to focus on generalized learning goals or domain-specific knowledge, and the implications of a variety of teaching and learning theories all impact what approaches might best inform developmental assessment. From Bruner's nine tenets of hermeneutic learning (Bruner, 1996) to considerations of Empirical, Constructivist and Sociocultural schools of thought
II. Match between instruction and assessment
III. Management by teachers IV. Quality
evidence
I. Developmental
perspective
(Olson & Torrance, 1996) to the recent report, "How People Learn" (NRC, 1999), broad sweeps of what might be considered in a developmental perspective have been posited and discussed. Cognitive taxonomies such as Bloom's Taxonomy of Educational Objectives (Bloom, 1956), Haladyna's Cognitive Operations Dimensions (Haladyna, 1994) and the Structure of the Observed Learning Outcome (SOLO) Taxonomy (Biggs & Collis, 1982) are among many attempts to concretely identify generalizable frameworks. One issue is that as learning situations vary, and their goals and philosophical underpinnings take different forms, a "one-size-fits-all" development assessment approach rarely satisfies course needs. Much of the strength of the BEAR Assessment System comes in providing tools to model many different kinds of learning theories and learning domains. What is to be measured and how it is to be valued in each BEAR assessment application is drawn from the expertise and learning theories of the teachers and/or curriculum developers involved in the developmental process.
Building Block 1: Progress variables. Progress variables (Masters, Adams, and Wilson 1990; Wilson 1990) embody the first of the four principles: that of a developmental perspective on assessment of student achievement and growth. The four building blocks and their relationship to the assessment triangle is shown in Figure 3. The term "variable" is derived from the measurement concept of focusing on one characteristic to be measured at a time. A progress variable is a well-thought-out and researched ordering of qualitatively different levels of performance. Thus, a variable defines what is to be measured or assessed in terms general enough to be interpretable across a curriculum but specific enough to guide the development of the other components. When instructional objectives are linked to the variable, then it also defines what is to be taught.
Progress variables are one model of how assessments can be integrated with instruction and accountability. Progress variables provide a way for large-scale assessments to be linked in a principled way to what students are learning in classrooms, while remaining independent of the content of a specific curriculum.
Figure 3. The building blocks of the BEAR Assessment System.
The approach assumes that, within a given curriculum, student performance on curricular variables can be traced over the course of the year, facilitating a more developmental perspective on student learning. Assessing the growth of students' understanding of particular concepts and skills requires a model of how student learning develops over a set period of (instructional) time. A growth perspective helps one to move away from "one shot" testing situations, and away from cross sectional approaches to defining student performance, toward an approach that focuses on the process of learning and on an individual's progress through that process. Clear definitions of what students are expected to learn, and a theoretical framework of how that learning is expected to unfold, as the student progresses through the instructional material, are necessary to establish the construct validity of an assessment system.
Explicitly aligning the instruction and assessment addresses the issue of the content validity of the assessment system, as well. Traditional testing practices – in standardized tests as well as in teacher-made tests – have long been criticized for oversampling items that assess only basic levels of knowledge of content and ignore more complex levels of understanding. Relying on variables to determine what skills are to be assessed means that assessments focus on what is important, not what is easy to assess. Again, this reinforces the central instructional objectives of a course. Resnick and Resnick (1992)
II. Items Model III. Outcome Space IV. Measurement Model
I. Developmental
Progress Variables
have argued: "Assessments must be designed so that when teachers do the natural thing – that is, prepare their students to perform well – they will exercise the kinds of abilities and develop the kinds of skill and knowledge that are the real goals of educational reform"
(p. 59). Variables that embody the aims of instruction (e.g. “standards”) can guide assessment to do just what the Resnicks were demanding. In a large-scale assessment, the notion of a progress variable will be more useful to the parties involved than simple number-correct scores or standings relative to some norming population, providing the diagnostic information so often requested.
The idea of using variables also offers the possibility of gaining significant efficiency in assessment: Although each new curriculum prides itself on bringing something new to the subject matter, in truth, most curricula are composed of a common stock of content.
And, as the influence of national and state standards increases, this will become more true, and also easier to codify. Thus, we might expect innovative curricula to have one, or perhaps even two variables that do not overlap with typical curricula, but the remainder will form a fairly stable set of variables that will be common across many curricula.
Variables are derived in part from research into the underlying cognitive structure of the domain and in part from professional opinion about what constitutes higher and lower levels of performance or competence, but are also informed by empirical research into how students respond to instruction or perform in practice (Pellegrino et al, 2000). To more clearly understand what a progress variable is, let us consider an example.
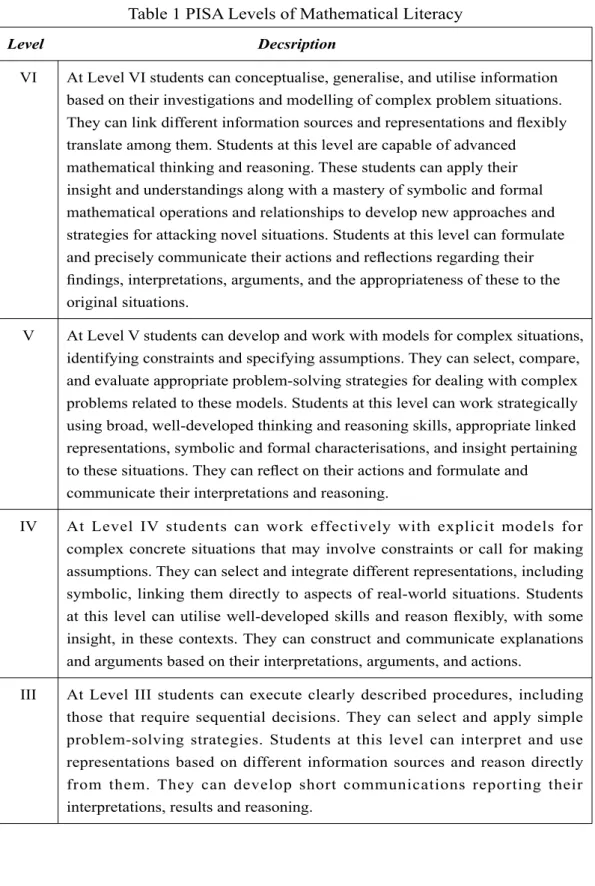
The example explored in this paper is a test of mathematics competency taken from one booklet of a German mathematics test administered to a random sub-sample of the German PISA sample of 15 year-old students in the 2003 administration (German PISA Consortium, 2004). The test was developed under the same general guidelines as the PISA Mathematics test, where Mathematical Literacy is a “described variable” with several successive levels of sophistication in performing mathematical tasks (OECD, 2005).
These levels are shown in Table 1.
Table 1 PISA Levels of Mathematical Literacy
Level DecsriptionVI At Level VI students can conceptualise, generalise, and utilise information based on their investigations and modelling of complex problem situations.
They can link different information sources and representations and flexibly translate among them. Students at this level are capable of advanced
mathematical thinking and reasoning. These students can apply their insight and understandings along with a mastery of symbolic and formal mathematical operations and relationships to develop new approaches and strategies for attacking novel situations. Students at this level can formulate and precisely communicate their actions and reflections regarding their findings, interpretations, arguments, and the appropriateness of these to the original situations.
V At Level V students can develop and work with models for complex situations, identifying constraints and specifying assumptions. They can select, compare, and evaluate appropriate problem-solving strategies for dealing with complex problems related to these models. Students at this level can work strategically using broad, well-developed thinking and reasoning skills, appropriate linked representations, symbolic and formal characterisations, and insight pertaining to these situations. They can reflect on their actions and formulate and communicate their interpretations and reasoning.
IV At Level IV students can work effectively with explicit models for complex concrete situations that may involve constraints or call for making assumptions. They can select and integrate different representations, including symbolic, linking them directly to aspects of real-world situations. Students at this level can utilise well-developed skills and reason flexibly, with some insight, in these contexts. They can construct and communicate explanations and arguments based on their interpretations, arguments, and actions.
III At Level III students can execute clearly described procedures, including those that require sequential decisions. They can select and apply simple problem-solving strategies. Students at this level can interpret and use representations based on different information sources and reason directly from them. They can develop short communications reporting their interpretations, results and reasoning.
II At Level II students can interpret and recognise situations in contexts that require no more than direct inference. They can extract relevant information from a single source and make use of a single representational mode.
Students at this level can employ basic algorithms, formulae, procedures, or conventions. They are capable of direct reasoning and making literal interpretations of the results.
I At Level I students can answer questions involving familiar contexts where all relevant information is present and the questions are clearly defined. They are able to identify information and to carry out routine procedures according to direct instructions in explicit situations. They can perform actions that are obvious and follow immediately from the given stimuli.
The levels shown in Table 1 were derived from a multistep process (OECD, 2005b) as follows: (a) Mathematics curriculum experts identified possible subscales in the domain of mathematics, (b) PISA items were mapped onto each subscale, (c) a skills audit of each item in each subscale was carried out on the basis of a detailed expert analysis, (d) field test data was analysed to yield item locations, (e), the information from the two previous steps were combined. In this last step, the ordering of the items was linked with the descriptions of associated knowledge and skills, giving a hierarchy of knowledge and skills that defined the progress variable. This results in natural clusters of skills, which provides a basis for understanding and describing the progress variable. The results of this last step were also validated with later empirical data, and by using a validation process involving experts. Note that this method of developing a progress variable is much less precise than the approaches described in the references above (e.g., Wilson
& Sloane, 2000; Wilson & Scalise, in press), and will thus usually result in a progress variable that is much broader in its content.
Principle 2: Match between Instruction and Assessment
The match between instruction and assessment in the BEAR Assessment System is established and maintained through two major parts of the system: progress variables, described above, and assessment tasks or activities, described in this section. The main motivation for the progress variables so far developed is that they serve as a framework for the assessments and a method of making measurement possible. However, this second principle makes clear that the framework for the assessments and the framework for the curriculum and instruction must be one and the same. This is not to imply that the needs
of assessment must drive the curriculum, nor that the curriculum description will entirely determine the assessment, but rather that the two, assessment and instruction, must be in step—they must both be designed to accomplish the same thing, the aims of learning, whatever those aims are determined to be.
Using progress variables to structure both instruction and assessment is one way to make sure that the two are in alignment, at least at the planning level. In order to make this alignment concrete, however, the match must also exist at the level of classroom interaction and that is where the nature of the assessment tasks becomes crucial.
Assessment tasks need to reflect the range and styles of the instructional practices in the curriculum. They must have a place in the “rhythm” of the instruction, occurring at places where it makes instructional sense to include them, usually where instructors need to see how much progress their students have made on a specific topic. See Minstrell (1998) for an insightful account of such occasions.
One good way to achieve this is to develop both the instructional materials and the assessment tasks at the same time—adapting good instructional sequences to produce assessable responses and developing assessments into full-blown instructional activities.
Doing so brings the richness and vibrancy of curriculum development into assessment, and also brings the discipline and hard-headedness of assessment data into the design of instruction.
By developing assessment tasks as part of curriculum materials, they can be made directly relevant to instruction. Assessment can become indistinguishable from other instructional activities, without precluding the generation of high-quality, comparative, and defensible assessment data on individual students and classes.
Building Block 2: The items design. The items design governs the match between classroom instruction and the various types of assessment. The critical element to ensure this in the BEAR assessment system is that each assessment task is matched to at least one variable.
A variety of different task types may be used in an assessment system, based on the requirements of the particular situation. There has always been a tension in assessment situations between the use of multiple-choice items, which are perceived to contribute to more reliable assessment, and other, alternative forms of assessment, which are perceived to contribute to the validity of a testing situation. The BEAR Assessment System, includes designs that use different item types to resolve this tension.
When using this assessment system within a curriculum, a particularly effective mode of assessment is what we call embedded assessment. By this we mean that opportunities to assess student progress and performance are integrated into the instructional materials and are virtually indistinguishable from the day-to-day classroom activities. We found it useful to think of the metaphor of a stream of instructional activity and student learning,
with the teacher dipping into the stream of learning from time to time to evaluate student progress and performance. In this model or metaphor, assessment then becomes part of the teaching and learning process, and we can think of it being assessment for learning (Black, Harrison, Lee, Marshall & Wiliam, 2003). If assessment is also a learning event, then it does not take unnecessary time away from instruction, and the number of assessment tasks can be more efficiently increased in order to improve the reliability of the results (Linn & Baker, 1996). But, for assessment to become fully and meaningfully embedded in the teaching and learning process, the assessment must be linked to a specific curriculum, i.e. it must be curriculum dependent, not curriculum independent as must be the case in many high stakes testing situations (Wolf & Reardon, 1996).
In embedded assessment in classrooms, there will be a variety of different types of assessment tasks, just as there is variety in the instructional tasks. These may include individual and group "challenges," data processing questions, questions following student readings, and even instruction/assessment events such as “town meetings”. Such tasks may be open-ended, requiring students to fully explain their responses in order to achieve a high score, or they may be multiple-choice, freeing teachers from having to laboriously hand-score all of the student work (Briggs, Alonzo, Schwab & Wilson, in press).
There are many variations in the way that variables can be realized in practice, from using different assessment modes (multiple choice, performance assessment, mixed modes, etc.), to variations in the frequency of assessing students (once a week, once a month, etc.), to variations in the use of embedding of assessments (all assessments embedded, some assessments in a more traditional testing format, etc.).
In large-scale testing situations, the basis on which the mix of task types is decided may be somewhat different from that in embedded assessment contexts. Many large-scale tests are subject to tight constraints both in terms of the time available for testing, and in terms of the financial resources available for scoring. Thus, although performance assessments are valued because of their perceived high validity, it may not be possible to collect enough information through performance assessments alone to accurately estimate each examinee’s proficiency level; multiple-choice items, which require less time to answer and which may be scored by machine rather than by human raters, may be used to increase the reliability of the large-scale test.
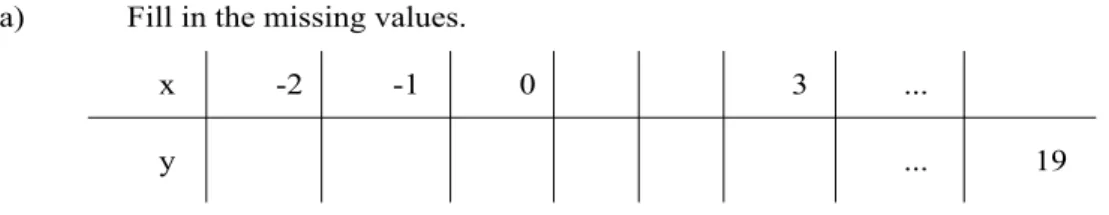
Returning to the German Mathematical Literacy example, the test booklet contained 64 dichotomous items; 18 of these items were selected for this example. An example item is shown in Figure 4. Each item was constructed according to Topic Areas and the Types of Mathematic Modelling required. The Topic Areas were: Arithmetic, Algebra and Geometry. The Modelling Types were: Technical Processing, Numerical Modelling and Abstract Modelling. The Technical Processing dimension requires students to carry-out operations that have been rehearsed such as computing numerical results using standard
procedures—see, for example, the item shown in Figure 4a. Numerical Modelling requires the students to construct solutions for problems with given numbers in one or more steps—see the item shown in Figure 4b. In contrast Abstract Modelling requires students to formulate rules in a more general way, for example by giving an equation or by describing a general solution in some way—see the item shown in Figure 4c. Because a design is built into the items, the data responses may also be considered also data from a psychological experiment. The experimental design has two factors, Topic Area and Modeling Type. In sum, the design test is a 3x3 design with two observations of each pair of conditions, resulting in 18 items in total.
Function
The function given by the equation y=2x-1 shall be analysed.
a) Fill in the missing values.
x -2 -1 0 3 ...
y ... 19
Figure 4a. A Technical Processing item in Algebra1.
Rectangles
Around a small rectangle a second one is drawn. A third rectangle is drawn around the two and so on. The distance between the rectangles is always 1 cm.
1 Copyright German PISA Consortium.
1 cm
1cm
b) By how much do the length, width and the circumference increase from rectangle to rectangle?
Length increases by: cm;
Width increases by: cm;
Circumference increases by:
cm.
Figure 4b. A Numerical Modeling item in Algebra2.
Difference
Put the digits 3 , 6 , 1 , 9 , 4 , 7 in the boxes so that the difference between the two three digit numbers is maximised.
(Each digit may be used only once) 1. number:
2. number:
Figure 4c. An Abstract Modeling item in Arithmetic3.
Principle 3: Management by Teachers
For information from the assessment tasks and the BEAR analysis to be useful to instructors and students, it must be couched in terms that are directly related to the instructional goals behind the progress variables. Open-ended tasks, if used, must be quickly, readily, and reliably scorable. The categories into which they are scored must be readily interpreted in an educational setting, whether it is within a classroom, by a parent,
2 Copyright German PISA Consortium
3 Copyright German PISA Consortium
or in a policy-analysis setting. The requirement for transparency in how item outcomes relate to how students actually respond to an item leads to the third building block.
Building Block 3: The outcome space. The outcome space is the set of categorical outcomes into which student performances are categorized for all the items associated with a particular progress variable. In practice, these are presented as scoring guides for student responses to assessment tasks. This is the primary means by which the essential element of teacher professional judgment is implemented in the BEAR Assessment System. These are supplemented by “exemplars:” examples of student work at every scoring level for every task and variable combination, and “blueprints,” which provide the teachers with a layout showing opportune times in the curriculum to assess the students on the different variables.
For the information from assessment opportunities to be useful to teachers, it must be couched in terms that are directly interpretable with respect to the instructional goals of the variables. Moreover, this must be done in a way that is intellectually and practically efficient. Scoring guides have been designed to meet these two criteria. A scoring guide serves as a practical definition for a variable by describing the performance criteria necessary to achieve each score level of the variable.
The scoring guides are meant to help make the performance criteria for the assessments clear and explicit (or "transparent and open" to use Glaser's (1990) terms) not only to the teachers but also to the students and parents, administrators, or other "consumers" of assessment results. In fact, we strongly recommend to teachers that they share the scoring guides with administrators, parents and students, as a way of helping them understand what types of cognitive performance were expected and to model the desired processes.
In addition, students appreciate the use of scoring guides in the classroom. In a series of interviews with students in a Kentucky middle school that was using the BEAR Assessment System (reported in Roberts & Sipusic, 1999), the students spontaneously expressed to us their feeling that, sometimes for the first time, they understand what it was that their teachers expected of them, and felt they knew what was required to get a high score. The teachers of these students found that the students were often willing to redo their work in order to merit a higher score.
Traditional multiple choice items are, of course, based on an implicit scoring guide one option is correct, the others all incorrect. Alternative types of multiple choice items can be constructed that are explicitly based on the levels of a construct map (Briggs, Alonzo, Schwab & Wilson, in press), and thus allow a stronger interpretation of the test results. For the German Mathematical Literacy example, the items are all traditional multiple choice their development did not involve the explicit construction of an outcome space.
Principle 4: Quality Evidence
Technical issues of reliability and validity, fairness, consistency, and bias can quickly sink any attempt to measure along a progress variable as described above, or even to develop a reasonable framework that can be supported by evidence. To ensure comparability of results across time and context, procedures are needed to (a) examine the coherence of information gathered using different formats, (b) map student performances onto the progress variables, (c) describe the structural elements of the accountability system tasks and raters in terms of the achievement variables, and (d) establish uniform levels of system functioning, in terms of quality control indices such as reliability. While this type of discussion can become very technical to consider, it is sufficient to keep in mind that the traditional elements of assessment standardization, such as validity and reliability studies and bias and equity studies, must be carried out to satisfy quality control and ensure that evidence can be relied upon.
Building Block 4: Wright maps. Wright maps represent the principle of quality evidence. Progress maps are graphical and empirical representations of a variable, showing how it unfolds or evolves in terms of increasingly sophisticated student performances. They are derived from empirical analyses of student data on sets of assessment tasks. Maps are based on an ordering of these assessment tasks from relatively easy tasks to more difficult and complex ones. A key feature of these maps is that both students and tasks can be located on the same scale, giving student proficiency the possibility of substantive interpretation, in terms of what the student knows and can do and where the student is having difficulty. The maps can be used to interpret the progress of one particular student, or the pattern of achievement of groups of students, ranging from classes to nations.
Wright maps can be very useful in large-scale assessments, providing information that is not readily available through numerical score averages and other traditional summary information they are used extensively, for example, in reporting on the PISA assessments (OECD, 2005a). A Wright map illustrating the estimates for the Rasch model is shown in Figure 5. On this map, and “X” represents a group of students, all at the same estimated achievement level. The symbols “T,” “N” and “A” each represent a Technical Processing, Numerical Modeling, and Abstract Modeling item, with the Topic Area indicated by the column headings above. Where a student (X) is located near an item, this indicates that there is approximately a 50% chance of the student getting the item correct. Where the student is above the item, the chance is greater than 50%, and the further it is above, the greater the chance. Where the student is lower than the item, the chance is less than 50%, and the further it is below, the lesser the chance. Thus this map illustrates the description of the Mathematical Literacy variable in terms of the Levels defined in Table 1 as well
as the Topic Areas and the Modeling Types in the items design. The Topic Areas reflect the earlier placement of Arithmetic in the curriculum than Geometry and Algebra. The ordering of Modeling Types is generally consistent with what one might expect from the definitions of the Levels, except for the Arithmetic Abstract Modeling items, which seem to be somewhat easier than expected. This is a topic that deserves a follow-up investigation.
Figure 5. A Wright map of the Mathematical Literacy variable.
�����������������������������������������
�����������������������������������������������������
������������������
��������������������������������������������������������������
������������������ ��
������������������
������������������
������������������
������������������
������������������������������������������������������������
������������������������������������������������������������
������������������������������������������������������������
������������������������������������������������������������
������������������������������������������������������������
������������������������������������������������������������
������������������������������������������������������������
������������������������������������������������������������
������������������������������������������������������������
������������������������������������������������������������
������������������������������������������������������������
������������������������������������������������������������
������������������������������������������������������������
������������������������������������������������������������
������������������������������������������������������������
������������������������������������������������������������
�������������������������������������������������������������
������������������������������������������������������������
������������������������������������������������������������
������������������ �
������������������������������������������������������������
������������������������������������������������������������
������������������������������������������������������������
������������������
������������������
������������������
������������������
������������������
������������������
������������������
������������������
Notes: (a) Each 'X' represents 5 cases;
(b) T= Technical Processing, N= Numerical Modeling, A= Abstract Modeling.
We typically use a multi-dimensional Rasch modeling approach to calibrate the maps for use in the BEAR Assessment System (see Adams, Wilson, & Wang, 1997, for the specifics of this model). These maps have at least two advantages over the traditional method of reporting student performance as total scores or percentages: First, it allows teachers to interpret a student’s proficiency in terms of average or typical performance on representative assessment activities; and second, it takes into consideration the relative difficulties of the tasks involved in assessing student proficiency.
Once constructed, maps can be used to record and track student progress and to illustrate the skills that students have mastered and those that the students are working on. By placing students' performance on the continuum defined by the map, teachers, administrators and the public can interpret student progress with respect to the standards that are inherent in the progress variables. Wright maps can come in many forms, and have many uses in classroom and other educational contexts. In order to make the maps flexible and convenient enough for use by teachers and administrators, we have also developed software for teachers to use to generate the maps. This software, which we call GradeMap (Kennedy, Wilson & Draney, 2005), allows consumers to enter the scores given to the students on assessments, and then map the performance of groups of students, either at a particular time or over a period of time.
Bringing it all together: Performance standard setting
The final ingredient in the BEAR Assessment System is the means by which the four building blocks discussed thus far are brought together into a coherent system—in the case of large-scale assessment, by standard-setting. We have developed a standard-setting procedure, called “Construct mapping” (Wilson & Draney, 2002), that allows the standard-setting committee members to use the item response map as a model of what a student at a given level knows and can do. The map is represented in a piece of software (Hoskens & Wilson, 2000) that allows standard-setting committee members to find out about the details of student performance at any given proficiency level, and to assist them in deciding where the cutoffs between performance levels should be.
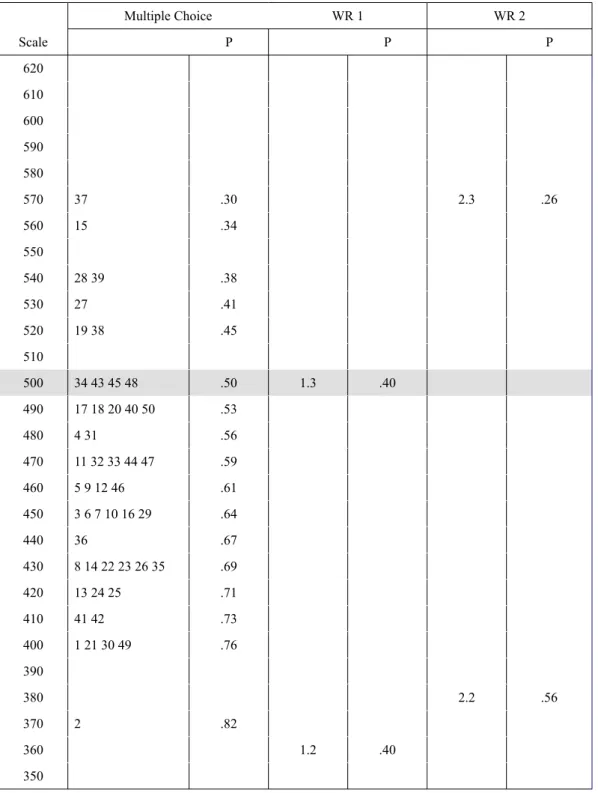
An example showing a section of such an item map is given in Figure 6. Note that this illustration is from a somewhat more complicated example than the German Mathematical Literacy Test, involving both multiple-choice items and two items that required written responses (WR1 and WR2) and which were scored into 5 categories (Wilson & Draney, 2005). The column on the far left contains a numerical scale that allows the selection and examination of a given point on the map, and the selection of the eventual cut scores for the performance levels. This scale is a transformation of the
original logit scale, designed to have a mean of 500, and to range from approximately 0 to 1000. (This choice of scale is a somewhat arbitrary, but designed to avoid negative numbers and small decimals, which some members of standard-setting committees find annoying). The next two columns contain the location of the multiple-choice items (labeled by number of appearance on the examination), and the probability that a person at the selected point would get each item correct (in this case, a person at 500 on the scale – represented by the shaded band across the map). The next two sets of columns display the thresholds for the two written response items for example, the threshold levels for scores of 2 and 3 on written response item 1 are represented by 1.2 and 1.3, respectively (although each item is scored on a scale of 1 to 5 on this particular examination, only the part of the scale where a person would be most likely to get a score of 2 or 3 on either item is shown) and the probability that a person at 500 on the scale would score at that particular score level on each item. The software also displays, for a person at the selected point on the GSE scale, the expected score total on the multiple choice section (the Figure does not show this part of the display), and the expected score on each of the written response items.
Multiple Choice WR 1 WR 2
Scale P P P
620 610 600 590 580
570 37 .30 2.3 .26
560 15 .34
550
540 28 39 .38
530 27 .41
520 19 38 .45
510
500 34 43 45 48 .50 1.3 .40
490 17 18 20 40 50 .53
480 4 31 .56
470 11 32 33 44 47 .59
460 5 9 12 46 .61
450 3 6 7 10 16 29 .64
440 36 .67
430 8 14 22 23 26 35 .69
420 13 24 25 .71
410 41 42 .73
400 1 21 30 49 .76
390
380 2.2 .56
370 2 .82
360 1.2 .40
350
Figure 6. A screen-shot of a cut-point setting map
In order to set the cut points, the committee first acquaints itself with the test materials. The meaning of the various parts of the map is then explained, and the committee members and the operators of the program spend time with the software familiarizing themselves with points on the scale.
The display of multiple choice item locations in ascending difficulty, next to the written response thresholds, helps to characterize the scale in terms of what increasing proficiency “looks like” in the pool of test-takers. For example, if a committee was considering 500 as a cut point between performance levels, they could note that it is a point at which items like 34, 43, 45, and 48 are expected to be chosen correctly about 50% of the time, a harder item like 37 is expected to be chosen correctly about 30%, and easier items like 2 are expected to be chosen correctly 80% of the time. The set of multiple-choice items, sorted so they are in order of ascending difficulty, is available to the committee so that the members can relate these probabilities to their understanding of the items. The committee could also note that a student at that point (i.e., 500), would be equally likely to score a 2 or a 3 on the first written response item (40% each) and more likely to score a 2 than a 3 on the second (56% vs. 26%). Examples of student work at these levels would be available to the committee for consideration of the interpretation of these scores. Committee members can examine the responses of selected examinees to both the multiple choice and written response items, chart their location on the map, and judge the level.
The committee then, through a consensus-building process, sets up cut points on this map, using the item response calibrations to give interpretability in terms of predicted responses to both multiple choice items and open-ended items. Locations of individual students and distributions on the scaled variable are also available for interpretative purposes. This procedure allows both criterion-referenced and norm-referenced interpretations of cut scores and norm-referenced interpretations.
Use of the maps available from the item response modeling approach not only allows the committees to interpret cut-offs in a criterion-referenced way, it also allows maintenance of similar standards from year to year by equating of the item response scales. This can be readily accomplished by using linking items on successive tests to keep the waves of data on the same scale hence the cut-offs set one year can be maintained in following years.
Discussion
A central tenet of the assessment reforms of recent years (“authentic”, “performance”, etc.), has been the WYTIWYG principle – “What you test is what you get”. This principle has
led the way for assessment reform at the state or district level nationwide. The assumption behind this principle is that assessment reforms will not only affect assessments per se, but these effects will trickle down into the curriculum and instruction that students receive in their daily work in classrooms. Hence, when one looks to the curricula that students are experiencing, one would expect to see such effects, and, in particular, one would expect to see these effects even more strongly in the cutting-edge curricula that central research agencies such as the US National Science Foundation (NSF) sponsor. Thus it is troubling to find that this does not seem to be the case: A review by NSF of new middle school science curricula (NSF, 1997) found only one where the assessment itself reflected the recent developments in assessment – for that one (the IEY Assessment System – Wilson, Roberts, Draney & Sloane, (2000)), it was found to be the case that the reformed assessment did indeed seem to have the desired sorts of effects (Wilson & Sloane, 2000), but for the remainder of the curricula no such effects can be possible, as the assessment reforms have not, in general, made it into them.
We have demonstrated a way in which large-scale assessments can be more carefully linked to what students are learning. The key here is the use of progress variables to provide a common conceptual framework across curricula. Variables developed and used in the ways we have described here can mediate between the level of detail that is present in the content of specific curricula and the necessarily more vague contents of standards documents. This idea of a “cross-walk between standards and assessments” has also been suggested by Eva Baker of CRESST (Land, 1997, p.6). These variables also create a “ conceptual basis” for relating a curriculum to standards documents, to other curricula, and to assessments that are not specifically related to that curriculum.
With the assessments to be used across curricula structured by progress variables, the problem of item development is lessened – ideas and contexts for assessment tasks may be adapted to serve multiple curricula that share progress variables. The cumulative nature of the curricula is expressed through (a) the increasing difficulty of assessments and (b) the increasing sophistication needed to gain higher scores using the assessment scoring guides. Having the same underlying structure makes clear to teachers, policy-makers, and parents what is the ultimate purpose of each instructional activity and each assessment, and also makes easier the diagnostic interpretation of student responses to the assessments.
The idea of a progress variable is not radically new it has grown out of the traditional approach to test content most tests have a “blueprint” or plan that assigns items to particular categories, and hence, justifies why certain items are there, and others aren’t. The concept of a progress variable goes beyond this by looking more deeply into why we use certain assessments when we do (i.e., by linking them to growth through the curriculum), and by calibrating the assessments with empirical information.
While the ideas inherent in the BEAR Assessment System are not unique, the combination of these particular ideas and techniques into a usable system does represent a new step in assessment development. The implications for this effort for other large-scale tests, for curricula, and for assessment reform on a broader level, need to be explored and tested through other related efforts. We hope our efforts and experiences will encourage increased discussion and experimentation of the use of state of the art assessment procedures across a broad range of contexts from classroom practice to large-scale assessments.
References
Adams, R. J., Wilson, M. & Wang, W-C. (1997). The multidimensional random coefficients multinomial logit model. Applied Psychological Measurement, 21, 1-23.
Black, P. , Harrison, C., Lee, C., Marshall, B., & Wiliam, D. (2003). Assessment for Learning.
London: Open University Press.
Claesgens, J., Scalise, K., Draney, K., Wilson, M., & Stacy, A. (2002). Perspectives of chemists: A framework to promote conceptual understanding of chemistry. Paper presented at the annual meeting of the American Educational Research Association, New Orleans.
Biggs, J. B. (1999). Teaching for Quality Learning at University. Buckingham: SRHE and Open University Press.
Biggs, J. B., Collis, K. F. (1982). Evaluating the Quality of Learning: The SOLO Taxonomy. New York: Academic Press.
Bloom, B. S. (Ed.). (1956). Taxonomy of educational objectives: The classification of educational goals: Handbook I, cognitive domain. New York; Toronto: Longmans, Green.
Briggs, D., Alonzo, A., Schwab, C., & Wilson, M. (in press). Diagnostic assessment with ordered multiple-choice items. Educational Assessment.
German PISA Consortium. (2004). PISA 2003: Ergebnisse des zweiten internationalen Vergleichs (PISA 2003 Results of the second international comparison). Münster: Waxmann.
Glaser, R. (1990). Testing and assessment: O tempora! O mores! Pittsburgh: LRDC, University of Pittsburgh.
Haladyna, T. M. (1994). Cognitive Taxonomies. In T. M. Haladyna, Developing and Validating Multiple-Choice Test Items (pp. 104-110). Hillsdale, NJ: Lawrence Erlbaum Associates.
Hoskens, M. & Wilson, M. (1999). StandardMap (computer program). University of California, Berkeley.
Kennedy, C.A., Wilson, M., & Draney, K. (2005). GradeMap 4.1 (computer program). BEAR Center: UC Berkeley, CA.
Land, R. (1997). Moving up to complex assessment systems. Evaluation Comment, 7(1), 1-21.
Linn, R. & Baker, E. (1996). Can performance-based student assessments be psychometrically sound? In J. B. Baron & D. P. Wolf (Eds.), Performance-based student assessment:
Challenges and possibilities. Ninety-fifth Yearbook of the National Society for the Study of Education. (pp. 84-103). Chicago: University of Chicago Press.
Masters, G. N., Adams, R. A., & Wilson, M. (1990). Charting student progress. In . T. Husen and T. N. Postlethwaite (Eds.), International encyclopedia of education: Research and studies.
Supplementary volume 2 (pp. 628–634). Oxford: Pergamon Press.
Minstrell, J. (1998, Oct.). Student thinking and related instruction: Creating a facet-based learning environment. Paper presented at the meeting of the Committee on Foundations of Assessment, Woods Hole, MA.
National Research Council. (1999). How People Learn: Brain, Mind, Experience, and School. J.
D. Bransford, A. L. Brown, & R. R. Cocking. Washington, DC: National Academy Press.
National Research Council. (2001). Knowing What Students Know: The science and design of educational assessment. J. Pellegrino, N. Chudowsky, & R. Glaser, (Eds.) Washington, DC:
National Academy Press.
National Science Foundation. (1997, February). Review of instructional materials for middle school science. Arlington, VA: Author.
OECD. (2005a). Learning for tomorrow’s world: First results from PISA 2003. Paris: OECD.
OECD. (2005b). PISA 2003 Technical Report. Paris: OECD.
Olson, D. R., & Torrance, N. (Eds.). (1996). Handbook of Education and Human Development:
New Models of Learning, Teaching and Schooling. Oxford: Blackwell.
Resnick, L. B., & Resnick, D. P. (1992). Assessing the thinking curriculum: New tools for educational reform. In B.R. Gifford and M.C. O'Connor (Eds.), Changing assessments (pp. 37 –76). Boston: Kluwer.
Roberts, L. (producer), & Sipusic, M. (director) (1999). Moderation in all things: A class act [Film]. (Available from the Berkeley Evaluation and Assessment Center, Graduate School of Education, University of California, Berkeley, Berkeley, CA 94720-1670).
Wilson, M. (1990). Measurement of developmental levels. In, T. Husen and T. N. Postlethwaite (Eds.), International encyclopedia of education: Research and studies. Supplementary volume 2 (pp. 628–634). Oxford: Pergamon Press.
Wilson, M. (Ed.). (2004a). Towards coherence between classroom assessment and accountability.
103rd Yearbook of the National Society for the Study of Education, Part II. Chicago: University of Chicago Press.
Wilson, M. (2004b). A perspective on current trends in assessment and accountability: Degrees of coherence. In, M. Wilson, (Ed.). Towards coherence between classroom assessment and accountability. 103rd Yearbook of the National Society for the Study of Education, Part II.
Chicago: University of Chicago Press.
Wilson, M. (2005). Constructing Measures: An Item Response Modeling Approach. Mahwah, NJ:
Erlbaum.
Wilson, M., De Boeck, P., & Carstensen, C. (in press). Explanatory item response models: A brief introduction. In E. Klieme (Ed.), Assessment of Competencies in Educational Contexts. New York: Huber & Huber.
Wilson, M., & Draney, K. (2002). A technique for setting standards and maintaining them over time. In S. Nishisato, Y. Baba, H. Bozdogan, & K. Kanefugi (Eds.), Measurement and multivariate analysis (Proceedings of the International Conference on Measurement and Multivariate Analysis, Banff, Canada, May 12-14, 2000), pp 325-332. Tokyo: Springer-Verlag.
Wilson M., & Draney, K. (2004). Some links between large-scale and classroom assessments: The case of the BEAR Assessment System. In, M. Wilson, (Ed.). Towards coherence between classroom assessment and accountability. 103rd Yearbook of the National Society for the Study of Education, Part II. Chicago: University of Chicago Press.
Wilson, M., & Draney, K. (2005). From principles to practice in assessment design: The BEAR Assessment System in a large-scale assessment context. BEAR Research Report, University of California, Berkeley.
Wilson, M., Roberts, L., Draney, K., & Sloane, K. (2000). SEPUP Assessment Resources Handbook. Berkeley, CA: Berkeley Evaluation and Assessment Research Center.
Wilson, M., & Scalise, K. (in press). Assessment to improve learning in higher education: The BEAR Assessment System. Higher Education.
Wilson, M., & Sloane, K. (2000). From principles to practice: An embedded assessment system.
Applied Measurement in Education, 13(2), 181-208.
Wolf, D. & Reardon, S. (1996). Access to excellence through new forms of student assessment.
In J. B. Baron & D. P. Wolf (Eds.), Performance-based student assessment: Challenges and possibilities. Ninety-fifth Yearbook of the National Society for the Study of Education. (Part I) (pp. 52-83). Chicago: University of Chicago Press.