內科學誌 2015:26:268-276
The Relationship Between Digital Vascular Function and Combination Hypertension Therapy
in Patients with Newly Diagnosed Hypertension
Chun-Chung Lin
1, Hsien-Jung Lo
1, Chung-Ming Tu
1, Wei-Quan Fang
2, and Ai-Hsien Li
11
Division of Cardiology, Far-Eastern Memorial Hospital, New Taipei City, Taiwan
2
Taiwan Clinical Trial Statistical Center, Training Center and Pharmacogenomics Laboratory, Taipei City, Taiwan
Abstract
Endothelial dysfunction plays a key role in cardiovascular diseases and hypertension is associated to endothelial dysfunction. Measuring digital vascular function through peripheral arterial tonometry is an innovative method to evaluate endothelial function. The aim of this study was to evaluate the changes in digital vascular function in hypertensive patients before and after anti-hypertension therapy. We recruited 54 newly diagnosed hypertensive patients and 40 normotensive participants. Among these 54 hypertensive patients, 29 received a complete 3 months combination anti-hypertension therapy with angiotensin-converting enzyme inhibitors (or angiotensin receptor antagonist) and calcium channel blockers. Their digital vascular function were evaluated through peripheral arterial tonometry before and after anti-hypertensive therapy and compared with the normotensive participants’ data. The percentage of endothelial dysfunction was nonsignifi- cantly higher (13% V.S 7.9%, P .34) in hypertensive group than in normotensive group. After combination anti- hypertensive therapy, the reactive hyperemia indices (RHIs) of the majority of the patients (65%) improved albeit nonsignificantly (mean RHI before therapy 2.07 +/- 0.39, mean RHI after therapy 2.03 +/- 0.79, P=
.825). However, the hyperemia ratio of 0.879 of the control arm was a significant predictor (P .0273 and 0.003 respectively) of the RHI response of after pharmacological therapy. The hypertensive patients showed a non- significant higher percentage of the endothelial dysfunction than did the normotensive participants. Combina- tion therapy did not significantly improve RHI. A hyperemia ratio of 0.879 of the control arm was a significant predictor of the response of RHI after pharmacological therapy. (J Intern Med Taiwan 2015; 26: 268-276)
Key Words: Endothelial function, Reactive hyperemia index, Hypertension, Combination therapy
Introduction
Endothelial dysfunction plays an impor- tant role in the pathogenesis of atherosclerosis and several cardiovascular diseases. Various techniques, such as flow-mediated dilatation, plethysmography,
pulse wave analysis and pulse contour analysis, have been developed for assessing vasomotor function.
1Peripheral arterial tonometry (PAT) (EndoPAT 2000; Itamar medical, Caesarel, Israel, Fig 1a) is one of the techniques that non-invasively evaluates the endothelial function by assessing the pulse wave
Reprint requests and correspondence:Dr. Ai-Hsien Li
Address:Division of Cardiology, Far-Eastern Memorial Hospital, New Taipei City, Taiwan, No. 21, Sec. 2, Nanya S. Rd., Banciao District, New Teipei City, 220, Taiwan
C. C. Lin, H. J. Lo, C. M. Tu, W. Q. Fang, and A. H. Li 270
treatment-naïve patients (mean age, 47.7 +/- 9.2 y) were enrolled in this study.
In addition, 40 normotensive participants (mean age 44.2 +/- 7.4 y) were recruited from the community as the control group for comparing the differences in the baseline digital vascular func- tion between the 2 groups. The normotensive par- ticipants had cardiovascular risk factors similar to those of the hypertensive patients namely obesity, smoking or dyslipidemia but without any systemic diseases.
Reactive Hyperemia Index Measurements
PAT was performed using the EndoPAT 2000 (Itarmar Medical Ltd., Caesrea, Israel; Figure 1a), which consists of bilateral probes for index fingers, a pressure cuff, and a computer. The probes were placed on bilateral index fingers and beat-to-beat plethysmographic data were recorded. A baseline measurement was recorded for 5min after acclima- tization for 10 min. Subsequently the test arm was compressed for 5 min by inflating the pressure cuff to 180-200mmHg or 50mmHg higher than the sys- tolic blood pressure of the brachial artery for gen- erating a transient ischemia of the index finger of the test arm. Then cuff deflation, a caused hyper- emia in the test index finger and PWA of bilateral index fingers was recorded for additional 5 min.
The hyperemia index was calculated as the ratio of average PWA recorded during 1 min (since 90-150 sec after cuff deflation) to the 3.5 min baseline PWA (figure 1b)
Protocol
Baseline measurements of the clinical car- diovascular risk factors, such as body weight and smoking history, of all participants were collected from their medical charts. Blood and urine tests were performed as a routine hypertension work – up for evaluating the levels of fasting sugar, creati- nine, and urinary microalbumin. The brachial-ankle
pulse wave velocity (baPWV) was measured as a vascular stiffness marker. The digital vascular func- tion was evaluated by using the EndoPAT-2000.
Furthermore, RHI, baseline pulse amplitude, hyper- emia amplitude, and hyperemia ratio of bilateral arms were analyzed. All of the participants were requested to refrain from coffee and alcohol intake at least one night prior to the tests, but regular meals were allowed. Female participants in the menstrua- tion period were evaluated after the period was com- pleted. The baseline digital vascular function in the hypertensive patients was measured before initiating medical treatment. After completing clinical evalu- ations, the hypertensive patients were prescribed a fixed dose combination of ACEI and CCB (Amtrel, benzapril 10 mg + amlodipine 5 mg, Tsh Biopharm, Taiwan). If the patients were unable to tolerate A+C combination therapy because of such side effects as dry cough, another fixed dose of combination of ARB-CCB (Exforge, valsartan 80 mg + amlodip- ine 5 mg, Novartis) was prescribed. The medication doses were adjusted to achieve the blood pressure goal (the systolic and diastolic blood pressures <
140 mmHg, 90 mmHg, respectively). After at least 3 mo of fixed dose combination therapy either ACEI- CCB or ARB-CCB, the hypertensive patients again underwent baPWV and digital vascular function tests. During the study period, other anti-hyperten- sive medications were not allowed; however statins were prescribed at the discretion of the physician.
All participants provided written informed consent and this study was approved by the Institu- tional Review Board of Far-Eastern Memorial Hos- pital.
Statistical Analyses
All analyses were performed using SAS soft- ware Version 9.3 (SAS Institute Inc., Cary, NC, USA). The Student’ t-test was used for comparing continuous variables, and the chi-square or Fisher’
exact tests were used for categorical variables. Uni-
variate regression analysis was used for exploring the association between RHI and other factors. P value less than.05 was considered statistically sig- nificant. All data are represented as means +/- (stan- dard deviation) (+/- SD) unless otherwise indicated.
Result
The baseline demographic characteristics and vascular parameters of the 2 groups (hypertensive and normotensive) are summarized in Tables 1 and 2. In total, 54 hypertensive patients (average age, 47.7 +/- 9.2 y) were enrolled, however, for 2 patients, the noise to signal ratio for the raw PAT data was high, these patients were excluded from the analysis.
Therefore, the baseline digital vascular functions of the remaining 52 hypertensive patients were ana- lyzed. 40 normotensive participants were enrolled
and raw PAT data were lost in 2 participants. There- fore, the data of the remaining 38 normotensive par- ticipants were analyzed.
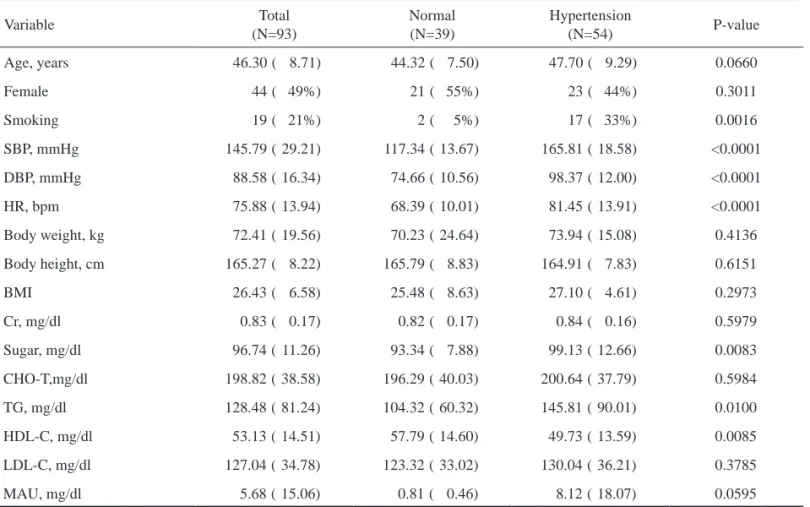
Among the hypertensive patients, 29 (55.7%) tolerated our target ACEI-CCB or ARB-CCB com- bination therapy well and received at least 3 months of this therapy. Among these 29 subjects, 23 (79%) received Amtrel with an average dose of 1.17 tablets per day, and 6 (21%) received Exforge with average dose of 1 tablet per day. The baseline characteris- tics of the normotensive and hypertensive groups are presented in Table 1. Compared with the normo- tensive participants, the hypertensive patients had significantly high systolic and diastolic blood pres- sure, heart rate, blood sugar, and blood triglycerides levels but low high-density lipoprotein (HDL) level.
The baseline parameters of the digital vascu-
Table 1. Baseline characteristics of the normotensive and hypertensive groups
Variable Total
(N=93)
Normal (N=39)
Hypertension
(N=54) P-value
Age, years 46.30 ( 8.71) 44.32 ( 7.50) 47.70 ( 9.29) 0.0660
Female 44 ( 49%) 21 ( 55%) 23 ( 44%) 0.3011
Smoking 19 ( 21%) 2 ( 5%) 17 ( 33%) 0.0016
SBP, mmHg 145.79 ( 29.21) 117.34 ( 13.67) 165.81 ( 18.58) <0.0001
DBP, mmHg 88.58 ( 16.34) 74.66 ( 10.56) 98.37 ( 12.00) <0.0001
HR, bpm 75.88 ( 13.94) 68.39 ( 10.01) 81.45 ( 13.91) <0.0001
Body weight, kg 72.41 ( 19.56) 70.23 ( 24.64) 73.94 ( 15.08) 0.4136
Body height, cm 165.27 ( 8.22) 165.79 ( 8.83) 164.91 ( 7.83) 0.6151
BMI 26.43 ( 6.58) 25.48 ( 8.63) 27.10 ( 4.61) 0.2973
Cr, mg/dl 0.83 ( 0.17) 0.82 ( 0.17) 0.84 ( 0.16) 0.5979
Sugar, mg/dl 96.74 ( 11.26) 93.34 ( 7.88) 99.13 ( 12.66) 0.0083
CHO-T,mg/dl 198.82 ( 38.58) 196.29 ( 40.03) 200.64 ( 37.79) 0.5984
TG, mg/dl 128.48 ( 81.24) 104.32 ( 60.32) 145.81 ( 90.01) 0.0100
HDL-C, mg/dl 53.13 ( 14.51) 57.79 ( 14.60) 49.73 ( 13.59) 0.0085
LDL-C, mg/dl 127.04 ( 34.78) 123.32 ( 33.02) 130.04 ( 36.21) 0.3785
MAU, mg/dl 5.68 ( 15.06) 0.81 ( 0.46) 8.12 ( 18.07) 0.0595
Continuous parameters are summarized as means (standard deviations)
SBP, systolic blood pressure; DBP, diastolic blood pressure; HR, heart rate per min; BMI, body mass index; Cr, creatinine; CHO-T, blood total cholesterol; TG, triglyceride; HDL-C, blood high density lipoprotein; LDL-L, blood low density lipoprotein; MAU, microalbuminuria.
C. C. Lin, H. J. Lo, C. M. Tu, W. Q. Fang, and A. H. Li 272
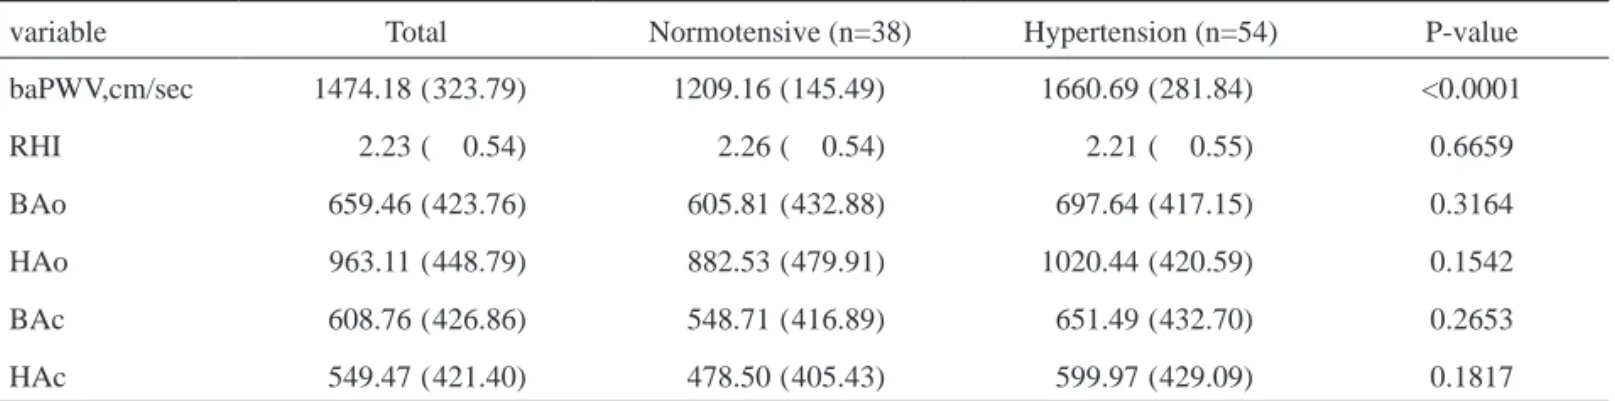
lar function and vascular stiffness for both groups are presented in Table 2. A higher percentage (13%, 7/54) of abnormal RHI ( < 1.67, quote reference) and a lower mean RHI (2.21 +/- 0.55) were observed in the hypertensive patients compared with the nor- motensive participants (7.9%, 3/38, mean RHI, 2.26 +/- 0.54, respectively). However, the difference was nonsignificant (p = .34 Fisher’ exact test). On the other hand, baPWV was significantly high in the hypertensive group (p < 0.001). The differences in the parameters of digital vascular function including the baseline and hyperemia amplitudes between the 2 groups were nonsignificant. However, for all study participants, in contrast to the hyperemic response (mean hyperemia ratio 1.75, mean hyperemia ampli- tude 963) in the occluded arm after cuff deflation, a relative vasoconstrictive response (mean hyper- emia ratio 0.90, mean hyperemia amplitude 549) was recorded in the control arm after cuff defla- tion (Table 3). Both the hyperemia ratio and hyper- emia amplitude were significantly high for test arm (p < .0001).
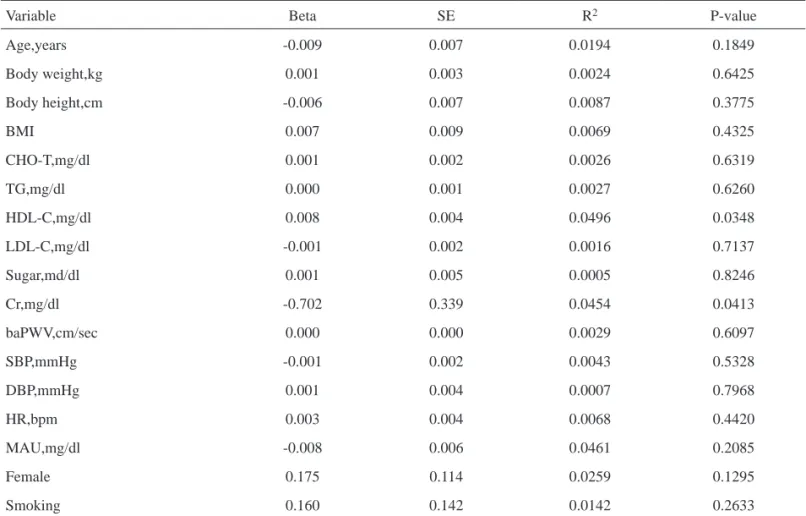
The univariate regression analysis of the base- line cardiovascular risk factors for all participants is presented in Table 4. The results showed that RHI was positively correlated with an increased HDL level, and inversely correlated with an increased level of blood creatinine. Most cardiovascular risk factors, such as blood pressure, body weight, blood sugar and smoking, were nonsignificantly corre- lated with RHI.
RHI Changes after Combination Therapy
The changes in the parameters of vascular stiff- ness and digital vascular function after the 3 months combination therapy in 29 hypertensive patients are presented in Table 5 and Figure 2. RHI increased in 19/29 (65%) and decreased in 10/29 (34.5%) hyper- tensive patients; however the difference in the mean RHI was nonsignificant (mean RHI, 2.07 v.s 2.03;
p .825). Moreover, the differences between the 2
groups for the parameters of digital vascular func- tion, including the baseline and hyperemia ampli- tudes were nonsignificant except for baPWV, which
Table 2. Parameters of vascular physiology in the normotensive and hypertensive groups
variable Total Normotensive (n=38) Hypertension (n=54) P-value
baPWV,cm/sec 1474.18 ( 323.79) 1209.16 ( 145.49) 1660.69 ( 281.84) <0.0001
RHI 2.23 ( 0.54) 2.26 ( 0.54) 2.21 ( 0.55) 0.6659
BAo 659.46 ( 423.76) 605.81 ( 432.88) 697.64 ( 417.15) 0.3164
HAo 963.11 ( 448.79) 882.53 ( 479.91) 1020.44 ( 420.59) 0.1542
BAc 608.76 ( 426.86) 548.71 ( 416.89) 651.49 ( 432.70) 0.2653
HAc 549.47 ( 421.40) 478.50 ( 405.43) 599.97 ( 429.09) 0.1817
Continuous parameters are summarized as mean (standard deviation)
baPWV, brachial-ankle pulse wave velocity; RHI, reactive hyperemia index; BAo, baseline amplitude of occluded arm; HAo, hyperemia amplitude of occluded arm; BAc, baseline amplitude of control arm; HAC, hyperemia amplitude of control arm
Table 3. Different vascular changes between the occluded arm and control arm
Variable Occluded arm Control arm P-value
Hyperemia ratio 1.75 ( 0.69) 0.90 ( 0.23) <0.0001
Hyperemia amplitude 963.11 ( 448.79) 549.47 ( 421.40) <0.0001
Continuous parameters are summarized as mean (standard deviation)
Footnote: Hyperemia ratio means HAo/BAo in occluded arm, HAc/BAc in control arm. HAo, hyperemia amplitude of occluded arm;
BAo, baseline amplitude of occluded arm; HAc, hyperemia amplitude of control arm; BAc, baseline amplitude of control arm
Table 5. Changes of vascular parameters after combination therapy in 29 cases with hypertension
Variable Hypertension (pre-treatment) Hypertension (post-treatment) P-value
SBP,mmHG 166.38 ( 17.53) 131.38 ( 10.85) <0.0001
DBP,mmHg 99.41 ( 10.22) 81.14 ( 7.75) <0.0001
HR,bpm 82.43 ( 14.24) 81.00 ( 15.10) 0.7171
baPWV,cm/sec 1676.17 (271.93) 1472.66 (213.77) 0.0025
RHI 2.07 ( 0.39) 2.03 ( 0.79) 0.8251
BAo 761.16 (487.84) 831.26 (371.09) 0.5405
HAo 1064.97 (477.19) 1095.72 (432.23) 0.7980
BAc 746.83 (499.01) 837.11 (400.74) 0.4507
HAc 700.32 (488.40) 765.94 (430.60) 0.5895
Continuous parameters are summarized as mean (standard deviation).
Footnote: SBP, systolic blood pressure; DBP, diastolic blood pressure; HR, heart rate; baPWV, brachial-ankle pulse wave velocity;
RHI, reactive hyperemia index; BAo, baseline amplitude of occluded arm; HAo, hyperemia amplitude of occluded arm; BAc, baseline amplitude of control arm; HAc, hyperemia amplitude of control arm.
Table 4. Univariate regression analysis of reactive hyperemia index
Variable Beta SE R2 P-value
Age,years -0.009 0.007 0.0194 0.1849
Body weight,kg 0.001 0.003 0.0024 0.6425
Body height,cm -0.006 0.007 0.0087 0.3775
BMI 0.007 0.009 0.0069 0.4325
CHO-T,mg/dl 0.001 0.002 0.0026 0.6319
TG,mg/dl 0.000 0.001 0.0027 0.6260
HDL-C,mg/dl 0.008 0.004 0.0496 0.0348
LDL-C,mg/dl -0.001 0.002 0.0016 0.7137
Sugar,md/dl 0.001 0.005 0.0005 0.8246
Cr,mg/dl -0.702 0.339 0.0454 0.0413
baPWV,cm/sec 0.000 0.000 0.0029 0.6097
SBP,mmHg -0.001 0.002 0.0043 0.5328
DBP,mmHg 0.001 0.004 0.0007 0.7968
HR,bpm 0.003 0.004 0.0068 0.4420
MAU,mg/dl -0.008 0.006 0.0461 0.2085
Female 0.175 0.114 0.0259 0.1295
Smoking 0.160 0.142 0.0142 0.2633
BMI, body mass index, CHO-T, blood total cholesterol; TG, triglyceride; HDL-C, blood high density lipoprotein; LDL-C, blood low density lipoprotein; Cr, creatinine; BaPWV, brachial-ankle pulse wave velocity; SBP, systolic blood pressure; DBP, diastolic blood pressure; HR, heart rate per minute; MAU, microalbuminuria.
thelial function and primarily designed to replace the highly technical FMD method, the PAT system only measured the part associated with the endothe- lial-dependent vasodilatation of the occluded arm.
Compared with the conventional methods, PAT has been shown to be moderately sensitive .
9,10Second, the nonsignificant differences in the endothelial function between 2 groups may be caused by the relatively small sample size and relative early stage of cardiovascular disease. Third, we suspect that vessels of different sizes maybe not homogeneously involved during the process of endothelial dysfunc- tion, resulting in disparities between the results obtained through endoPAT and FMD methods.
11,12,13Compared with the hyperemic changes in the occluded arm after brachial cuff deflation, a rela- tive vasoconstriction was recorded in the control arm after cuff deflation. Another novel finding of this study was that the hyperemia ratio of < 0.879 of the control arm could predict the RHI response after pharmacological therapy. These 2 novel findings imply an intact endothelial function including both vessel dilatation and vessel constriction. Additional studies are required for determining the exact physi- ological importance and the underlying mechanism.
Conclusion
The newly diagnosed and treatment-naïve hypertensive patients had a relatively high per- centage of low RHI than that observed in the nor- motensive participants; however, the difference was nonsignificant. Although the majority of the patients who received combination therapy showed improved RHI, the difference between the 2 group was nonsignificant. However, the hyperemia ratio of the control arm of 0.879 was a significant predic- tor of the RHI response after pharmacological treat- ment.
References
1. Patvardhan EA, Heffernan KS, Ruan JM, et al. Assessment of vascular endothelial function with peripheral arterial tonom- etry. Cardiol Rev 2010; 18: 20-8.
2. Panza JA, Quyyumi AA, Brush JE Jr, et al. Abnormal endo- thelium dependent vascular relaxation in patients with essen- tial hypertension. N Engl J Med 1990; 323: 22-7.
3. Iwatsubo H, Nagano M, Sakai T, et al. Converting Enzyme inhibitor improves forearm reactive hyperemia in Essential Hypertension. Hypertension 1997; 29: 286-90.
4. Siragy HM. Improving vascular function in hypertension:
potential benefits of combination therapy with amlodipine and renin-angiotensin-aldosterone system blockers. J Hyper- tens 2010; 28: 2-8
5. Vitale C, Marazzi G, Iellamo F, et al. Effects of nebivolol or irbesartan in combination with hydrochlorothiazide on vas- cular functions in newly-diagnosed hypertensive patients: the NINFE (Nebivololo, Irbesartan Nella Funzione Endoteliale) study. Int J Cardiol 2012; 155: 279-84.
6. Kelly AS, Gonzalez-Campoy JM, Rudser KD, et al. Carvedilol- lisinopril combination therapy and endothelial function in obese individuals with hypertension. J Clin Hypertens (Green- wich) 2012; 14, 85-91.
7. Dharmashankar K, Widlansky ME. Vascular endothelial func- tion and hypertension: insights and directions. Curr Hyper- tens Rep 2010; 12: 448-55.
8. Hamburg NM, Keyes MJ, Larson MG, et al. Cross-sectional relations of digital vascular function to cardiovascular risk factors in Framingham Heart study. Circulation 2008; 117:
2467-74.
9. Bonetti PO, Pumper GM, Higano ST, et al. Noninvasive iden- tification of patients with early coronary atherosclerosis by assessment of digital reactive hyperemia. J Am Coll Cardiol 2004; 44: 2137-41.
10. Leeson P, Thorne S, Donald A, et al. Non-invasive measure- ment of endothelial function: effect on brachial artery dilata- tion of graded endothelial dependent and independent stimuli.
Heart 1997; 78: 22-7.
11. Celermajer DS. Reliable endothelial function testing: at our fingertips? Circulation 2008; 117: 2428-30.
12. Benjamin EJ, Larson MG, Keyes MJ, et al. Clinical correlates and heritability of flow-mediated dilation in the community:
the Framingham Heart Study. Circulation 2004; 109: 613-9.
13. Onkelinx S, Cornelissen V, Goetschalckx K, et al. Reproduc- ibility of different methods to measure the endothelial func- tion. Vasc Med 2012; 17: 79-84.
C. C. Lin, H. J. Lo, C. M. Tu, W. Q. Fang, and A. H. Li 276
初診斷之高血壓患者指尖血管功能與 複合式藥物治療之關係
林俊忠1 羅顯榮1 杜宗明1 方偉泉2 李愛先1
新北市板橋區亞東紀念醫院 1心臟血管中心
2台北市台灣臨床生物統計中心
摘 要