Chapter 3 DIVINE - 3D Interactive
Visualization Environment for Debugging
DIVINE concentrates on the integration of the visualization display and the debugger tool. It provides a 3D graphic environment for users to get debugging information without tediously and repeating inputting debugging commands and to visualize the abstract information of data structure in a meaningful display. And our long-term goal is to construct DIVINE in virtual reality. In virtual reality environment, users can navigate in the 3D environment, grab objects and interact with objects like in a real world. Users wear a head mounted display in head and data gloves in hands.
A tracking system catches users’ movement. Extend the debugger environment to 3D can improve the scalability because of the better navigability. Users can visualize the data structures or variable in the 3D environment with the head mounted display, interact with the 3D objects with the data glove, and navigate in the 3D environment with the tracking system that catches users’ movement. It can address the limitation of 2D display. It is more easily for users to visualize data structure. That is why we create a 3D environment for debugging.
Because the lack of the budget, we do not have a tracking system. Now, we have a data glove that is produced by the 5DT (Fifth Dimension Technologies) company.
We compromisingly constructed the current version of DIVINE to approach our goal.
The user interface of DIVINE will be discussed in Section 3.1. DIVINE provides different interaction methods to manipulate 3D objects including the data glove and the keyboard. Interactions with the data glove in DIVINE will be discussed in Section
3.2 and interactions with the keyboard will be discussed in Section 3.3. Then we use an example to demo DIVINE and show them in Section 3.4.
3.1 User interface of DIVINE
DIVINE consists of two parts: the debugger and the visualization subsystem. The debugger provides a window-based user interface for users to debug a program.
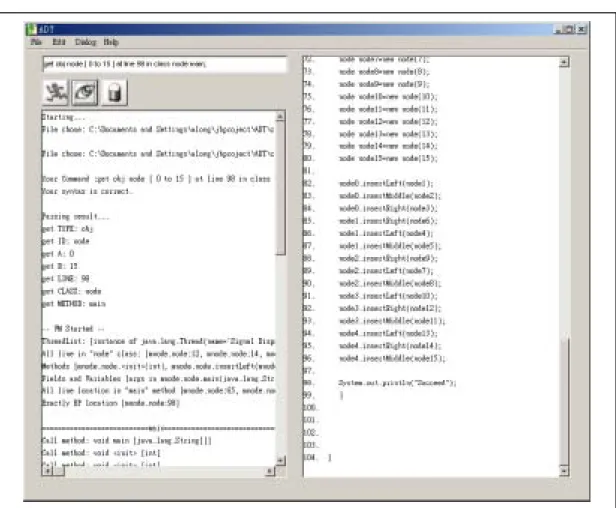
Currently, the debugger is designed for Java programs. The debugger gathers the debugging information from JPDA (Java Platform Debugger Architecture) and sends them to the visualization subsystem through Winsock (The socket API under window platform). And the visualization subsystem gets the debugging information from the debugger and uses a meaningful visualization to represent the abstract data structure in the 3D graphic environment. The user interface of the debugger is shown in Figure 8.
Figure 8 - The user interface of the debugger.
Users can load a Java program and set the breakpoint at a line of the source code in this window-based debugger. When users enter a variable name such as a reference and press the button marked “VISUALIZE,” the visualization subsystem will be executed. The visualization subsystem will create a new window that is the 3D graphic environment and display the debugging information in the 3D graphic environment. A screen shot of the 3D graphic environment is shown in Figure 9.
DIVINE focuses on the visualization of linked-list data structure. We use the traditional display method to display the linked-list structure, “boxes and arrows”, but we show them in a 3D graphic environment. In order to make the visualization easily understood, DIVINE uses some graphic objects to represent the debugging information. The details of the graphic objects will be discussed in Section3.1.1. In the environment, there are some textual information areas to help users. The textual information areas will be discussed in Section 3.1.2.
Figure 9– A screen shot of the three-dimension graphic environment.
3.1.1 Graphic objects
In DIVINE, there are two objects including cubes and balls. A cube represents a node of linked-list in this system. It represents a linked-list node whose information is already sent from the debugger. A ball represents a link in this system, which often represents a pointer variable or a reference1. When users want to expand a link, the visualization subsystem will send a request command to the debugger and wait for the information. If a pointer points to NULL, it will not be represented as a ball. It will be represented as a “null” text because the null pointer can not be expanded. A line represents the relationship between two linked-list nodes. If there is a node or a link is drawn in red color and blinked, the node or the link is selected. Users can interact with this selected node or link.
3.1.2 Textual information areas
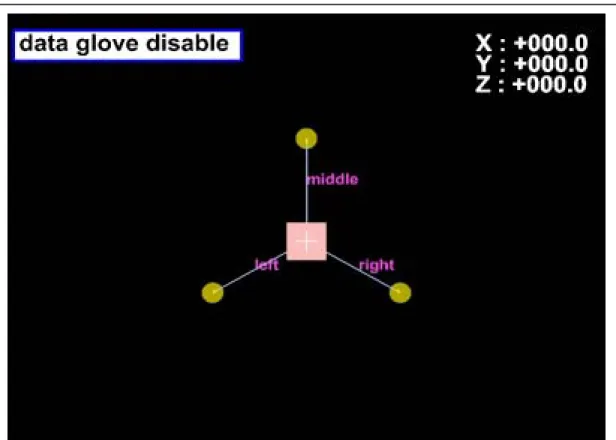
In the top left of the 3D graphic environment, a text label shows the current interaction mode. There are three modes in this system including disabled mode, browsing mode, and dragging object mode. Users can press the “F1” key to change to the disabled mode, the “F2” key to change to the browsing mode, and the “F3” key to change to the dragging object mode. The disabled mode is the initial mode. In this mode, the data glove is disabled. Users can use the keyboard or check the source code without taking off the data glove. The browsing mode is the mode that is used most.
In this mode, users can move the camera to see what they want to see and select a specific object from nodes or links. The dragging object mode is designed for users to change the visualization layout manually. All of the objects in the 3D graphic environment can be moved. Users can design their own layout depending on their need.
1 In Java, there is no pointer.
In the top right of the display, there are coordinates for x-axis, y-axis, and z-axis.
It represents the current coordinates of the camera. It helps users know where they are, so that users do not get lost in the 3D graphic environment. In the bottom of the display, there is the debugging information window. Users can get the complete debugging information of a linked-list node. There is a dotted line that connects to the node and the window.
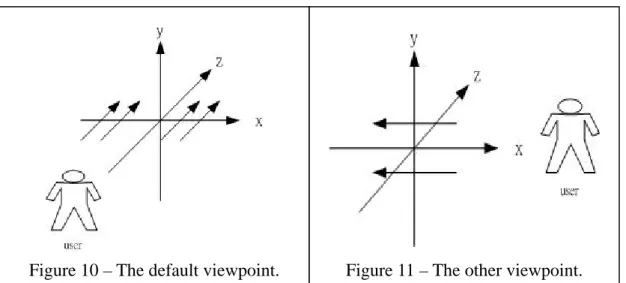
Since this is a 3D graphic environment, users can press the “F6” key to change the viewpoint to see the 3D objects. There are two viewpoints for users to browse the objects in the 3D graphic environment. Default viewpoint is located at a position with positive z-axis and face towards to negative z-axis as in Figure 10. The other viewpoint is located at a position with positive x-axis and face towards to negative x-axis as in Figure 11.
3.2 Interactions with the data glove in DIVINE
In this section, we will discuss the data glove we have. The details of the data glove we have will be discussed in Section 3.2.1. There are some limitations of the data glove we have. Because there is only one sensor for a finger, we only can measure a finger that is flexural or straight. We can not get the more accurate measurement to simulate a human’s hand. There is no tracking system to catch the
Figure 10 – The default viewpoint. Figure 11 – The other viewpoint.
data glove movement in the 3D environment that users can not get the object and can not browse in the 3D environment like in the real world. DIVINE provides another approaches to addressing the problem. DIVINE reads data glove gestures to select objects, browse, and drag objects. The details of gestures for selecting objects will be discussed in Section 3.2.2, the gestures for browsing will be discussed in Section 3.2.3, and the gestures for dragging objects will be discussed in Section 3.2.4.
3.2.1 Data glove
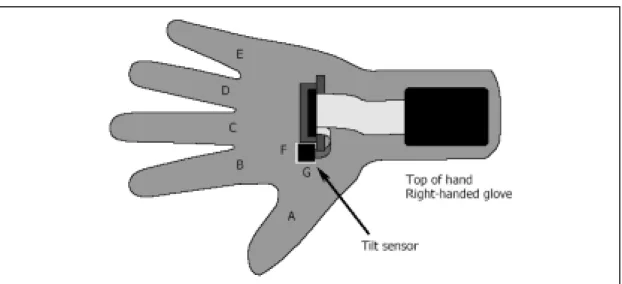
The data glove we have is 5DT Data Glove 5 that is produced by the 5DT (Fifth Dimension Technologies) company. The data glove measures the flexure of fingers and orientation (pitch and roll) of a user’s palm. There are seven sensors in the data glove including five for fingers flexure and two for palm orientation. The positions of sensors in the data glove are shown as in Figure 12.
In order to get the new information of users’ hand, we call the function to get the new sensors information.
void fdGetSensorRawAll(fdGlove *pFG, unsigned short *pData);
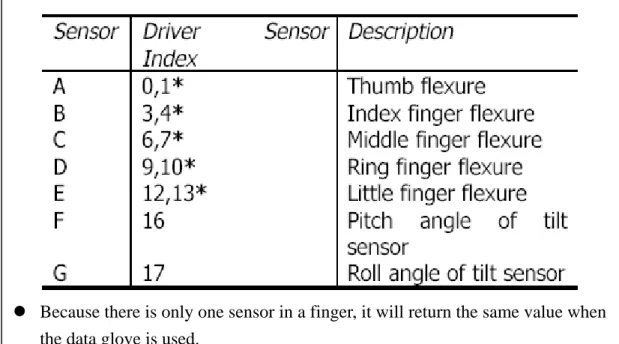
This function gets the new sensors information and writes them into pData that is an unsigned short array with 18 elements. The value of each array element is shown in
Figure 12 - The positions of sensors in the data
Figure 13. By getting the new information, we can determine which finger is flexural or straight, where the palm rolls to left or right, or where the palm pitches to up or down.
3.2.2 Gestures of the data glove for selecting objects
Because the limitation of the data glove we have, DIVINE provides two alternative ways to address the selecting object problem. A selected object will blink in the screen. Users can switch selected object by the gesture describes in this section.
We have an order between objects. The switch between selected object follows the order: forward and backward. So, the gesture to switch selected object forward is in Figure 14. The gesture to switch selected object backward is in Figure 15.
3.2.3 Gestures of the data glove for browsing
To browse in the 3D environment, we use the following gesture.
Roll hand right means moving the camera to right.
Roll hand left means moving the camera to left.
Because there is only one sensor in a finger, it will return the same value when the data glove is used.
Figure 13 - The mappings of sensors and the pData element.
Pitch hand up means moving the camera up.
Pitch hand down means moving the camera down.
One finger point (index) as in Figure 16 means moving the camera toward to the direction into screen.
Fist as in Figure 17 and pitch hand up means moving the camera away from the screen.
3.2.4 Gestures of the data glove for dragging objects
In dragging object mode, we can place a graphic object to different location, allowing users to change the layout of data structure. Once an object is selected, users can use the same gesture in browsing mode to place the graphic objects.
Roll hand right means moving the selected object to right.
Figure 14 – The two fingers point gesture (index and middle).
Figure 15 – The three fingers point gesture (index, middle and ring).
Figure 16 – The one finger point gesture (index).
Figure 17 – The fist gesture.
Roll hand left means moving the selected object to left.
Pitch hand up means moving the selected object up.
Pitch hand down means moving the selected object down.
One finger point (index) means moving the selected object toward to the direction into screen.
Fist and pitch hand up means moving the selected object away from the screen.
3.3 Interactions with the keyboard in DIVINE
There are seven keys we have defined in DIVINE. The “F1”, “F2” and “F3” keys are designed for changing mode. The “F4” key is designed to reset the camera to the origin (0,0,0). If users get lost in the 3D graphic environment, users can press the
“F4” key to come back to the origin. The “F5” key is designed to redraw the objects.
In DIVINE, users can drag objects to the position that users want. If users make a mistake or do not like the new layout, users can press the “F5” key to recover the objects. The “F6” key is designed for viewpoint transformation. It is used to change the viewpoint to visualize the objects. The “space” key is designed to interact with the selected object. If the selected object is a link, the visualization subsystem sends the request command to the debugger. Then, the visualization subsystem waits for the return information sent form the debugger. Once the information is received, we use the information to expand the link to a node. If the selected object is a node and the debugging information of this node is not shown in the bottom of screen, the visualization subsystem will create a new window to show the debugging information in the bottom of screen. On the contrary, if the debugging information window is already existed in the bottom of screen, it will be hidden. The list of keys is shown as Figure 18.
3.4 Example
In this section, we use an example to demo DIVINE. We display the example in tree structure shown as Figure 19.
When users enter a variable name such as a reference and press the button marked “VISUALIZE” in the debugger, the visualization subsystem is executed. The debugger sends the root node information (node 0) to the visualization subsystem.
Figure 19 – An example in tree structure.
Key Behavior F1 Change to disabled mode.
F2 Change to browsing mode.
F3 Change to dragging object mode.
F4 Move the camera to origin (0,0,0).
F5 Redraw the object in system default display.
F6 Transform the viewpoint
Space If the selected object is a node, show or hide the node information.
If the selected object is a link, expand the link to a node.
Figure 18 – The behaviors of keyboard keys.
And then the visualization subsystem displays the information in the 3D graphic environment. The 3D graphic environment is shown as Figure 20.
The initial mode is in the disabled mode. In this mode, the data glove will not get users’ gestures and movement. The camera is set at the origin. The root node information is already sent from the debugger, so the visualization subsystem represents the root node as a cube. According to the tree structure shown as Figure 19, there are three links that point from the root node. The visualization subsystem uses a ball to represent a link, so there are three balls that connect to the cube. The line between a node and a link is marked with the field name of the link. Because it is in the initial state, there is no selected object.
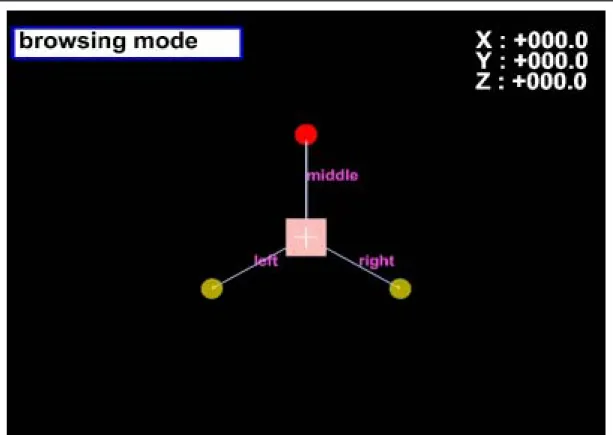
Users can press the “F2” key to change to the browsing mode. A screen shot of the browsing mode is shown as Figure 21. In the browsing mode, the data glove is ready to get users’ gestures or movement. There is an object drawn in red color and blinked. It represents the object is selected. Users can interact with this selected
Figure 20 – The initiation of 3D graphic environment.
object.
Because the limitation of the data glove, DIVINE provides two ways to select objects: forward and backward. The change of selecting objects is shown as Figure 22.
Users can use two finger point gesture to forward select the objects. The initial state is shown as Figure 22.1. When using the two finger point gesture, the selected object will change to next link shown as Figure 22.2. If users still keep the two finger point gesture, the selected object will change to next object shown as Figure 22.3 and 22.4.
Then the selected object returns to the initial state that shown as Figure 22.1. It will change in the loop of (1)->(2)->(3)->(4)->(1). Another way is using the three finger point gesture to backward select the objects. The initial state is shown as Figure 22.1.
When using the three finger point gesture, the selected object will change to the node shown as Finger 22.4. If users still keep the three finger point gesture, the selected object will change to next object shown as Figure 22.3 and 22.2. Then the selected object returns to the initial state that shown as Figure 22.1. It will change in the loop
Figure 21 – The screen shot of browsing mode.
of (1)->(4)->(3)->(2)->(1). Users can use these two gestures to select objects.
Users can press the “F6” key to transform the viewpoint to see the 3D objects.
The different viewpoint is shown in Figure 23.
(1) (2)
(3) (4) Figure 22 - The change of selecting objects.
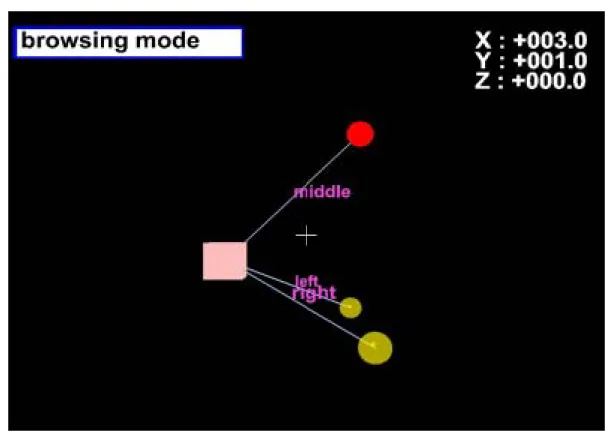
In the browsing mode, users can use the data glove to move the camera. Users can move the camera to browse in the 3D graphic environment. The movement of camera is shown as Figure 24. In Figure 24.1, users pitch the hand up and the camera will be moved up. In Figure 24.2, users pitch the hand down and the camera will be moved down. In Figure 24.3, users roll the hand left and the camera will be moved to left. In Figure 24.4, users roll the hand right and the camera will be moved to right. In Figure 24.5, users use the one finger point gesture and the camera will be moved into the screen. In Figure 24.6, users use the fist gesture and pitch the hand up and the camera will be moved away from the screen.
Figure 23 – The different viewpoint of 3D objects.
Users can press the “F3” key to change to the dragging object mode. In the dragging object mode, users can use the data glove to move the selected object. Users can drag the selected object to place a new display layout. The movement of the selected object is shown as Figure 25. In Figure 25.1, users pitch the hand up and the selected object will be moved up. In Figure 25.2, users pitch the hand down and the
(1) Move the camera up. (2) Move the camera down.
(3) Move the camera to left. (4) Move the camera to right.
(5) Move the camera into the screen. (6) Move the camera away from the screen.
Figure 24 –The movement of camera.
selected object will be moved down. In Figure 25.3, users roll the hand left and the selected object will be moved to left. In Figure 25.4, users roll the hand right and the selected object will be moved to right. In Figure 25.5, users user the one finger point gesture and the selected object will be moved into the screen. In Figure 25.6, users use the fist gesture and pitch the hand up and the selected object will be moved away from the screen.
(1) Drag the selected object up. (2) Drag the selected object down.
(3) Drag the selected object to left. (4) Drag the selected object to right.
(5) Drag the selected object into the screen.(6) Drag the selected object away the screen.
Figure 25 –The movement of the selected object.
Users can press the “space” key to interact with the selected object. If the selected object is a node, it will create or hide the debugging information window.
Users can get the details of debugging information in the window. The debugging information window is shown in Figure 26. If users can press the “space” key again, the window will be hidden.
If the selected object is a link, the visualization subsystem sends a request Figure 26 – The debugging information window.
(1) (2) Figure 27 –Expand a link to a node.
command to the debugger. Then, the visualization subsystem waits for the return information sent form the debugger. Once the information is received, we use the information to expand the link to a node. The screen shot after expanding the link is shown in Figure 27. The screen shot in the default viewpoint is shown in Figure 27.1 and in the other viewpoint is shown in Figure 27.2. And then users can expand the links to nodes depending on their need. The same level node will be drawn in the same color. The visualization of the second level of this tree structure is shown in Figure 28. The screen shot in the default viewpoint is shown in Figure 28.1 and in the other viewpoint is shown in Figure 28.2.
Finally, we can expand the tree structure and the visualization of the tree (1) (2)
Figure 28 –The second level of tree structure.
(1) (2) Figure 29–The expanding of the tree structure.
structure is shown in Figure 29. The screen shot in the default viewpoint is shown in Figure 29.1 and in the other viewpoint is shown in Figure 29.2.