國立交通大學
網路工程研究所
碩士論文
GardenTalk:提供人、景觀與環境互動的物聯網管理平台 GardenTalk: A Management Platform for Interaction between Humans,
Landscapes and the Environment
研 究 生:徐大賢 指導教授:林一平 教授
中華民國 109 年 7 月
GardenTalk:提供人、景觀與環境互動的物聯網管理平台
GardenTalk: A Management Platform for Interaction between Humans, Landscapes and the Environment
研 究 生:徐大賢 Student:Ta-Hsien Hsu
指導教授:林一平 教授 Advisor:Yi-Bing Lin
國 立 交 通 大 學 網 路 工 程 研 究 所
碩 士 論 文
A Thesis
Submitted to Institute of Network Engineering College of Computer Science
National Chiao Tung University in partial Fulfillment of the Requirements
for the Degree of Master
in
Computer Science July 2020
Hsinchu, Taiwan, Republic of China
中華民國 109 年 7 月
I
GardenTalk:提供人、景觀與環境互動的物聯網管理平台
學生:徐大賢 指導教授:林一平 教授
國立交通大學網路工程研究所碩士 班
摘 要
隨者物聯網的蓬勃發展,物聯網技術在許多領域提供了更好的方法解決問題,包括 智慧家庭、智慧農業等。然而目前在景觀的領域中尚未有人利用物聯網的技術協助解 決現有問題。GardenTalk 是一套適用於綠地空間的物聯網裝置管理系統,透過這個系 統我們可以輕鬆打造一個能跟使用者及環境互動的智慧公園。GardenTalk 的功用包 括,讓管理者可以輕鬆完成原本的工作,能讓環境可以避免不必要的資源浪費,提供 使用者更多元的方式與空間進行互動。未來 GardenTalk 可以在智慧城市的發展中扮 演承先啟後的角色,利用 GardenTalk 管理的綠地就像是一個點,當許多的點構成一個 面,就成了智慧城市的雛型。本論文說明了 GardenTalk 的設計及相關應用,並將其實 際運用在交通大學及相關場域中。
關鍵字:物聯網、感測器、智慧公園、互動景觀、智慧城市
II
GardenTalk: A Management Platform for Interaction between Humans, Landscapes and the Environment
Student:Ta-Hsien Hsu Advisor:Yi-Bing Lin
Institute of Network Engineering, National Chiao Tung University
Abstract
With the vigorous development of Internet of Things technology (IoT), IoT technology has been widely used in many fields, including smart home and smart agriculture. However, no one introduces IoT to solve the original problems in landscape architecture. GardenTalk is an IoT device management system that is suitable for green spaces. Through this system, we can quickly build a smart park that can interact with users and the environment. With GardenTalk, managers can efficiently complete the original work, the environment can avoid unnecessary energy consumption, and users can gain extensive experience through multiple methods. In the future, GardenTalk can play a connecting role in the development of smart cities. The green space managed by GardenTalk is like a dot; When dots connect to a plane, it becomes the prototype of a smart city. This thesis elaborates on the design and related applications of GardenTalk. The system is practically used in NCTU and other related fields.
Keywords: Internet of Things(IoT), Sensors, Smart Park, Interactive Landscape, Smart City
IV
Contents
摘 要 ... I
ABSTRACT ... II
誌 謝 ... IIICONTENTS ... IV LIST OF FIGURES ... VI
CHAPTER 1. INTRODUCTION ... 1
Section 1.1. GardenTalk Architecture ... 4
CHAPTER 2. SITE INFORMATION AND CONTEXT ... 7
Section 2.1. Site Location ... 7
Section 2.2. Site Analysis ... 8
Section 2.3. Design Concept ... 10
Section 2.4. Detailed Design ... 12
2.4.1. GardenTalk with Fountain ... 12
2.4.2. GardenTalk with Installation Arts ... 14
2.4.3. GardenTalk with Therapeutic Gardens... 15
2.4.4. GardenTalk with Green Space Monitoring ... 15
CHAPTER 3. DESIGN AND IMPLEMENTATION OF THE LED TREE ... 17
Section 3.1. Project Setup ... 17
Section 3.2. Live View and Remote Control ... 21
Section 3.3. Hardware Design and Implementation ... 22
Section 3.4. Different Ways to Control LED Tree ... 23
3.4.1. Connection with Micro Weather Station ... 23
3.4.2. Connection with MusicTalk ... 26
CHAPTER 4. DESIGN AND IMPLEMENTATION OF THE LAMPS ... 27
V
Section 4.1. Creating the Device Model ... 27
Section 4.2. Live View and Remote Control ... 28
Section 4.3. Hardware Design and Implementation ... 28
CHAPTER 5. DESIGN AND IMPLEMENTATION OF THE FOUNTAIN ... 31
Section 5.1. Creating the Device Model ... 31
Section 5.2. Live View and Remote Control ... 33
Section 5.3. Connection with Voice Control ... 34
CHAPTER 6. OTHER PROJECTS ... 36
Section 6.1. TSMC NCTU Energy Education Center (Orchid House) ... 36
6.1.1. Site Location and Background ... 36
6.1.2. Site Analysis ... 38
6.1.3. House Design ... 38
6.1.4. User Needs ... 39
6.1.5. Design Concepts ... 40
6.1.6. Project Setup ... 41
6.1.7. Environmental Data Displayed on Dashboard ... 43
6.1.8. Live View and Remote Control ... 45
Section 6.2. Installation Art at North Entrance of NCTU... 48
6.2.1. Creation the Device Model ... 48
6.2.2. Live View and Remote Control ... 49
CHAPTER 7. CONCLUSIONS AND FUTURE WORK ... 50
Section 7.1. Conclusions ... 50
Section 7.2. Future Work ... 51
REFERENCE ... 52
APPENDIX A. GARDENTALK DEPLOYMENT COST ... 53
APPENDIX B. GARDENTALK PROBLEM REPORTS ... 54
VI
List of Figures
Figure 1.1 GardenTalk idea diagram. ... 3
Figure 1.2 GardenTalk features diagram. ... 4
Figure 1.3 GardenTalk functional block diagram. ... 6
Figure 2.1 Site location diagram. ... 7
Figure 2.2 Site analysis diagram. ... 8
Figure 2.3 Pedestrian circulation photo. ... 9
Figure 2.4 Planting hole photo. ... 9
Figure 2.5 Design concept diagram. ... 11
Figure 2.6 Master plan. ... 12
Figure 2.7 Interaction between fountain and others. ... 13
Figure 2.8 Photo of the fountain. ... 13
Figure 2.9 Photo of the LED tree. ... 14
Figure 2.10 Green Space Monitoring. ... 16
Figure 3.1 Device Model Setting of LED Tree. ... 17
Figure 3.2 Device Feature Setting of LED Tree. ... 19
Figure 3.3 Project Configuration. ... 20
Figure 3.4 Live View and Remote Control. ... 21
Figure 3.5 LED Tree Circuit Diagram. ... 22
Figure 3.6 Micro Weather Station and it’s component. ... 23
Figure 3.7 Photo of Micro Weather Station. ... 24
Figure 3.8 Device Model Setting of Micro Weather Station. ... 25
VII
Figure 3.9 Dashboard ... 25
Figure 3.10 MusicTalk and the LED tree. ... 26
Figure 4.1 Device Model Setting of Lamp. ... 27
Figure 4.2 Night View of the Lamps. ... 28
Figure 4.3 Circuit Diagram of the Lamps... 29
Figure 4.4 Control Circuit of the Lamps. ... 30
Figure 5.1 Device Model Setting of Sprinkler. ... 32
Figure 5.2 Device Model Setting of Water Light. ... 32
Figure 5.3 Live View and Remote Control. ... 33
Figure 5.4 Control Circuit of the Fountain. ... 34
Figure 5.5 Voice Control GUI. ... 35
Figure 6.1 Site Location of Energy Education Center. ... 37
Figure 6.2 Photos of Energy Education Center. ... 37
Figure 6.3 Skin of Energy Education Center. ... 39
Figure 6.4 Design Concept. ... 41
Figure 6.5 Project Configuration of Energy Education Center (partial). ... 42
Figure 6.6 Indoor Environmental Data Displayed on Dashboard. ... 43
Figure 6.7 Historical Data Displayed on Dashboard. ... 44
Figure 6.8 Power Related Data Displayed on Dashboard. ... 45
Figure 6.9 Outdoor Environmental Data Displayed on Dashboard... 45
Figure 6.10 Location of Cameras and Actuators. ... 46
Figure 6.11 Live View and Remote Control of Camera1. ... 47
Figure 6.12 Live View and Remote Control of Camera2. ... 47
VIII
Figure 6.13 Device Model Setting of LED Installation... 48 Figure 6.14 Live View and Remote Control of LED Installation. ... 49 Figure 6.15 Voice Control with LED Installation. ... 49
1
Chapter 1. Introduction
What is landscape architecture? The following is the definition given by ASLA(American Society of Landscape Architects) which is a professional association for landscape architects in the United States [1], “Landscape architects analyze, plan, design, manage and nurture the built and natural environments. Landscape architects have a significant impact on communities and quality of life. They design parks, campuses, streetscapes, trails, plazas, and other projects that help define a community.”
The word “landscape architecture” was first invented in the early nineteenth-century. The broad concept of interactive landscape originates from modern landscape ecology theory and advocates that people start from the environment around them, communicate with other things, and experience the joy of interaction. According to Li and Ding(2014) [2], “Interaction design was born in nineteen eighties, it pays attention to the relationship between people and environment, people and products. Interaction design sets using feelings in the process as the target, in order to enhance the application value of product.” Through the reasonable treatment of landscape behavior and psychology in the form and space, as well as the auxiliary development of landscape activities, people develop from passive tourists to active participants, maximizing the functional role of landscape to meet human needs. In 2006, DLA(Digital Landscape Architecture) Conference proposed two keywords: "real-time" and "participation".
With the development and advancement of information technology, designers can not only maximize their creativity but also let people participate in it for a better landscape experience.
The conventional way to manage gardens or parks requires the manager to come to the
2
site in person, which consume a lot of time and human resource, and the most common scenario for facilities in the site is turning on and off at particular times by physical timers. Rosser(2017) [3] analyzed and indicated the pros and cons of lighting systems controlled by analog timer and photocell. One of the disadvantages of using the analog timer is that it cannot adapt to the sunset time, which will cause additional energy consumption, and the disadvantage of using the photocell is that the lighting system cannot be shut off at the designated time.
When mentioned about gardens or parks, it’s likely to associate with nature. However, it’s hard to imagine such a natural thing combining with technology. In recent years, Internet of Things (IoT) has become popular since it provides the interconnection of identifiable computing devices within the existing Internet infrastructure. There are also speeches and competitions to speculate on new landscape possibilities, for instance, “Intelligent Living Space Design Competition” [4] held by Architecture and Building Research Institute, Ministry of the Interior, Taiwan and “The Future Park Design Ideas Competition” [5] presented by the University of Melbourne, in partnership with Australian Institute of Landscape Architects (AILA). But when we look closely at the competition works, we find that few works combine emerging technologies. To resolve the above issues, we proposed GardenTalk (Fig. 1.1) which combines IoT technology with landscape architecture, and it not only provides a user-friendly interface to create an interactive landscape but also increases energy efficiency and reduces the effort that managers need to spend.
3
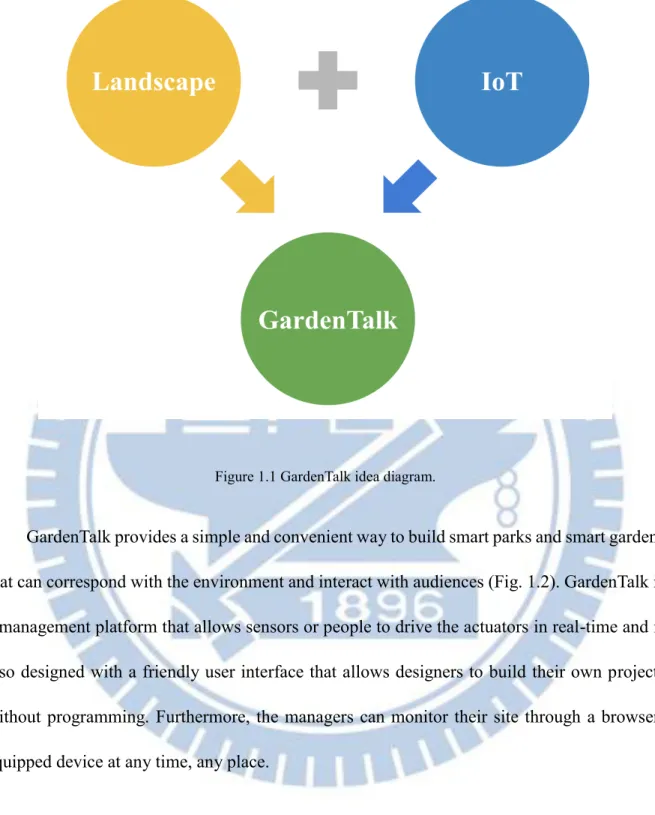
Figure 1.1 GardenTalk idea diagram.
GardenTalk provides a simple and convenient way to build smart parks and smart gardens that can correspond with the environment and interact with audiences (Fig. 1.2). GardenTalk is a management platform that allows sensors or people to drive the actuators in real-time and is also designed with a friendly user interface that allows designers to build their own projects without programming. Furthermore, the managers can monitor their site through a browser- equipped device at any time, any place.
4
Figure 1.2 GardenTalk features diagram.
Section 1.1. GardenTalk Architecture
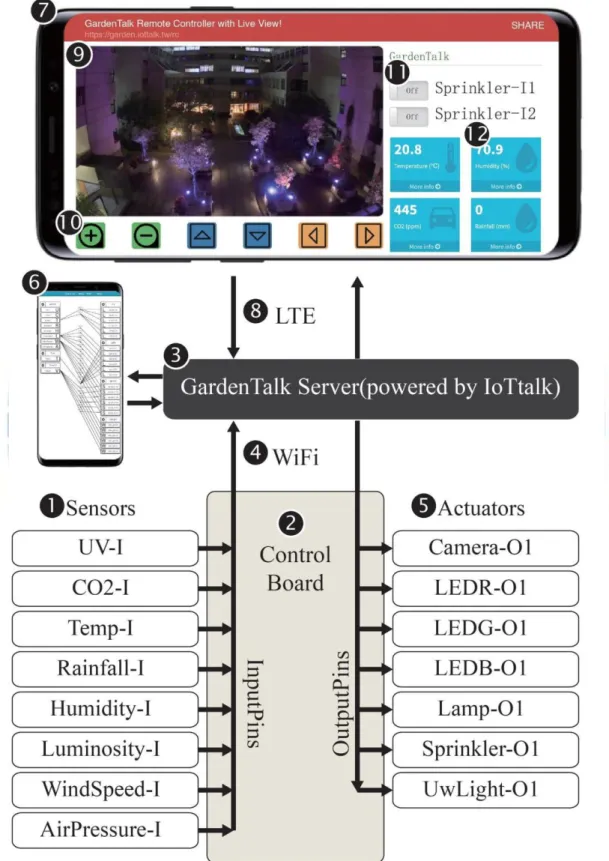
Built on top of the IoT management system called IoTtalk [6], we develop the GardenTalk management platform that integrates sensors and actuators through the control board. Fig. 1 illustrates the functional block diagram for GardenTalk. In this figure, the sensors (Fig. 1.3 (1)) which are used to monitor the environment and send the measured data to the control board (Fig. 1.3 (2)) through the input pins of the control board. The control board sends the data toward the GardenTalk server (Fig. 1.3 (3)) through Ethernet or Wi-Fi (Fig. 1.3 (4)).
The GardenTalk server processes the received data and then gives corresponding instructions to drive the actuators (Fig. 1.3 (5)) through the output pins of the control board. Note that if the
5
number of IoT devices connected to the control board is larger than the number of the pins on the board, or the distance between different actuators are too far, then multiple control boards are used. The connections of all actuators and sensors can be set up through the web-based GardenTalk graphical user interface (GUI) by using the browser-equipped device such as smartphones (Fig. 1.3 (6)) or laptop. The GardenTalk server needs only as little hardware resources, even the Raspberry Pi is enough for the requirement.
The GardenTalk server can also send sensor data to any smartphone (Fig. 1.3 (7)) through the LTE or 5G wireless technologies (Fig. 1.3 (8)). Then the user can view the real-time data through the browser of a smartphone (Fig. 1.3 (7)). GardenTalk accommodates cameras (Fig.
1.3 (9)) in order to speculative the site or sees the results after controlled the actuators remotely through the smartphone. The video control bar (Fig. 1.3 (10)) allows the user to move, rotate and zoom the camera. GardenTalk also provides soft switches (Fig. 1.3 (11)) that allows the user to control the actuators (Fig. 1.3 (5)). For example, if the user clicks the “Sprinkler-O1”
button (Fig. 1.3 (9)), the smartphone will turn the first sprinkler through the path ((11)->(3)-
>(2)->(5)). The smartphone for the project set up and the smartphone for control and display can be the same. For the measured data of each sensor, GardenTalk logs the history, and the user can see the time series chart of a sensor by clicking the sensor’s icon on the dashboard (Fig. 1.3 (12)).
6
Figure 1.3 GardenTalk functional block diagram.
7
Chapter 2. Site Information and Context
This chapter introduces the basic information about the site which is managed by GardenTalk.
Section 2.1. Site Location
We applied GardenTalk to a physical field inside the NCTU campus, which is located in Hsinchu, Taiwan. Fig 2.1. shows the location of the site. The area of this site is approximately 1735 square meters. Our site is a courtyard surrounded by Engineering Building C and Engineering Building D which are mainly used by teachers and students of the computer science department and electrical engineering department.
Figure 2.1 Site location diagram.
8
Section 2.2. Site Analysis
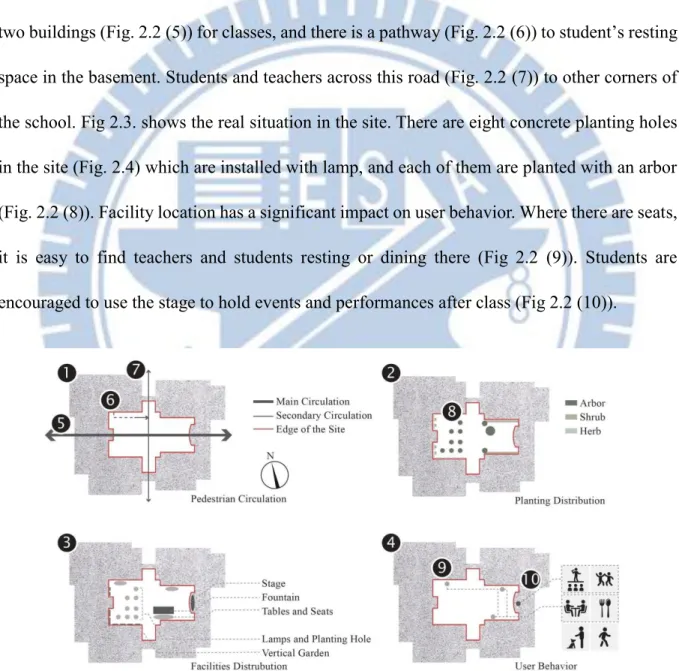
Fig 2.2. shows the analysis of the site. We analyzed the site from four aspects: pedestrian circulation (Fig. 2.2 (1)), planting distribution (Fig. 2.2 (2)), facilities distribution (Fig. 2.2 (3)), and user behavior (Fig. 2.2 (4)). Students and teachers often go back and forth between these two buildings (Fig. 2.2 (5)) for classes, and there is a pathway (Fig. 2.2 (6)) to student’s resting space in the basement. Students and teachers across this road (Fig. 2.2 (7)) to other corners of the school. Fig 2.3. shows the real situation in the site. There are eight concrete planting holes in the site (Fig. 2.4) which are installed with lamp, and each of them are planted with an arbor (Fig. 2.2 (8)). Facility location has a significant impact on user behavior. Where there are seats, it is easy to find teachers and students resting or dining there (Fig 2.2 (9)). Students are encouraged to use the stage to hold events and performances after class (Fig 2.2 (10)).
Figure 2.2 Site analysis diagram.
9
Figure 2.3 Pedestrian circulation photo.
Figure 2.4 Planting hole photo.
10
Section 2.3. Design Concept
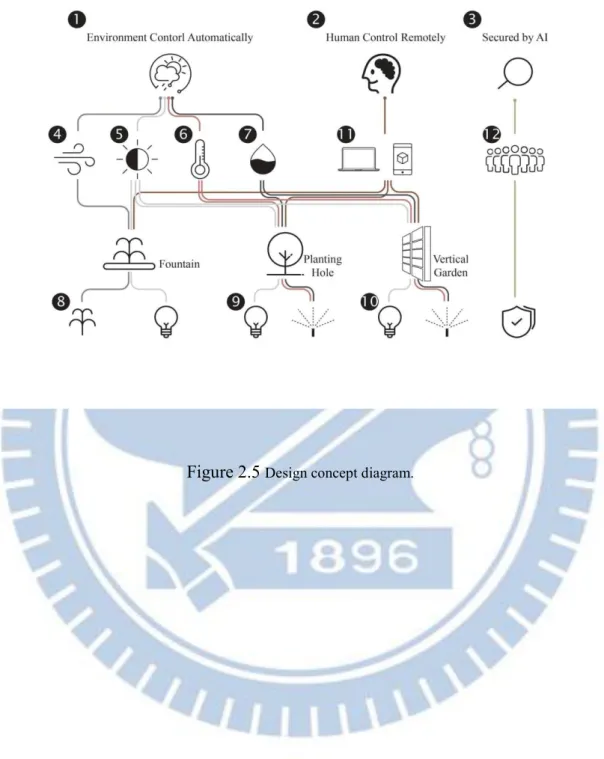
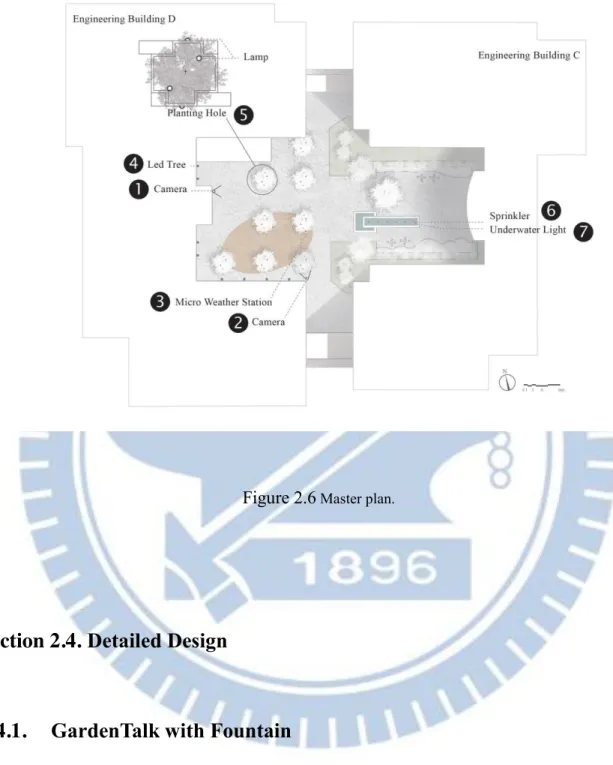
As mentioned in the previous chapter, GardenTalk is a management platform for interaction between humans, landscapes, and the environment. Fig 2.5. shows the design concept of this project. In our design, actuators can be controlled by the environment automatically (Fig 2.5 (1)) or by humans remotely (Fig 2.5 (2)). Even more, the site can be secured by AI (Fig 2.5 (3)) which can reduce personnel costs. We use sensors to collect data and then do the corresponding action. For example, we have a sensor for wind speed (Fig 2.5 (4)), luminosity (Fig 2.5 (5)), temperature (Fig 2.5 (6)), and humidity (Fig 2.5 (7)). These sensors (Fig 1 (1)) are connected to the control board (Fig 1 (2)) that we have mentioned in the first chapter. The wind speed data can be used to control the fountain (Fig 2.5 (8)) to avoid splashing in the strong wind, and the luminosity data can use to decide when should turn on the lamp (Fig 2.5 (9)). Furthermore, we can present the temperature of the environment to the color change of the LED tree (Fig 2.5 (10)). Fig 2.6. is the landscape schematic master plan which also illustrates the locations of facilities that are managed by GardenTalk server. We deployed two IP cameras at (Fig 2.6 (1)) and (Fig 2.6 (2)) to monitor the entire site and ensure that the actuators are functioning properly. When we choose the installation site, the most important thing is to choose a place with good vision, but at the same time, we need to consider the accessibility of the network and electricity. We also installed a micro weather station (Fig 2.6 (3)) which need to be installed in a wide place to collect reasonable environmental data. We designed an LED tree (Fig 2.6.(4)) which is an installation art that composed of LED lights.
There are eight existing planting hole (Fig 2.6 (5)) with the lamps on it. We turned the existing
11
pool into a fountain by added sprinklers (Fig 2.6 (6)) and underwater lights (Fig 2.6 (7)).
Figure 2.5 Design concept diagram.
12
Figure 2.6 Master plan.
Section 2.4. Detailed Design
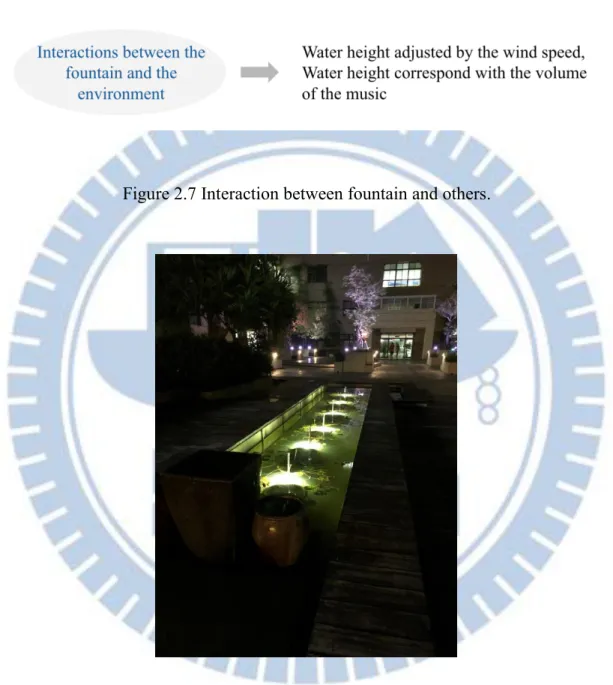
2.4.1. GardenTalk with Fountain
We use GardenTalk to control the fountain, and Fig 2.7 shows how the fountain interact with the environment and people. Fig 2.8 shows what the fountain looks like at night.
13
Figure 2.7 Interaction between fountain and others.
Figure 2.8 Photo of the fountain.
14
2.4.2. GardenTalk with Installation Arts
GardenTalk offer a simple way to build an interactive installation art. We used LED stripes to build a LED tree Fig 2.8 that is able to flash with the rhythm of the music or it can show the temperature of the environment in color.
Figure 2.9 Photo of the LED tree.
15
2.4.3. GardenTalk with Therapeutic Gardens
Henry David Thoreau said: “Nature is but another name for health...”. We all know that nature do positive effect on human beings not only physically but also mentally. There are arising research about how nature affect human health. Furthermore, therapeutic gardens and horticultural therapy are common in western world already. According to AHTA(American Horticultural Therapy Association) [7], “A therapeutic garden is a plant-dominated environment purposefully designed to facilitate interaction with the healing elements of nature.
Interactions can be passive or active depending on the garden design and users’ needs.”. In [8], the author details the development context of the therapeutic garden. In the past, people took a walk in the garden when the weather was good, but what about when the weather was bad or when they were traveling? GardenTalk provides a new way to access the garden and the plants which is not limited by the weather and the distance.
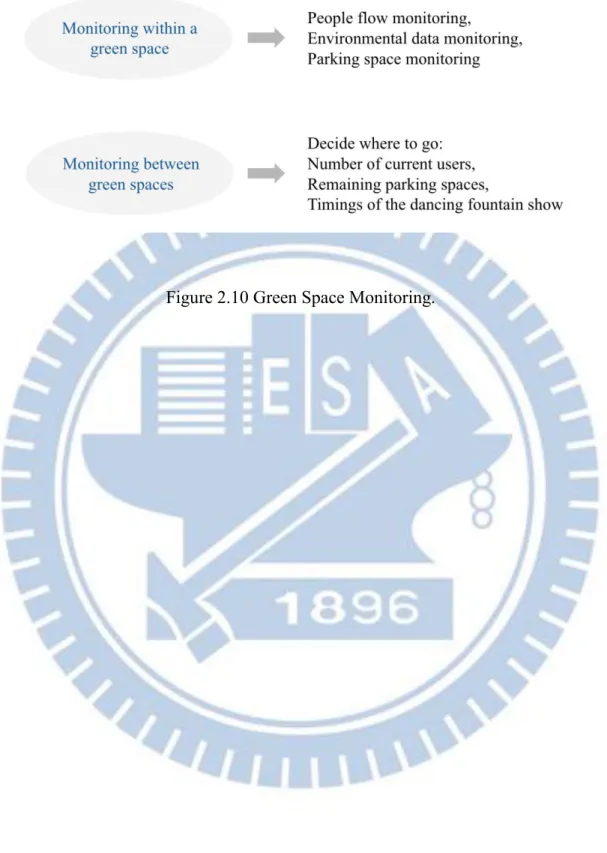
2.4.4. GardenTalk with Green Space Monitoring
Using this platform to monitor green space (Fig 2.10.) can help managers improve safety in a more effective way. For example, if the system detects abnormal crowds at night, it will actively notify managers. Users can also choose a suitable destination through the information such like the number of current users or the remaining parking spaces.
16
Figure 2.10 Green Space Monitoring.
17
Chapter 3. Design and Implementation of the LED Tree
This chapter provides the detailed implementation of the LED tree and elaborates on how to set up a project on GardenTalk.
Section 3.1. Project Setup
IoTtalk is centered at the concepts of “device model” and “device feature” in [9]. Before we set up the project, we first establish device models and device features. Fig 3.1 shows the window about adding a new device model called “LED Tree” (Fig. 3.1 (1)).
Figure 3.1 Device Model Setting of LED Tree.
18
Each device model is composed of one or more device features (DFs). There are two types of DFs, input device feature (IDF; Fig. 3.1 (2)) and output device feature (ODF; Fig 3.1 (3)).
The device model “LED Tree” has six output device features but no input device feature since the LED Tree is an actuator.
Fig 3.2 shows the window that we add a new device feature belongs to ODF (Fig 3.2 (1)) in category “Sight” (Fig 3.2 (2)) called “LEDR-O1” (Fig 3.2 (3)). This device feature has only one parameter (Fig 3.2 (4)) with the type integer (Fig 3.2 (5)). We have followed some basic naming rules, first, we used camelcase, then the suffixes -I, -O respectively represent IDF and ODF, and finally, if there are more than one device features of the same name, numbers will be added at the end. For example, LEDR-O2 represents the second LEDR and belongs to ODF.
From the above description, a device model is a collection of device features. An input device is a set of IDFs, and an output device is a set of ODFs. The device model “LED Tree” is consists of six device features (Fig 3.1 (3)) which are two sets of three-primary colors (RGB).
Each of the device features is one of the three primary colors, and the red, green, and blue use 8 bits each, which have integer values from 0 to 255.
19
Figure 3.2 Device Feature Setting of LED Tree.
After setting up the device models and device features, then we are able to create a project through GardenTalk GUI. Fig 3.3 shows the configuration of this project. To establish a project, you have to give it a unique project name (Fig 3.3 (1)), and then add the device models you need into the project through the “Model” button (Fig 3.3 (2)). In project configuration pages, the input devices are represented by the icons placed at the left-hand side, and the output devices are placed at the right-hand side.
In this project, there are three input device models, namely “Model 1” (Fig 3.3 (3)),
“Timer” (Fig 3.3 (4)), and “VoiceCtl” (Fig 3.3 (5)). Also, there are four output device models respectively “LED” (Fig 3.3 (6)), “Lamp” (Fig 3.3 (7)), “Sprinkler” (Fig 3.3 (8)) and
“UwLight” (Fig 3.3 (9)). GardenTalk server links an IDF to an ODF by two line segments through a “join” circle in which users can implement the function to manipulate the data from IDFs to ODFs.
20
Figure 3.3 Project Configuration.
21
Section 3.2. Live View and Remote Control
Figure 3.4 shows the GardenTalk Live View webpage and remote control. LED tree consists of two parts, divided into border (Fig 3.4 (1)), and center (Fig 3.3 (2)). On the left- hand side of this figure are remote controls. Fig 3.4 (3) is the controller for the lamps which were being introduced in the next chapter. We use two color panels to control the LED tree,
“Color-I1” (Fig 3.4 (4)) is used to control the border of the LED tree (Fig 3.4 (1)) and “Color- I2” (Fig 3.4 (5)) is used to control the center of the LED tree (Fig 3.4 (2)). The video control bar (Fig. 3.4 (6)) allows the user to move, rotate, and zoom the camera.
Figure 3.4 Live View and Remote Control.
22
Section 3.3. Hardware Design and Implementation
Figure 3.5 shows the circuit diagram of the LED tree. We use Arduino Yún (Fig 3.5 (1)) as a control board. The architecture of is Arduino Yún and GardenTalk server follows ArduTalk[10]. Through Arduino Yún’s GPIO, we cascade a 230 Ohms (Fig 3.5 (2)) resistance and a TIP122 Darlington transistor (Fig 3.5 (3)) to act as a high-speed switch. A pair of resistance and transistor can control one of the three primary colors in the LED strip (Fig 3.5 (4)). So we have six pairs of it to control two sets of LED strip in this project. The LED strip we use needs to be used with DC 12v (Fig 3.5 (5)). We use PWM (Pulse Width Modulation) signal and this high-speed switch to manipulate the voltage from 0~12v for LED strips, and then we are able to control each of the colors into different brightness.
Figure 3.5 LED Tree Circuit Diagram.
23
Section 3.4. Different Ways to Control LED Tree
3.4.1. Connection with Micro Weather Station
Section 3.2 described how to control the LED tree through the color panel. Still, there are many other ways we can use as input to trigger the LED tree. We installed a micro weather station called “Model 1” in our site, and we can simply use the temperature data as input to control the LED tree. Micro Weather Station have eight IDFs, namely “UV-I” (Fig 3.3 (10)),
“CO2-I” (Fig 3.3 (11)), “Temp-I” (Fig 3.3 (12)), “Rainfall-I” (Fig 3.3 (13)), “Humidity-I” (Fig 3.3 (14)), “Luminosity-I” (Fig 3.3 (15)), “WindSpeed-I” (Fig 3.3 (16)), “AirPressure-I” (Fig 3.3 (17)). Fig 3.6 shows the photo of the micro weather station at the site. Model 1 is consist of four parts, Fig 3.6 (1) is rainfall sensor, Fig 3.6 (2) is a wind speed sensor, Fig 3.6 (3) are rest of the six sensors, and Fig 3.6 (4) is a waterproof box that contains the power supply and control board. Fig 3.7 shows the interior of the micro weather station.
Figure 3.6 Micro Weather Station and it’s component.
24
Figure 3.7 Photo of Micro Weather Station.
Fig 3.8 shows the device model window about adding a DM called “Weather Station”
(Fig 3.8 (1)) which consists of eight IDFs (Fig 3.8 (2)), namely UV-I, CO2-I, Temp-I, Rainfall- I, Humidity-I, Luminosity-I, WindSpeed-I, AIrPressure-I and zero ODFs (Fig 3.8 (3)).
Simultaneously, all data collected by the micro weather station will be shown on the dashboard (Fig 3.9) for data visualization. Besides, the data will be saved to the server to provide users with further analysis or research.
25
Figure 3.8 Device Model Setting of Micro Weather Station.
Figure 3.9 Dashboard
26
3.4.2. Connection with MusicTalk
MusicTalk is the work developed by our lab members, which is used to extract the rhythm of the music through FFT (Fast Fourier Transformation). We connected MusicTalk to the LED tree, and then the LED tree will change the color and brightness of the light as the music playing.
Fig 3.10 is the screenshot of the MusicTalk demonstration video, where Fig 3.10 (1) is the project configuration. Fig 3.10 (2) and Fig 3.10 (3) are IDF monitor and ODF monitor; they will display the real-time data sent by IDF and received by ODF. Fig 3.10 (4) is the LED tree controlled by MusicTalk.
Figure 3.10 MusicTalk and the LED tree.
27
Chapter 4. Design and Implementation of the Lamps
This chapter provides the details of how these lamps are connecting to GardenTalk, including hardware implementation and software control methods.
Section 4.1. Creating the Device Model
Fig 4.1 shows the window about adding a new device model called “Lamp” (Fig 4.1 (1)).
As Fig 4.1 shows, the device model “Lamp” consists of zero of IDFs (Fig 3.9 (2)) and six ODFs (Fig 3.9 (3)), which are Lamp-O1 to Lamp-O6.
Figure 4.1 Device Model Setting of Lamp.
28
Section 4.2. Live View and Remote Control
Section 3.2 introduced GardenTalk Live View webpage and remote control. We can use the remote control (Fig 3.4 (3)) to control these lamps. Although we can control the lamps through the remote control, it is more practical to use soft-timer (Fig 3.3 (4)) to cooperate with the site's luminosity data. Fig 4.2 is what it looks like when all the lights are on at night.
Figure 4.2 Night View of the Lamps.
Section 4.3. Hardware Design and Implementation
Figure 4.3 shows the circuit diagram of the lamps. We use Arduino Yún (Fig 4.3 (1)) as a control board. The architecture of is Arduino Yún and GardenTalk server follows ArduTalk[10].
We use Arduino Yún’s GPIO to control the relays (Fig 4.3 (2)) and then use the relays to control
29
the electromagnet contactors (Fig 4.3 (3)). Finally, use the electromagnetic contactors to control the lamps (Fig 4.3 (4)). The reason for this hierarchical design is mainly because of the size of the current. Fig 4.3 (5) is the power supply for this circuit, note that there are two different voltages here, 110v for the relays and 220v for the electromagnet contactors. Fig 4.4 is the photo of the control circuit installed at the site.
Figure 4.3 Circuit Diagram of the Lamps.
30
Figure 4.4 Control Circuit of the Lamps.
31
Chapter 5. Design and Implementation of the Fountain
This chapter provides the details of how the fountain is connected to GardenTalk, including hardware implementation and software control methods.
Section 5.1. Creating the Device Model
The fountain contains two parts, the sprinkler and the underwater light. Every sprinkler is paired with a monochromatic underwater light. We created two DMs called “Sprinkler” and
“Underwater Light”. Fig 5.1 shows the window about setting a new device model called
“Sprinkler” (Fig 5.1.(1)). As Fig 5.1 shows, the device model “Sprinkler” consists of zero of IDFs (Fig 5.1.(2)) and six ODFs (Fig 5.1.(3)), which are Sprinkler-O1 to Sprinkler-O6. Fig 5.2 shows the window about adding a new device model called “Underwater Light” (Fig 5.2.(1)).
As Fig 5.2 shows, this DM also consists of zero of IDFs (Fig 5.2.(2)) and six ODFs (Fig 5.2.(3)).
32
Figure 5.1 Device Model Setting of Sprinkler.
Figure 5.2 Device Model Setting of Water Light.
33
Section 5.2. Live View and Remote Control
To view the complete picture of the site, we installed two cameras for a different angle of view at Fig 2.6 (1) and Fig 2.6 (2). Fig 5.3 (1) shows the live view from the IP camera (Fig 2.6 (1)). We can use the dropdown menu (Fig 5.3 (2)) to go to the preset position conveniently.
Also, we can use the video control bar (Fig 5.3 (3)) to move, rotate, and zoom the camera. Fig 5.4 (4) shows the remote control for the fountain.
Figure 5.3 Live View and Remote Control.
34
Figure 5.4 Control Circuit of the Fountain.
Section 5.3. Connection with Voice Control
The section will introduce the voice control, which is a different way to interact with the fountain. Fig 5.5 shows the GUI of GardenTalk Voice Talk, which is a simple website considered as a cyber-device. We connected the voice control to the fountain (Fig 3.3 (5)). To start the voice control, users have to press the microphone button (Fig 5.5 (1)) first. Then it will convert the voice to text and show the recognition result on the screen (Fig 5.5 (2)) simultaneously. We can set a specific keyword as trigger conditions. For example, we use "I love you" as the trigger keyword. When the user says, "I love you.", the voice control will turn on the fountain.
35
Figure 5.5 Voice Control GUI.
36
Chapter 6. Other Projects
One of the advantages of GardenTalk is it module design, where the project we had developed before can be easily reused in other similar scenarios. This chapter introduces other projects of GardenTalk by reusing the projects developed in the previous chapters.
Section 6.1. TSMC NCTU Energy Education Center (Orchid House)
6.1.1. Site Location and Background
“TSMC NCTU Energy Education Center” (hereafter “Energy Education Center”) is located in the open green area beside the TSMC factory in the Hsinchu Science Park. Fig 6.1 shows the location of Energy Education Center. The predecessor of Energy Education Center was Orchid House, which had won several awards at the 2014 European Solar Decathlon[11].
With the help of TSMC, Energy Education Center continued to use the original structure and some materials of Orchid House and updated the design for Taiwan's local climate and long- term use. Energy Education Center was opened in 2017 to educate and promote the concept of sustainable energy. Fig 6.2 shows the photo of Energy Education Center.
37
Figure 6.1 Site Location of Energy Education Center.
Figure 6.2 Photos of Energy Education Center.
38
6.1.2. Site Analysis
Hsinchu City has a subtropical climate. In Hsinchu, summer is long and hot. In summer, the daily temperature can reach 27 to 35 degrees, and the humidity is relatively high. Winters are short and the average temperature in January is between 15 and 21 degrees.
6.1.3. House Design
The space of the Energy Education Center is mainly divided into inner space and outer space. The inner space is the main activity space designed on the first floor. Materials with excellent thermal insulation properties are used to keep the temperature constant. The outer layer consists of a glass structure similar to a greenhouse. This space is composed of green plants and orchids. In addition to beautifying the space and purifying the air, it can also be used with shutters and exhaust fans to regulate the temperature. The sloping roof not only has solar power generation capacity but also makes it easier to recycle rainwater. It can solve Taiwan's summer rainfall-intensive drainage problem and improve the urban heat island effect.
Fig 6.3 shows the skin of Energy Education Center.
39
Figure 6.3 Skin of Energy Education Center.
6.1.4. User Needs
1. Thermal Comfort
According to EU standard EN 15251: Indoor environmental input parameters for design and assessment of energy performance of buildings addressing indoor air quality, thermal environment, lighting and acoustics [12], the indoor comfort temperature is not a constant value but will change with the outside temperature. In conjunction with this standard, unnecessary energy consumption can be avoided.
40
2. Personal Adaptive Thermal-comfort Model
Although the EU 15251 can provide a set of standards to define the comfortable indoor temperature, there are subjective differences between individuals, and a set of personal comfort models is necessary. Our system can adjust the building's temperature according to the user's customized comfort model before entering the building.
6.1.5. Design Concepts
First of all, we use the Internet of Things technology to connect the sensors and actuators of Energy Education Center to our system for real-time environmental monitoring and control.
Next, we collect user feedback on thermal comfort and environmental data (Fig 6.4 (1)), including temperature and humidity, etc. With the collected data, we are able to train the user’s personal comfort model (Fig 6.4 (2)). After the personal model generated, we use it to automatically help the user adjust the actuators (Fig 6.4 (3)) and create an ideal environment among comfort and energy consumption. This personal model is not limited to a specific building; it is portable and can be easily applied elsewhere (Fig 6.4 (4)).
41
Figure 6.4 Design Concept.
6.1.6. Project Setup
In this project, a large number of sensors and actuators were deployed to monitor the entire site. Since the entire project was too massive, we have split it into several projects for better management. Fig 6.5 shows one of the project configurations of Energy Education Center called “orchid floor 1” (Fig 6.5 (1)). Fig 6.5 (2) is the DM with server IDFs from CO2-I, Humidity-I, Lux-I, Moisture-I to Temp-I. All the data will be sent to the dashboard (Fig 6.5 (3)) for monitoring.
42
Figure 6.5 Project Configuration of Energy Education Center (partial).
43
6.1.7. Environmental Data Displayed on Dashboard
All collected data will be displayed on the dashboard and recorded in the database. Inside Energy Education Center, we have deployed sensors such as temperature, humidity, brightness, and carbon dioxide. Fig 6.6 shows the indoor environmental data on the dashboard. According to the location of the sensors, we separated them into different tabs in the dashboard. For example, Fig 6.6 (1) is the tab for the first floor sensors, and Fig 6.6 (2) is the tab for the second- floor sensors. By clicking the “More info” button (Fig 6.6 (3)), users can see the historical data of the selected sensor. Fig 6.7 demonstrates the historical data collected by the sensors.
Figure 6.6 Indoor Environmental Data Displayed on Dashboard.
44
Figure 6.7 Historical Data Displayed on Dashboard.
Solar panels are installed on the roof of Energy Education Center to generate electricity.
Electricity-related data such as cumulative electricity consumption, voltage, and current are also displayed on the dashboard. Fig 6.8 shows the power-related data on the dashboard.
We also installed a weather station outside to collect outdoor environmental data, including temperature, humidity, wind speed, wind direction, etc. Fig 6.9 shows the outdoor environmental data on the dashboard.
45
Figure 6.8 Power Related Data Displayed on Dashboard.
Figure 6.9 Outdoor Environmental Data Displayed on Dashboard.
6.1.8. Live View and Remote Control
We installed two network cameras that support 360-degree rotation to monitor this site.
Fig 6.10. shows the exact position of two cameras and actuators for thermal comfort. Fig 6.11 shows the live view and remote control of camera 1. Users can see the real-time image of Energy Education Center (Fig 6.11 (1)) and go to the preset location through the dropdown menu (Fig 6.11 (2)). Users can pan, tilt, or zoom the camera through the camera control bar
46
(Fig 6.11 (3)). Fig 6.11 (4) is the remote controller for the actuators. Fig 6.11 (5) and Fig 6.11 (6) are electric windows and exhaust fans controlled by our system to adjust the temperature.
Fig 6.12 (1) shows the real-time image of camera 2, which is installed on the first floor of Energy Education Center. There is a remote controller at the right-hand side of this web page (Fig 6.12 (2)). The scroll bar (Fig 6.12 (3)) is designed to adjust the brightness for some of the lamps that can be adjusted in brightness (Fig 6.12 (4)).
Figure 6.10 Location of Cameras and Actuators.
47
Figure 6.11 Live View and Remote Control of Camera1.
Figure 6.12 Live View and Remote Control of Camera2.
48
Section 6.2. Installation Art at North Entrance of NCTU
This installation art is located in the open green space beside the north entrance of National Chiao Tung University, Hsinchu. At the end of each year, NCTU holds an art exhibition with the theme of light. This project is one of the works in the exhibition.
6.2.1. Creation the Device Model
This installation art consists of eleven LED lights, and each of them has a different color.
We created a DM called “LED Installation” (Fig 6.13 (1)) with zero IDF (Fig 6.13 (2)) and eleven ODFs (Fig 6.13 (3)).
Figure 6.13 Device Model Setting of LED Installation.
49
6.2.2. Live View and Remote Control
Fig 6.14 shows the live view and remote control of this project. Completing this project is easy and straightforward, because of the module design of GardenTalk, we only need to reuse the things in the previous chapter. Fig 6.15 is the photo of reusing Voice Control to interact with this installation art.
Figure 6.14 Live View and Remote Control of LED Installation.
Figure 6.15 Voice Control with LED Installation.
50
Chapter 7. Conclusions and Future Work
“Our imagination is the only limit to what we can hope to have in the future.”
Charles F. Kettering
Section 7.1. Conclusions
This thesis proposes GardenTalk, a management platform for interaction between humans, landscapes, and the environment. We provide a possibility of landscape in the future, and we attempt to use the Internet of Things technology to solve the problems faced by landscape and architecture. With the help of GardenTalk, it is easy to build smart parks or smart gardens. The advantages of GardenTalk includes:
● For landscape managers: Easily complete the original work.
● For average users: Gain extensive experience through multiple interactive methods.
● For the environment: Avoid unnecessary energy consumption.
We use GardenTalk to manage a courtyard inside the NCTU campus, helping the original manager complete their work more efficiently. We built an LED tree to demonstrates that making an interactive installation art can be easy and flexible. We control lamps according to the brightness of the environment to use energy properly. GardenTalk has also been used to NCTU TSMC Energy Education Center and the installation art inside the NCTU campus.
51
Section 7.2. Future Work
Future work includes using this system in more places. One of the advantages of GardenTalk is that it can quickly deploy to new fields, and a large number of things can be reused. Next is to implement the idea of using artificial intelligence to help secure green spaces. We can build the personal comfort model, including temperature, humidity, and brightness, by machine learning methods. People have a different preference for temperature, humidity, and brightness. For instance, people with injured joints may be more repulsive to high humidity environments, and older people may have different light requirements from ordinary people due to degradation.
52
Reference
[1] “WHAT IS LANDSCAPE ARCHITECTURE?” Accessed on: Mar. 21, 2020. [Online]. Available:
https://www.asla.org/aboutlandscapearchitecture.aspx
[2] Li JF, Ding MJ. Research of Landscape Interactive Design. Advanced Materials Research 2014;1051:791–6.
https://doi.org/10.4028/www.scientific.net/amr.1051.791.
[3] “The Best Control / Timer for Your Outdoor Landscape Lighting System” Accessed on: Mar. 21, 2020. [Online].
https://www.utahlights.com/blog/the-best-control-/-timer-for-your-outdoor-landscape-lighting-system [4] “Intelligent Living Space Design Competition ” Accessed on: Jul. 7, 2020. [Online]. https://design.ils.org.tw
[5] “The Future Park Design Ideas Competition ” Accessed on: Jul. 7, 2020. [Online].
https://msd.unimelb.edu.au/be150/competitions/futurepark 2
[6] Y.-B. Lin, Y.-W. Lin, C.-M. Huang, C.-Y. Chih and P. Lin, “IoTtalk: A Management Platform for Reconfigurable Sensor Devices,” in IEEE Internet of Things Journal, vol. 4, no. 5, pp. 1552-1562, Oct. 2017.
[7] “About Therapeutic Gardens” Accessed on: Jul. 7, 2020. [Online]. https://www.ahta.org/about-therapeutic-gardens
[8] Pouya, Sima and Demirel, Öner, “What is a healing garden?” AKDENİZ ÜNİVERSİTESİ ZİRAAT FAKÜLTESİ DERGİSİ, vol. 28, pp. 5-10, Jul. 2015.
[9] Y.-B. Lin. IoTtalk-Manual(English). [Online]. Available: http://liny.csie.nctu.edu.tw/document/IoTtalk_Manual-Eng.docx Accessed on: Jul. 7, 2020.
[10] Y.-W.Lin,Y.-B.Lin,M.-T.Yang,and J.-H.Lin,‘‘ArduTalk:AnArduino network application development platform based on IoTtalk,’’
IEEE Syst. J., pp. 1–9, Nov. 2017.
[11] “Solar Decathlon Europe” Accessed on: Jul. 7, 2020. [Online]. https://www.solardecathlon.gov/international-europe.html
[12] “DIN EN 15251 Indoor environmental input parameters for design and assessment of energy performance of buildings addressing indoor air quality, thermal environment, lighting and acoustics” Accessed on: Jul. 7, 2020. [Online]. https://www.en-standard.eu/din- en-15251-indoor-environmental-input-parameters-for-design-and-assessment-of-energy-performance-of-buildings-addressing-indoor- air-quality-thermal-environment-lighting-and-acoustics/
53
Appendix A. GardenTalk Deployment Cost
This appendix documents the deployment cost of GardenTalk.
Items Cost Per
Unit (NTD)
Units Sum
(NTD)
Remarks
Arduino Yún 2,000 5 10,000
Relay 165 3 495 8-Channel 5V
Tip 122 10 6 60
Power Supply 150 5 750 AC 120V to DC 5V
IP Camera 8,000 1 8,000 VIVOTEK IB9367-HT
IP Camera 8,2000 1 82,000 VIVOTEK SD9366-EHL
Camera Pan 2,200 1 1
LED Tree 45,000 1 45,000 Including Construction Cost
Waterproof Box 500 2 1,000 Small
Waterproof Box 2,000 2 4,000 Large
Model 1 9,200 1 9,200 Micro Weather Station
Sprinkler 500 6 3000
Underwater Light 600 6 3600
Total Cost $159,305
54
Appendix B. GardenTalk Problem Reports
This appendix documents the problems and solutions encountered by GardenTalk in practice.
No. 1 Report Date 2019/01/08 Close Date 2019/02/11
Problem Description
The Arduino board of the LED tree failed after two days of operation. After inspection, it was found that the pin on the Arduino was burnt out.
Solution Install a 220-ohm resistor between the Arduino pin and the base of the Tip122 transistor to avoid burning the pin with excessive current.
Original circuit diagram:
55
The revised circuit diagram:
56
No. 3 Report Date 2019/01/23 Close Date 2019/03/01
Problem Description
The lamps cannot be completely dimmed after the power is turned off.
Solution The 220v on the electromagnetic contactor was initially a single input and single output, but 220v was composed of two 110v live wires. The original circuit failed to ensure that no current passed when the switch was closed, so the electromagnetic contactor was changed to double In and out. Use an electromagnetic contactor to disconnect both live wires to ensure that no current passes.
Photo of the described problem:
57
Original circuit diagram:
58
The revised circuit diagram:
59
No. 4 Report Date 2019/07/21 Close Date 2019/07/24
Problem Description
After the server is restarted due to power failure, the project page cannot be accessed.
Solution The console of ESM shows permission denied when the log is written, After modifying the owner of all files in the log directory, the server can operate properly.
Error message of project page:
Error message of ESM console:
60
No. 5 Report Date 2019/11/05 Close Date 2019/11/17
Problem Description
The camera control bar doesn’t work. The network link from Arduino to switch is not working.
Solution Change the network cable.
Photo of the described problem:
61
No. 6 Report Date 2019/11/12 Close Date 2019/11/15
Problem Description
The device model click on the project page fails to respond.
Solution It’s the bug of the old version, the server returns to normal after the update.
Error message from the server:
62
No. 7 Report Date 2019/02/17 Close Date 2019/02/19
Problem Description
No display on GardenTalk live view page. It is the camera's network cable interface that has been wetted causing a short circuit.
Solution Uninstalled the camera and sent it back to the factory for the repairing.
Photo of the described problem: