Order Price Clustering on the Taiwan Stock Exchange
蕭朝興
†國立東華大學財務金融學系教授
王子湄
國立東華大學企業管理學系博士候選人
Abstract
Employing a rich sample of limit orders, trades, and quotes on the Taiwan Stock Exchange, this paper examines the clustering pattern of limit-order prices and several associated issues. The results, first, show strong evidence of orders clustering. Absolute tick size has more influence than relative tick size on price clustering in the market with a step-function tick schedule. Second, individual investors and mutual funds demonstrate the strongest tendency to cluster. Third, the non-marketable limit orders cluster more than marketable limit orders, indicating that aggressive limit orders generally embed more information. Fourth, investors choosing even- price limit orders are not penalized by lower execution ratios. Fifth,
investors, particularly individual investors, tend to front-run others to capitalize on opportunities created by price clustering. Sixth, the observed price clustering indeed creates price barriers. Finally, the degree of price clustering using trade data significantly underestimated, compared to that using limit-order data.
Keywords: price clustering, tick size, marketable limit order, front running, price barrier
† 通訊作者。Tel.: 886-38633135; Fax: 886-38633130. Email: cschiao@mail.ndhu.edu.tw.
Introduction
Price clustering is often referred to the tendency of prices to deviate from a uniform distribution of available prices and round up and down to a coarser set of prices.
Starting from the 1960s, many economists, e.g., Osborne (1962) and Niederhoffer (1965), observe evidence for stickiness of prices at the integer and “congestion” in US share prices. Up to now, according to the literature, the phenomenon is prevailing in numerous financial markets.
1Employing a rich sample of limit orders, trades, and quotes on the Taiwan Stock Exchange (TSE), a pure order-driven and call market without market makers, this paper aims at examining the clustering pattern of limit- order prices and several associated issues.
The TSE is known as a fast globalizing and institutionalizing market. Since the early 1980s, the Ministry of Finance of Taiwan has globalized its stock market, widely dominated by individual investors (Harrison, 1994), in order to enhance its efficiency.
After two decades, its achievements have been recognized. According to Chiao, Wang, and Lai (2007), up to 32.8% of dollar trading volume on the TSE is attributable to trades by institutional investors from 2001 to 2003. Contrasted with a mere 3% in 1989 (Schwartz and Shapiro, 1992), institutional trading has increased fast over years.
As to why price clustering takes place, many hypotheses are available in the literature. First, proposing the price resolution hypothesis, Ball, Torous, and Tschoegl (1985) address that price clustering stems from the uncertainty of the underlying value of a given security. For instance, the higher the price volatility, the stronger the price clustering pattern, because investors wish to deal quickly with all trades, which normally leads to less precise valuations (Chung and Chiang, 2006). Shiller (2000) claims that market participants, in the absence of accurate agreement on fundamentals, may use the nearest round number as a proxy.
Second, extending from the price resolution hypothesis, Harris (1991) advances the negotiation hypothesis, arguing that uncertainty may drive traders to use round prices in order to reduce the costs involved in searching for accurate prices, which causes more price clustering. Ohta (2006) posits that the cost of price discovery may depend on trading rules or trading mechanisms. Thus, different trading mechanisms can incur
1 It has been found in many different settings such as international stock markets (Aitken et al, 1996;
Hameed and Terry, 1998; Sonnemans, 2003; Ohta, 2006; Chung, Kim, and Kitsabunnarat, 2005), foreign exchange markets (Goodhart and Curcio, 2001; Sopranzetti and Datar, 2002), gold markets (Ball, Torous and Tschoegl , 1985), and derivatives markets (Schwartz, Van Ness and Van Ness, 2004; Bollen, Smith and Whaley, 2003; ap Gwilym, Clare and Thomas, 1998; Brown, Laux and Schachter, 1991), and bank deposit rates (Kahn, Pennachi and Sopranzetti, 1999).
different levels of cost, resulting in different degrees of clustering.
2Third, the attraction hypothesis, proposed by Goodhart and Curcio (1991) and Aitken et al. (1996), builds on the tendency of prices to cluster at salient numbers like 0 or 5. Grossman et al. (1997) support that quotes ending at 0 and 5 were the most frequent, followed by equal frequencies of quotes ending at 2, 3, 7 and 8. Quotes with a last digit of 1, 4, 6, or 9 were the least frequent.
3While studies on price clustering have both a long history and an extensive coverage, most of them focus on price clustering of transactions and quotes, very limited papers (e.g., Cooney, Van Ness, and Van Ness, 2003) pay attention to the order price clustering. Although the clustering of transactions and quotes can be largely attributed to investors’ preference for round prices, we regard that neither trade nor quote data are able to completely reflect the true order submission behavior of investors, compared to limit-order data. On the one hand, execution prices act as the ex-post realizations rather than the ex-ante intentions of investors, because execution prices may not be equal to the submitted order prices.
4Furthermore, the clustering pattern using trade data cannot cover the part of limit orders not executed. On the other hand, we argue that quote data covering only partially the limit order book may incompletely address its pattern of price clustering.
To differentiate this paper from most literature, we take advantage of the richness of our data and primarily use the limit-order data (as well as the trade and quote data) that unambiguously classify each limit order into one of five groups, including foreign investors, mutual funds, securities dealers, individual investors, and corporate
institutions.
5The classification of investors’ orders greatly helps us pin down separately their strategic roles in forming price clustering. The contribution of this paper is
primarily to provide further insight into price clustering and the associated issues related to order submission behaviors of investors and order types. In addition, we introduce a concern and evidence for the incapability of quote and trade data to capture the ex-ante
2 Hameed and Terry (1998) investigate the impact of tick size on price clustering on the Stock Exchange of Singapore (SES). Chung, Van Ness, and Van Ness (2004) examine quote clustering on the NYSE and NASDAQ after decimalization.
3 Other instructive explanations are also available, such as the collusion hypothesis (Christie and Schultz, 1994; Bessembinder, 1997), the human bias hypothesis (Kandel, Sarig, and Wohl, 2001; Brown, Chua, and Mitchell, 2002) and haziness and bounded rationality (Hornick, Cherianand, and Zakay, 1994)
.
4 Ahn, Cai, and Cheung (2005) argue that most transaction prices are outcomes from a trading process in which an investor who submits a market order accepts the price offered on the limit order book.
5 Mutual funds in this paper are formally called the securities investment trust companies and solely composed of domestic mutual-fund firms, while the foreign investors cover a wide variety of foreign institutions, including foreign (investment) banks, insurance companies, mutual funds, pension funds, hedge funds, and so on. The corporate institutions consist of all domestic institutional investors other than the domestic professional institutional investors, such as mutual funds and securities dealers.
intentions of investors’ order submissions as precisely as limit-order data.
More specifically, firstly, we document the clustering pattern of limit-order prices and its relation to tick size, price level, and price clustering. Secondly, we offer a first look at the clustering patterns of different order types marketable and non-
marketable limit orders to make inference about the information content they carry.
6Thirdly, among different groups of investors, we contrast their order submission behaviors attributable to price clustering. Fourthly, to understand whether investors are rational to use round prices, we compare the execution ratios of even- and odd-price limit orders conditional on order aggressiveness. Fifthly, we provide evidence on whether price clustering could generate price barriers which are difficult to penetrate.
Sixthly, we pay attention to whether and which investors (possibly knowing the existence of price clustering strategically) exhibit a front-running order submission behavior. Finally, we explicitly compare the price clustering patterns between the cases using quote, trade, and limit-order data.
This remaining paper proceeds as follows. Section 2 briefly reviews the institutional background of the TSE. Section 3 describes our datasets and methodology. Section 4 discusses empirical evidence of several essential issues associated with price clustering, thanks to our rich data. Finally, we conclude this paper in Section 5.
Institutional background
On the TSE, all listed securities are traded by auto-matching through a Fully Automated Securities Trading (FAST) system maintained by the Taiwan Stock Exchange Corporation. It is fully centralized, computerized, and order-driven, and its trading mechanism is similar to the electronic limit-order system in Hong Kong (Ahn, Bae, and Chan, 2001), except that the FAST is purely a call market system. There are no market orders. All orders are submitted in the form of a limit order that automatically expires at the end of each trading day. Investors demanding for immediacy are expected to submit marketable limit orders. No hidden order is allowed.
Trading on the TSE starts from 9:00 a.m. to 13:30 p.m., Monday through Friday.
6 The definition of a marketable limit order is identical to that in prior studies (e.g., Chiao, Wang, and Lai, 2007; Peterson and Sirri, 2002). Since there is neither pre-trade period nor order information disseminated before the opening auction, we regard the orders submitted before the opening as the marketable limit orders, if their buy (sell) prices are greater (less) than or equal to the corresponding preceding day’s closing prices. After the opening auction, a marketable buy (sell) order is a limit order whose limit price is greater (lower) than or equal to the concurrent best offer (bid) price.
Orders may be keyed-in 30 minutes prior to the opening. The price, conducted by a single-price auction, is the one maximizing trading volume. During the rest of trading day, the same call market matching protocol is adopted, and trades periodically take place for each stock about two times every 45 seconds. Limit orders are matched on a strict price and time priority basis. The orders not fully filled enter the limit order book and wait for a subsequent call. Information regarding the limit order book (over up to five best bid and ask queues) is disseminated to the public on a real-time basis.
Unlike a uniform tick size employed on the US markets where the tick size is invariant to stock price, the tick size on the TSE follows a step-function schedule of price levels. Although such a tick-size structure has been popularly employed in many financial markets (e.g., the Stock Exchange of Hong Kong, the Tokyo Stock Exchange, and the Swiss Exchange), existing evidence for the effectiveness of the step-function tick size system is relatively limited. In this paper, we shall compare clustering behavior over stocks with different tick sizes among different groups of investors. Additionally, as mentioned earlier, most of the literature employs trade or quote data to conduct similar research. Different from those studies, our datasets richly includes not only comprehensive intraday information on quotes, trades, and limit orders, but also precise investor classifications, which could greatly enhance the contributions of this paper to the literature.
Data and Methodology
The paper employs two datasets to gather all necessary information. The first dataset, maintained by the TEJ (Taiwan Economic Journal), comprises the daily stock trading information, including daily stock prices, returns, volumes, turnovers, and institutional ownership for all listed individual stocks. In addition, this dataset provides intraday quote information of each listed stock as well.
The quote data provide snapshots of the limit order book for each listed stock. It documents the time as well as bid (ask) information for five best bid (ask) queues at 20- 30 second intervals. The bid (ask) queues information includes the number of shares waiting to be executed at the best bid (ask) and at each of the four consecutive lower (higher) ticks.
The second dataset, obtained from the Taiwan Stock Exchange Corporation,
contains the intraday information on every original limit orders and trades through the
FAST system. Explicitly, for each order, our sample includes the time stamp (to the nearest one hundredth second), stock code, investor type, a buy-sell indicator, order size, and limit price. Odd-lot and bulk orders, separately drafted by the FAST, are excluded from our sample. Our data cover from 9/2005 to 5/2006, for a total of 183 trading days.
The trade data contain all transaction price and volume records, occurring on the TSE over the sample period, with a time stamp to the nearest hundredth second. Every transaction is linked to the underlying orders through an order ID, besides its reported trading volume and execution price. Thus, if a large order is executed against many smaller orders resulting in several smaller trades, we can trace each executed part back to the initial order.
1. Sample selection and the formation of trading cases
We filter securities based on the following criteria. First, only common stocks listed on the TSE are considered. Other securities, such as debt securities, rights, warrants, and preferred shares, are excluded. Second, we eliminate stocks paying stock dividends during our sample period, since it could change price behavior dramatically.
After applying these filters, we are left with 643 stocks over our 9-month sample period.
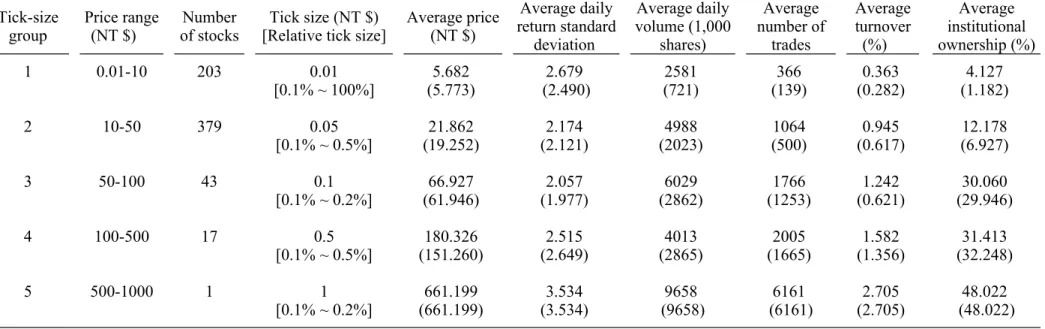
Thereafter, all eligible securities are divided into testable groups on the basis of the effective tick size which is a step-function schedule of price levels. Table 1 reports the complete list of the schedule. Tick-size groups 1, 2, 3, 4, and 5 are formed and
composed of stocks with tick sizes $0.01, $0.05, $0.1, $0.5, and $1, respectively. Since there are no stocks with prices over $1000 during the sample period, the group with tick size $5 is omitted. All eligible stocks are sorted into these five groups based on their average closing prices over the sample period. For these groups, the numbers of selected stocks are 203, 379, 43, 17, and 1, respectively, and most stocks (59%) are located in Tick-size group 2. Table 1 also provides the daily trading characteristics of each group.
We observe that the average number of trades, turnover, and the average daily volume are all the lowest in Tick-size group 1, implying that the low-priced stocks are relatively illiquid. Additionally, it is clear that the institutional ownership increases with respect to the tick size or stock price.
Since stock prices could fluctuate over time, many stocks are traded at more than
one tick-size group during the sample period. Instead of examining the clustering
pattern for 643 stocks, we adopt a trading-case approach similar to the one proposed by
Ahn, Cai, and Cheung (2005). One major difference from theirs results from the
employed data. Unlike their employed quote data reporting only the periodic
information of five best bid and ask queues, our limit-order data in a given day cover each stock’s orders, throughout that day, whose submitted prices are ranged over 7%
of the corresponding closing price on the preceding trading day.
7Any limit order submitted at a price beyond the regulatory range is unacceptable and regarded as invalid.
The detailed selection criteria to form trading cases are as follows. Firstly, to prevent noise in intraday measures from extremely illiquid stocks, if a stock has less than 50 transactions within a trading day, we eliminate the stock on that day from our sample. Secondly, to maintain the consistency of each trading case, we require at least 20 (not necessarily consecutive) trading days of valid daily price ranges within a particular tick-size group.
8As a whole, our sample consists of 649 trading cases of which 190, 383, 52, and 24 are categorized into Tick-size groups 1, 2, 3 and 4,
respectively.
9No trading case is applicable for the stock in the fifth tick-size group. For convenience, we further separate these trading cases into two classes based on the last digit of tick sizes. Class I includes the trading cases with a tick size of $0.01 or $0.1 while Class II $0.05 or $0.5. By comparing measures of price clustering across these different tick-size groups and classes, we can gain insight into the relation between tick size, price level, and price clustering.
2. The measures of price clustering
As mentioned earlier, price clustering, particularly at even and integer prices, has been widely documented in many financial markets. We expect no exception for the Taiwan stock market. First, we measure the occurrence of price clustering, using the abnormal frequencies for even and integer prices defined as the differences between the realized and expected frequencies. The frequency of even prices records the percentage frequency of prices ending at even multiples of the tick.
10Under the null hypothesis of no price clustering, the expected frequency of even prices is 0.5 for all tick-size groups.
7 The stock trading in Taiwan was subject to a regulatory price limit 7% over the sample period. For the detail, please see Chiao, Hung, and Lee (2004).
8 For example, the valid daily price ranges of a stock are under $10 for 63 trading days and between $10 and $20 for 42 days. For the rest of trading days, they lie between $9 and $11. Then, we can form 2 trading cases for this stock. The first trading case consists of 63 trading days within Tick-size group 1 and the other one contains 42 trading days within Tick-size group 2.
9According to definition, one stock may produce more than one trading case. In our sample, there are 62 stocks with 2 trading cases. For these trading cases from the same stock, the trading days are not
overlapping. Hence, there shall be no question of double counting.
10 Notice that even prices imply that prices are multiple(s) of 2 times the tick size, not necessarily divisible by 2 without rounding error.
We further define the abnormal even-price frequency as the sum of even-price
frequencies minus 0.5.
11On the other hand, the frequency of integer prices examines the percentage frequency of prices that end at a multiple of $0.1 ($1) for stocks with tick sizes of $0.01 or $0.05 ($0.1 or $0.5). Similarly, the null hypothesis of no clustering is that the expected frequency of integer prices is not different from 0.1 (0.5) for Class I (Class II) stocks. The abnormal even- and integer-price frequencies, calculated as the differences between the sum of integer-price frequencies and expected probability, are used to measure the existence of price clustering.
12Empirical evidence
1. Price clustering using the limit-order data
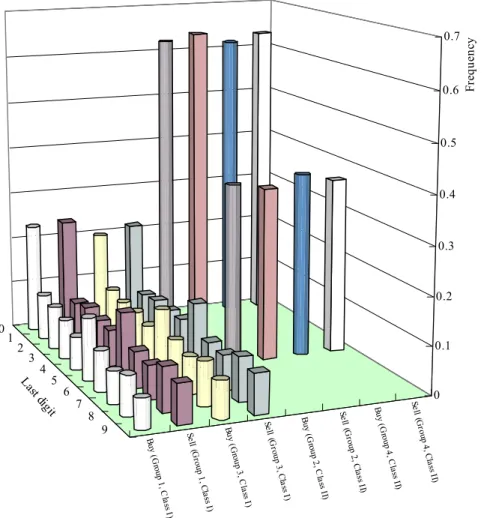
Figure 1 draws the frequency distributions of the limit orders at each tick increment within each class and tick-size group. Reported frequencies are computed over all orders for all eligible stocks, based on the last digit of order prices. It is ranged from 0 to 9 for Class I with stocks in Tick-size groups 1 and 3 of which the tick sizes are $0.01 and $0.1, respectively, whereas it is either 0 or 5 for Class II with stocks in Tick-size groups 2 and 4 of which the tick sizes are $0.05 and $0.5, respectively. The frequencies of buy (sell) orders are shown by cylinders (cuboids).
Under the null hypothesis of no clustering, the realized frequency is indifferent from the expected frequency that is 0.1 (0.5) at any last digit for Class I (II) stocks. As a result, the t statistic (not reported) of the frequency at every last digit is significant at the 1% level, clearly rejecting the null hypothesis. The highest proportion of submitted limit orders is at prices with a last digit of 0 in all classes, no matter what the tick size is. The second highest proportion of orders clusters at prices with a last digit of 5 in Class I, consistent with the attraction hypothesis that investors are attracted by certain integers like 0 and 5 (Goodhart and Curcio, 1991; Grossman et al., 1997). The even multiples of the tick size come next, followed by the odd multiples.
1311 For instance, the order price of a stock with tick size $0.01 is between $8 and $8.09 in a given day.
There are ten possible price levels, including $8.00, $8.01, …, and $8.09. Suppose that the realized frequencies for even prices, $8.00, $8.02, $8.04, $8.06, and $8.08, are 0.28, 0.07, 0.06, 0.06 and 0.08, respectively. Then abnormal even-price frequency is 0.05 (=0.28+0.07+0.06+006+0.08-0.5).
12 For example, the order price of a stock with a tick size of $0.01 is between $7.5 and $8.49 in a given day. Suppose that the realized frequency of prices ending at a multiple of $0.1 (i.e., $7.50, $7.60, $7.70,
…, and $8.40) are 0.21. Then, the abnormal integer-price frequency in this case is 0.11.
13 The other noteworthy observation is the asymmetric clustering pattern around the final digits of 0 and 5 for stocks in Tick-size groups 1 and 3. Take Tick-size group 3 as an example, the frequency of buy orders at the prices with final digit 9 is 0.075 while that at the prices with final digit 1 is 0.093. By contrast, the frequency of sell orders at the prices with final digit 9 is 0.083 and higher than that with final digit 1 (0.074). The phenomenon is preliminarily consistent with Ascioglu et al. (2007) who find evidence of strategic trading behavior on the Tokyo Stock Exchange. We will
After measuring the average daily clustering of each trading case, we calculate the volume-weighted average clustering for each class and tick-size group.
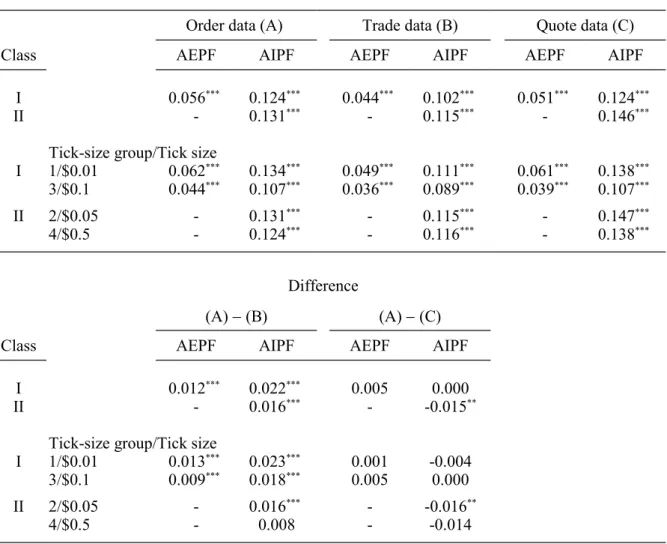
14Table 2 presents the results of price clustering using the limit-order data. Generally, stocks in all classes display highly significant clustering patterns. For instance, Class I stocks have the abnormal even- and integer-price frequencies of 0.056 and 0.124, respectively, significant at the 1% level. When further categorizing classes into four tick-size groups, we find still apparent the clustering at even and integer prices.
We now turn our attention to the relation between tick size, price level, and price clustering. First, the variation in clustering over four tick-size groups is not as obvious as the evidence for the U.S. markets (e.g., Harris, 1991; Cooney, Van Ness, and Van Ness, 2003). In terms of the abnormal integer-price frequency, the magnitudes are similar and around 10% across different price groups (i.e., tick-size groups). In a market with a uniform tick size, like U.S., the tick represents a smaller fraction of price for high-priced stocks than low-priced stocks, implying a larger set of possible price levels for high-priced stocks. To lower negotiation costs, traders would use more round numbers for these stocks. Hence, price clustering is the positive function of price levels. However, under the step-function tick schedule imposed on the TSE, the relative tick size (reported in table 1) is relatively constant across different price levels.
It is clear that the prevailing ticks, staying between 0.1% and 0.5% of the price for the majority of stocks,
15reduce the influence of relative tick size on price clustering.
Second, an extremely small tick size encourages investors to submit orders at round prices, increasing the degree of price clustering. Tick-size groups 1 and 3 demonstrate stronger clustering pattern within their respective classes. This pattern can not be attributable to smaller relative tick size, because as discussed earlier, the relative tick sizes are stable across different groups. Instead, the absolute tick size seems to play a role. When the regulatory tick size is so small that investors find it costly to deal with these tiny tick increments, they choose to round submission prices (Ball, Torous, and Tschoegl, 1985; Ahn, Cai, and Cheung, 2005). It suggests that an extremely small tick size restrains the price resolution process.
As to the abnormal frequency of even prices, we still observe that the clustering pattern does not increase with price levels (from Tick-size group 1 to group 4), although the abnormal frequency for Class I stocks is higher than that for Class II stocks.
pay attention to this issue in Section 4.4.3.
14 We also calculate the equally-weighted average clustering and have the similar results.
15 After excluding 19 stocks with average prices below $2, the relative tick size of the Class I stocks is between 0.1% and 0.5%.
Additionally, Tick-size groups 1 and 3 remain to exhibit the stronger clustering pattern within their respective classes. In summary, consistent with Ahn, Cai, and Cheung (2005), the absolute tick size, rather than the relative tick size, has more influence on the degree of price resolution in the market with a step-function tick schedule.
162. Price clustering, types of limit orders, and groups of investors (1)
Comparison between m arketable and non-marketable limit orders
In the sub-section, we shall compare the degree of price clustering across the different order types. According to demand for immediacy, the limit orders are sorted into marketable and non-marketable limit orders. A marketable limit buy (sell) order is immediately executable upon its receipt if the limit price is greater (lower) than or equal to the benchmark price. The benchmark price is designed to accommodate the
difference in the information dissemination practice before and after the opening auction. Before the opening auction, no order information is disseminated; afterwards information pertaining to the limit order book (over up to five best bid and ask queues) is disseminated to the public on a real-time basis. From the standpoint of investors, before the opening auction, the benchmark price of a selected stock is defined as its closing price on the preceding trading day (Chiao, Wang, and Lai, 2007). For a buy (sell) limit order submitted afterwards, the benchmark price is assigned to the prevailing best ask (bid) price. Traders seeking immediacy tend to use the marketable limit orders, while patient traders submit non-marketable limit orders.
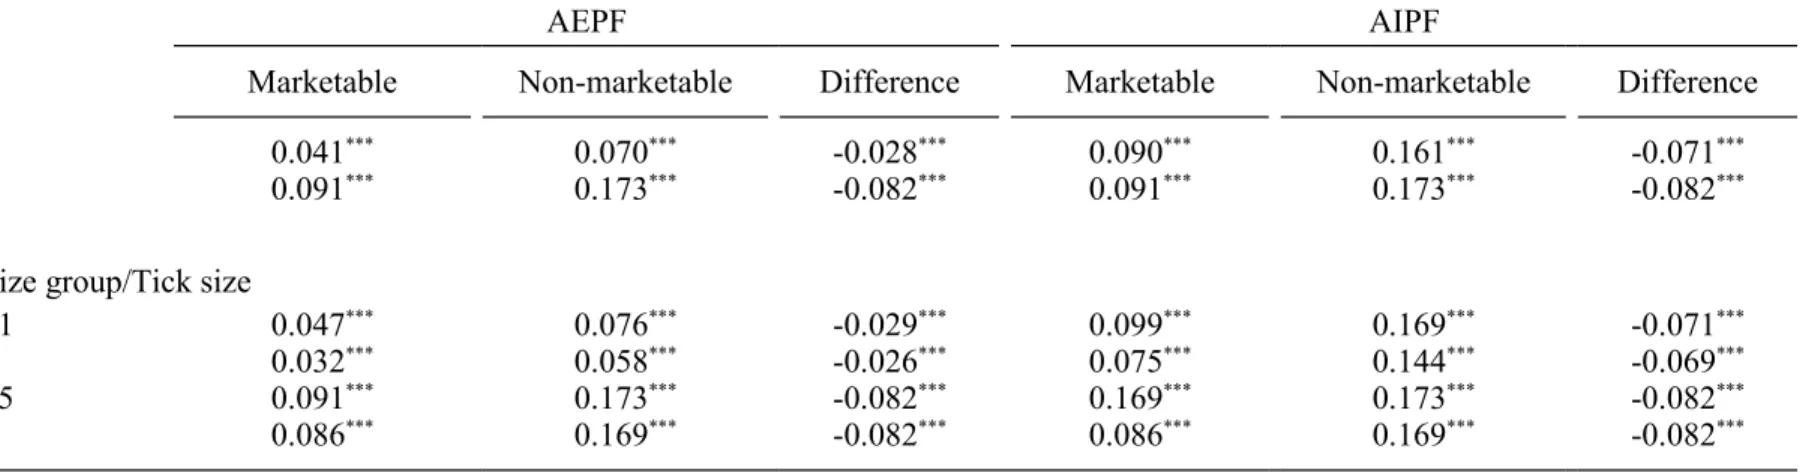
Table 3 records the price clustering patterns, measured by the abnormal price frequencies, of marketable and non-marketable limit orders for stocks in the two classes and the four tick-size groups. We observe that no matter in terms of the abnormal even- or integer-price frequency, price clustering of all order types well exists. More
importantly, the clustering pattern of marketable limit orders is not as strong as that of non-marketable limit orders for stocks in both classes. For instance, the abnormal integer-price (even-price) frequencies of marketable and non-marketable limit orders for Class I stocks are respectively 0.090 and 0.161 (0.041 and 0.070) and significant at the 1% level. The differences in the abnormal price frequencies between marketable and non-marketable limit orders are all significantly negative. Even from the angle of the four tick-size groups, price clustering of non-marketable limit orders remains more noticeable, indicating that patient traders tend to prefer round numbers more than
16 As discussed in the Introduction section, most papers make their conclusions by using quote ad trade data, and very limited papers pay attention to the order price clustering. In Section 4.5, we will revisit table 2 to compare price clustering among the cases using quote, trade, and limit-order data.
aggressive traders.
Theoretical models on market microstructure usually assume that informed traders tend to submit market orders instead of limit orders (e.g., Glosten, 1994; Seppi, 1997).
Recently, the related literature has begun studying the strategic trading tradeoffs between placing market orders and limit orders, arguing that informed traders strategically choose order type and use limit orders actively (e.g., Cooney and Sias, 2004; Kadan, and Kandel, 2005; Bloomfield, O’Hara, and Saar, 2005). One possible implication is that the less aggressive limit order also has information content. Our evidence indicates that price clustering of non-marketable limit orders is stronger. If taking price clustering as a proxy for the value uncertainty, as suggested by Ball, Torous, and Tschoegl (1985), then marketable limit orders can be argued to embed more information about firms’ fundamental values than non-marketable limit orders. It suggests that the more aggressively the limit orders are submitted, the more information they carry.
(2)
Comparison among different groups of investors
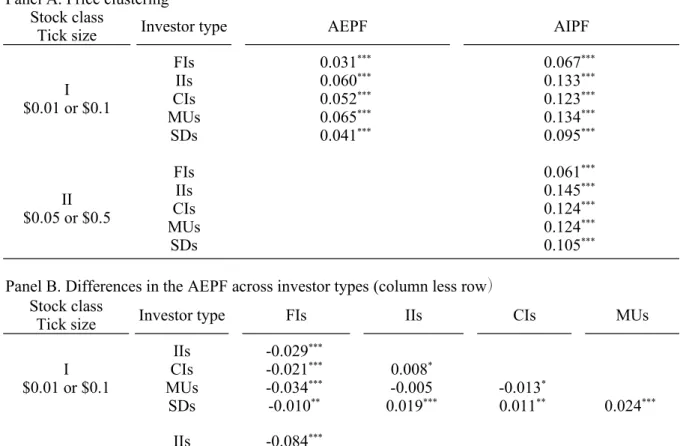
One of noticeable features of this paper is the employed limit-order data that are able to unambiguously classify all limit orders into five groups of investors, including foreign investors, mutual funds, securities dealers, individual investors, and corporate institutions. While institutions are often considered informed, active, and influential traders and their trading contributes more to price discovery (O’Neill and Swisher, 2003), whether institutions’ orders are consistent with their argument and demonstrate less degree of price clustering is of interest in this sub-section. The classification of investors’ limit orders can help us verify separately their roles in forming the observed clustering patterns. Table 4 reports the degrees of price clustering of orders submitted by different groups of investors in Panel A and pairwise comparisons between them in Panels B and C.
As a result, in Panel A in terms of the abnormal even- or integer-price frequencies, all groups of investors prefer to submit orders at even and integer prices, regardless of tick sizes. All statistics are significant at the 1% level. Panels B and C give the
differences (column less row) in the abnormal even- and integer-price frequencies
between different groups of investors, respectively. It is quite obvious that the statistics
reported in the column labeled “FIs” (foreign investors) are all significantly negative at
the 1% level, implying that limit orders submitted by foreign investors cluster the least
at the even and integer prices among five groups of investors in all classes and tick-size
groups. According to the statistics reported in the column labeled “SD”, securities dealers are the second least group. Individual investors and mutual funds demonstrate the strongest tendency to submit limit orders at round prices.
It is not surprising that foreign investors’ limit orders exhibit less price clustering.
In a market full of individual investors, institutional investors are often regarded as informed traders on account of their ability to collect and process information more efficiently than individual investors. Because possibly knowing more assets’ underlying value, institutions tend to submit orders at more precise prices, reducing price
clustering. Additionally, foreign investors’ limit orders also display the least price clustering among professional institutions. Although it is controversial whether domestic investors are better infotmed than foreign investors (e.g., Brennan and Cao, 1997; Seasholes, 2004), we could indirectly infer that foreign investors have more information advantage, in terms of the level of price precision as a proxy of the amount of information.
3. Determinants of order price clustering
Harris (1991) suggests that price clustering (positively) relates to the dispersion in traders’ reservation prices, which is itself likely to depend (positively) on volatility and extent of information asymmetries. Although the TSE is a pure order-driven market without designated market makers and there is no explicit negotiation over the
transaction price, the intuition provided by Harris (1991) should also be applied to limit orders thereon. In this section, similar to Ahn, Cai, and Cheung (2005) and Harris (1991), we conduct multivariate regressions of abnormal price frequencies at order prices on firm-specific characteristics to explore the cross-sectional determinants of order price clustering for stocks in all classes. The following three explanatory variables are applied to proxy for the unobserved degree of reservation price dispersion: the natural log of market capitalization (ln(mv)), the natural log of daily number of orders (ln(no)), and the inverse of the daily return standard deviation (1/volat).
According to Harris (1991), greater reservation price dispersion is expected with
lower values of ln(mv), ln((no), and 1/volat. Besides, Harris argues a positive relation
between price clustering and price level. Under the assumption that investors form their
price sets using a constant fraction around the stock price, the tick is a larger fraction of
low-priced stocks than high-priced stocks. Therefore, the prices for high-priced stocks
will cluster more as investors try to lower negotiation costs. We also include two firm-
specific variables the natural log of daily order volume (ln(vom)) and the natural log
of average order size (ln(os)) as alternatives to ln((no) to capture the influence of trading activity on price clustering. The daily order volume is similar to the essence of the daily number of transactions employed by Harris (1991). Concerning the average order size, Lin, Sanger, and Booth (1995) and Huang and Stoll (1997) find that adverse- selection spread measures increase with raw trade size, so that the raw size of the trade can indicate the probability of informed trading. Since transaction records are outcomes from a trading process in which an investor who submits a marketable limit order accepts the price offered on the limit order book, the trade size should tightly track the order size. If the order size can be regarded as a proxy for informed trading, the reservation price dispersion should be negatively related to (ln(os)).
Three additional independent variables are employed. First, the average daily institutional ownership (ratio), proxying for visibility of the selected firm, acts as a complement to Harris’ proxies for the reservation price dispersion. It is also designed to accommodate the growing visibility, due to the fast internationalization of the TSE. It is expected that the higher the visibility of a firm and the less uncertain its fundamental value, the higher the institutional ownership.
17The second and the third variables are two dummy variables, D_tick and D_mkb, used to distinguish the tick-size groups and the types of limit orders, respectively.
D_tick takes the value of 1 if the selected stock belongs to Class I (II) and has the tick
size of $0.1 ($0.5), and 0 otherwise. The variable of ln(p) captures the relative tick-size effect on the clustering pattern within each class, while D_tick -dummy results show the absolute tick-size effect between the tick-size groups within each stock class. Another variable, D_mkb, takes the value of 1 if the order is a marketable limit order, and 0 otherwise. It estimates the difference in price clustering between marketable and non- marketable limit orders.
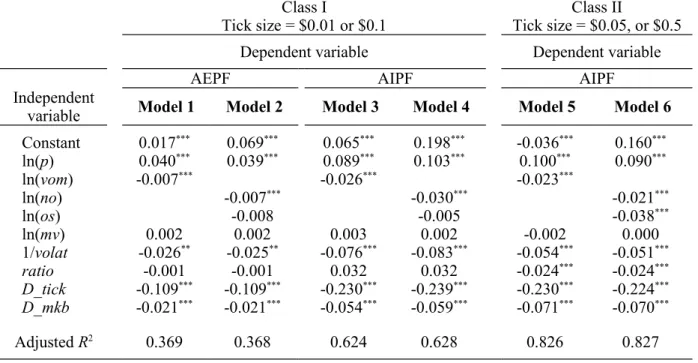
Table 5 lists the coefficients from the cross-sectional OLS regressions for stocks in each class. Generally, most regression results are in line with the essence of the
negotiation hypothesis. The coefficients on ln(p) are all significantly positive at the 1%
level while those on (1/volat) are mostly significantly negative at the 5% level, implying that stock price clustering indeed increases with price level and return volatility. The daily number of orders (ln(no)) bears significantly negative signs, showing that frequently traded firms may have less information asymmetry and there is less
17 Falkenstein (1996) finds that U.S. mutual funds have a significant preference towards stocks with high visibility. Boehmer and Kelly (2005) and Brennan and Subrahmanyam (1995) suggest that greater institutional ownership is associated with greater relative efficiency. Prices of stocks with more institutional ownership tend to move closer to fundamental values.
dispersion in the investors’ reservation prices. As a result, order prices will display less clustering. The pair of alternatives ln(vom) and ln(os) to ln(no) also provide similarly convincing explanation for price clustering. Both variables are negatively related to price clustering, although the coefficients on (ln(os)) are significant only for Class II stocks. The result suggests that traders submitting orders with larger sizes tend to use more refined prices, consistent with the findings by Ahn, Cai, and Cheung (2005).
The three additional variables, ratio, D_tick, and D_mkb, also play important roles.
First, ratio exerts a significantly negative influence on the order price clustering for Class II stocks, showing that the institutional ownership reduces information
asymmetry. The coefficients on D_tick are all significantly negative at the 1% level, implying that the absolute tick size is a crucial determinant of order price clustering, even after controlling for other variables. This result is in line with the observed pattern in table 2, where the finer the tick size, the stronger the order prices cluster. Finally, it is clear that the role of D_mkb is negative and significant at the 1% level. This indicates that investors using the marketable limit orders have more information about firms’
fundamental values and use less a coarse set of price after controlling for firm-specific characteristics.
4. The influence of price clustering
After exploring the determinants of price clustering, in this subsection, we shall discuss the possible influences resulting from price clustering. First, even though price clustering seems to be inconsistent with the efficient market hypothesis it is not
necessarily at odds with economic rationality. We will discuss this issue by comparing the execution ratios of limit orders at the odd- and even-prices. Second, the limit order clustering at round prices result in excessive depth at these prices, perhaps acting as price barriers such as resistance or support levels which are difficult to penetrate. This paper would examine whether price clustering leads to the existence of price barriers.
Finally, we investigate whether some traders who anticipate the clustering tendency attempt to step ahead of limit orders congestion and assure faster executions, claimed by Niederhoffer (1965) and Ascioglu et al. (2007).
(1) The execution ratio
Since investors appear to prefer even prices, it is of interest whether the higher
frequency of even-price limit orders induces execution ratios to be lower for even-price limit orders than for odd-price limit orders. In this sub-section, we would examine whether investors choosing even-price limit orders are penalized by lower execution ratios on the TSE. This issue is motivated by Cooney, Van Ness, and Van Ness (2003), observing that the execution ratios of even-price limit orders exceed those of odd-price limit orders. They further propose possible explanation from Harris’ negotiation hypothesis, arguing that investors might rationally use round prices to increase the probability of finding market participants willing to take the other side of the trade. The number of investors willing to transact at round prices will be high (low) when there is a wide (small) dispersion in investors’ reservation prices. Due to rational use of even prices, the execution ratios of even-price limit orders is not lower.
On the other hand, it also seems reasonable that, other things equal, the number of executed even-price limit orders is the same as that of executed odd-price limit orders.
Since investors place more even-price limit orders, the proportion of executed even- price limit orders should be lower than that of executed odd-price limit orders. Since the execution ratio is positively related to order aggressiveness (i.e., demand for
immediacy), this paper will examine the execution ratio conditioned on order aggressiveness. The null hypothesis is that conditional on the same degree of order aggressiveness, the execution ratio of even-price limit orders is lower than that of odd- price limit orders.
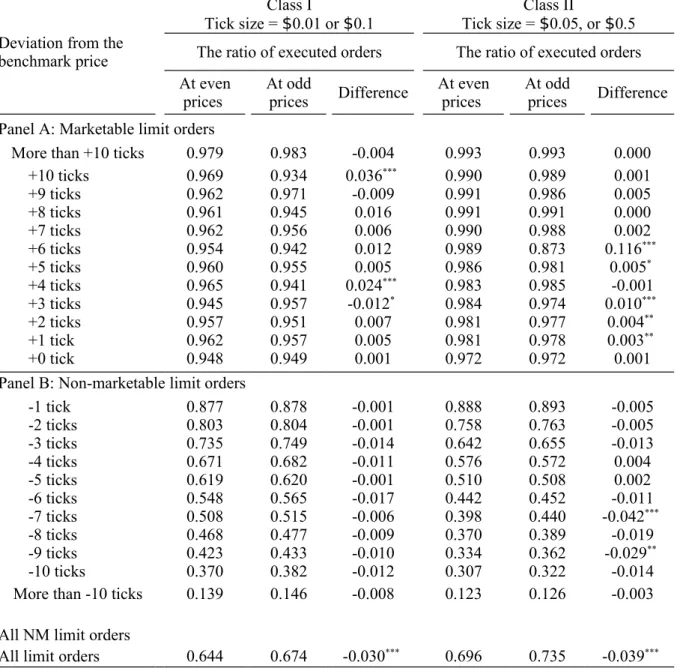
The execution ratio at a given price is defined as the ratio of the executed order volume to the submitted order volume at that price. Table 6 records the execution ratios of limit orders, including marketable and non-marketable limit orders in Panels A and B, respectively, with different aggressiveness at even and odd prices. Those ratios are reported for all valid prices, expressed as the numbers of ticks away from the
benchmark price. For instance, “-2 ticks” represents a price lower than the benchmark price by two ticks. The definition of benchmark price of a selected stock is the same as mentioned in section 4.2.1. The samples of marketable (non-marketable) limit orders are separately divided into 12 (11) sub-samples based on the position relative to the benchmark price. Due to the similarity, the execution ratios of sell limit orders are not reported and available upon requests.
Generally, the execution ratio is a positive function of order aggressiveness as
mentioned earlier, since the execution ratio is increasing with respect to the buy limit
price. Regardless of stock classes, the execution ratios are significantly higher for all
odd-price limit orders. However, after controlling for order aggressiveness, the
differences in execution ratios between even- and odd-price limit orders are almost insignificant, indicating that the null hypothesis is rejected. Specifically, limited evidence supports that even-price limit orders are executed less frequently than odd- price limit orders. Even at some even price points, investors gain better execution probabilities.
Taking Class I stocks as an example, the execution ratio of even- and odd-price limit orders at four ticks above the benchmark price are 0.965 and 0.941, respectively.
The difference in execution ratio is significantly positive at the 1% level. Recall that this paper has provided empirical evidence supporting Harris’ negotiation hypothesis in section 4.3, implying that whether traders on the TSE use the round prices depends on stock price levels and the dispersion of investors’ reservation prices. In summary, in line with the argument from Cooney, Van Ness, and Van Ness (2003), we find that investors on the TSE are not irrational when submitting even-price limit orders so that they do not face the problem of lower execution ratio.
(2) The price barrier
Niederhoffer (1965) argues that the limit orders clustering on round prices result in
excessive depth at these prices, perhaps acting as price barriers such as resistance or support levels which are difficult to penetrate. Since more trading volume is necessary to push a stock price through these prices than any of others, if the buy (sell) pressure is not so sufficient that price trends may be stopped or even reverse when hitting these round prices. Osler (2000) shows that on the Forex, 70% of published support and resistance levels are prices with a last digit of 0. Kavajecz and Odder-White (2004) document that price reversals are likely near points of high excessive depth on the limit order book. In the following section, we would examine whether limit order clustering points act as barriers to continued price movement.
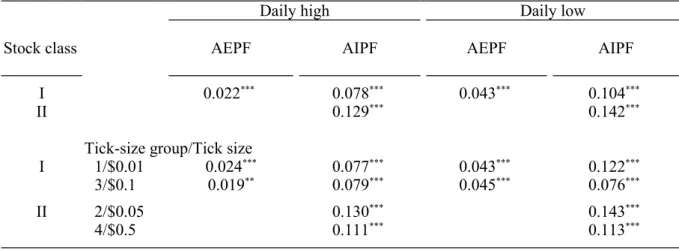
The high and low are respectively the upper and lower price level observed for any stock during a trading day. If clustering at the even- and integer-price leads to price barrier, the even- and integer-price frequencies of the daily high and low are expected to deviate from a uniform distribution. Table 7 reports the price-clustering patterns of daily high and low prices for stocks in the two classes and the four tick-size groups.
As expected, regardless of the tick sizes, the abnormal even- and integer-price
frequencies of the daily highs and lows are significantly positive. For example, their
abnormal integer-price (even-price) frequencies for Class I stocks are 0.078 and 0.104
(0.022 and 0.043), respectively, and significant at the 1% level. In agreement with the
analysis of Osborne (1962) and Osler (2003), these results indicate that clustering of individual stock prices, caused by relatively many limit orders at round numbers, may result in the emergence of resistance or support points at these numbers that are sometimes not easily penetrated.
(3) S trategic trading front running
Osler (2003) supports that price clustering results from the fact that investors prefer certain numbers for behavioral reasons, or that investors choose round numbers to minimize time and error in their communication with dealers. Even though price clustering at round numbers provides little information about underlying fundamentals, it may be plausible to consider the possibility that some irrational investors trade based upon these round number signals. However, it could be rational for others to do so or even not to do so, given that they are familiar with the price clustering patterns at even and integer prices. Niederhoffer (1965) suggests that an asymmetry may exist between bid and ask quotes owing to strategic price setting by traders trying to capitalize on opportunities resulting from price clustering.
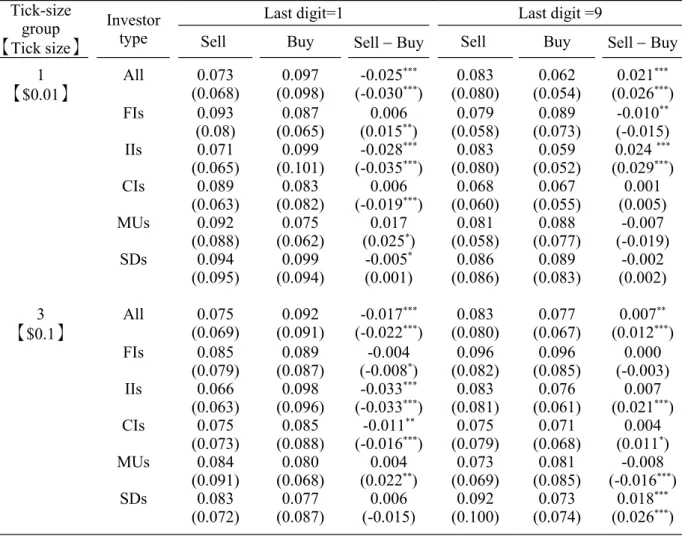
Recall that the asymmetric clustering patterns are observed around last digits of 0 and 5 for stocks in Tick-size groups 1 and 3. Ascioglu et al. (2007) show that investors submit orders with one tick better than 0 and 5 to avoid queuing orders at prices ending at these digits. From another angle, these investors try to strategically front run the investors submitting orders at round prices. Namely, if price clustering exists, some traders who anticipate the clustering tendency may attempt to step ahead of limit orders congestion to assure faster executions. To versify the existence of this strategic behavior in the TSE, table 8 explicitly reports the percentages of sell and buy order volume, in number of shares, at one tick above and one tick below integer prices.
It is rather clear from the table that, without distinguishing the groups of investors, at one tick above integer prices (at $0.1 or $0.01) the buy order volumes are
significantly greater than the sell order volumes at the 1% level for both mean and median tests. By contrast, at one tick below integer prices (at $0.9 or $0.09) the sell order volumes significantly exceed the buy order volumes. The documented statistics, consistent with Niederhoffer (1965) and Ascioglu et al. (2007), provide robust evidence for the strategic order submission behavior of investors. That is, knowing that there will be concentration of limit orders at integer prices, some investors place their orders one price tick better to gain price priority.
Furthermore, it is rather interesting whether the five groups of investors behave
differently in the front-running tendency. Since the depth of integer prices is thicker as mentioned earlier, the tendency of front-running around integer prices is expected to be stronger. Hence, we focus mainly on stocks in Tick-size groups 1 and 3, with a tick size of $0.01 or $0.1, respectively. As a result, it is worth noting that individual investors demonstrate the strongest strategic tendency of front-running. All their differences (Sell
Buy) share the same signs with those using all limit orders and are significant at the 1% level, with an exception of the insignificant mean of the stocks with order prices at one tick below integer prices (a tick size of $0.1 and a last digit of 9). Among
institutional investors, the front-running tendency of foreign investors is the least obvious. Their differences are either insignificant or have the signs opposite to those of all limit orders. The results on other institutional investors are mixed.
5. Comparisons among the cases using quote, trade, and limit-order data
Motivated by the fact that most literature employs trade and quote data to illustrate price clustering, before closing this section, we would like to take advantage of the completeness of our data and study the differences in price clustering between these applications. Explicitly, we attempt to contrast our results using the limit-order data with those using the quote and trade data. Although price clustering of trades and quotes both can be largely attributed to investors’ preference for round prices, we regard that neither trade nor quote data are able to completely reflect the true order submission behavior of investors, compared to limit-order data. In fact, execution prices act as the
ex-post realizations rather than the ex-ante intentions of investors, because executionprices may not be equal to the submitted order prices. Most transaction prices are outcomes from a trading process in which an investor who submits a market order (or marketable limit order) accepts the price offered on the limit order book. Furthermore, the observed clustering using trade data cannot cover the part of limit orders not executed. To solve the problem, Ahn, Cai, and Cheung (2005) employ quote data to study how quote prices cluster over a maximum of five queues on the limit order book.
However, in this paper, we argue that even quote data are also incapable of capturing the ex-ante intentions of investors as precisely as limit-order data.
For instance, two potential problems associated with the incompleteness of quote
data are as follows. First, quote data are often collected from a real-time trading screen
that typically shows the latest transaction prices and trading volumes of executed orders
as well as prices and pending order volumes at displayed queues. They act like periodic
snapshots of a part of limit order book close to the best queues rather than a
chronological record of order flows over the entire limit order book.
18Furthermore, if the interval between snapshots (e.g., 30 seconds in Hong Kong and 20-30 seconds in Taiwan) is too long, it is possible that the information of many limit orders (particularly marketable limit orders) submitted and executed during the same interval is not
displayed. The longer the sampling interval, the more the information about executed orders during the interval is missing.
Second, some order information, e.g., pending limit orders beyond the five best bid and ask queues in the cases of Hong Kong and Taiwan, are neither displayed nor recorded. Even as observed by Ahn, Cai, and Cheung (2005), quote prices in deeper queues cluster more. Hence, it is unsure that the unrevealed orders (far away from the best quotes) demonstrate a systematic tendency to price clustering, which could make the results using quote data biased. Overall, these two problems arouse the concern that quote data covering only a partial set of limit orders may incompletely address the pattern of price clustering on the limit order book.
Cooney, Van Ness, and Van Ness (2003) employ the TORQ database for the NYSE to study whether investors prefer even-eighth prices. However, because of the data limitation, first, the authors consider only electronic limit orders submitted through SuperDOT, OARS, and ITS, instead of all limit orders on the selected stocks. Second, investors submitting orders through these electronic trading systems may behave differently from those through traditional trading systems.
19Third, as argued by Koski and Scruggs (1998), the investor classifications by the TORQ are neither precise nor complete
20. Unlike their data, our data not only cover entire trades, quotes, and orders on the TSE, but also provide the official classification of the five groups of investors.
The quality of our data is believed better.
Turing back to Table 2, in terms of the abnormal frequency, it also reports the price clustering patterns using quote and trade data and compares their differences from that using limit-order data. As observed pattern earlier, first, there is clear evidence of price clustering using quote and trade data, regardless of stock classes and tick-size groups.
For example, using the quote (trade) data, the abnormal even- and integer-price
18 Even if a trading screen disseminates the trading information to the market in a real time manner, its compiled quote data by venders may not record the information as frequently as it should be.
19 For example, the data would not include standing orders by floor brokers to buy or sell stock at a certain price. Sofianos and Werner (2000) examine trading activity of NYSE floor brokers and find that floor broker participation is as high as 44%. They conclude it is misleading to make inferences
concerning liquidity using only SOD and TAQ. Therefore, we argue that the observed price clustering with electronic limit orders not necessarily applies to orders made by floor brokers.
20 The TORQ designation “individual investor” is somewhat misleading because it includes not only individual investors but also taxable corporations and non-taxable corporations (such as pension funds).
Furthermore, some limit orders can’t be identified as which of the investor types.
frequencies are 0.051 and 0.124 (0.044 and 0.102), respectively, for the Class I stocks.
Second, using the trade data, the clustering pattern is significantly smaller than that using the order data. For instance, the differences in the abnormal even- and integer- price frequency between the order and trade data are 0.012 and 0.022, all significant at the 1% level. Relative to the abnormal even- and integer-price frequencies using limit- order data, those using trade data are under-estimated by 21.4% (=0.012/0.056) and 17.7% (=0.022/0.124), respectively.
In addition, the differences in the abnormal even- and integer-price frequencies between the limit-order and the quote data are not as obvious. For instance, for Class I stocks, the differences in the abnormal even-price frequency are positive but
insignificant, while those in the abnormal integer-price frequency are mixed. For Class II stocks, the differences in the abnormal integer-price frequency are negative and mostly significant at the 5% level. Albeit we have not observed the results as solid as the cases between the limit-order and the trade data, our consideration about the possible pitfalls of the applications of quote data should still be worth being examined in other markets. Given the evidence above, the degree of price clustering using trade data is possibly underestimated.
Concluding remarks
Price clustering, a well prevailing tendency for prices to fall more frequently on certain values than on others (Harris, 1991), has been widely documented in major financial markets. Unlike mostly prior studies employing trade and quote data, this paper applies mainly the limit-order data, along with the quote and trade data, for the TSE to explore the existence of clustering patterns of the limit order prices, a pure order-driven and call market without designated market makers. In addition, we examine the relation between price clustering and the order submission behaviors of five groups of investors, including foreign investors, corporate institutions, mutual funds, securities dealers, and individual investors, trading on the TSE.
As a result, firstly, using limit-order data, we observe solid evidence for price clustering of limit orders submitted at even and integer prices. The absolute tick size, rather than the relative tick size, has more influence on the degree of price resolution in the market with a step-function tick schedule. Secondly, the submitted prices of
marketable limit orders cluster less than those of non-marketable limit orders, indicating
that aggressive (marketable) limit orders generally embed more information. Thirdly,
among different groups of investors, our evidence shows that individual investors and mutual funds demonstrate the strongest tendency for order price clustering at even and integer prices, while foreign investors do the least. Fourthly, most results of our
regression analysis are generally in line with the essence of the negotiation hypothesis.
In addition, the institutional ownership as an additional proxy for visibility exerts a negative influence on the observed price clustering. Smaller tick size increases price clustering, even after controlling for the firm-specific characteristics. Fifthly, investors, submitting even-price limit orders, do not suffer from lower execution rates. Sixthly, price lustering leads to price barriers such as support or resistance levels which are difficult to penetrate. Recognizing the existence of price clustering, individual investors show the strongest strategic tendency of front-running while foreign investors do the least. Finally, through the comparisons of price clustering between the cases using quote, trade, and limit-order data, we find that price clustering is possibly
underestimated for the case using trade data.
Thanks to the richness of our data, our contributions can be primarily placed on the
price clustering patterns illustrated between different groups of investors, between
different types of limit orders, and between the cases employing different data on a pure
order-driven and call market. Our application provides investors and economists with a
fresher look at price clustering. Although the TSE is known for its fast growing and
institutionalizing properties, it is still dominated by individual investors. Given the prior
documented behavioral differences between individual and institutions and different
motives between the submissions of marketable and non-marketable limit orders, it is
rather valuable to do the similar analyses for other developed and institution-dominated
markets.
References
Ahn, H., J. Cai, and Y.L. Cheung, 2005. Price clustering on the limit-order book: Evidence from the Stock Exchange of Hong Kong. Journal of
Financial Markets 8, 421-451
Aitken, M., P. Brown, C. Buckland, H. Yzan, and T. Walter, 1996. Price clustering on the Australian Stock Exchange. Pacific-Basin Finance Journal 4, 297-314.
ap Gwilym, O., A. Clare, and S. Thomas, 1998. Extreme price clustering in the London equity index futures and options markets. Journal of Banking and Finance 22, 1193-1206.
Asçioglu, A., C. Comerton-Forde, and T. McInish, 2007. Price clustering on the Tokyo Stock Exchange. Financial Review 42, 289-301,
Ball, C., W. Torous, and A. Tschoegl, 1985. The degree of price resolution:
The case of the gold market. Journal of Futures Markets 5, 29-43.
Bessembinder, H., 1997. The degree of price resolution and equity trading cost, Journal of Financial Economics 45, 9-34.
Bloomfield, R., M. O’Hara, and G. Saar, 2005. The ‘make or take’ decision in an electronic market: evidence on the evolution of liquidity, Journal of Financial Economics 75, 165-200.
Boehmer, K. and E. Kelly, 2005. Institutional investors and informational efficiency of prices. Unpublished manuscript, University of A&M, Texas.
Bollen, N., T. Smith, and R.E. Whaley, 2003. Optimal contract design: For whom? Journal of Futures Markets 23, 719-750.
Brennan, M.J. and A. Subrahmanyam, 1995. Investment analysis and price formation in securities markets. Journal of Financial Economics 38, 361- 382.
Brennan, M. and H. Cao, 1997. International portfolio investment flows.
Journal of Finance 52, 1851-1880.
Brown, P., A. Chua, and J. Mitchell, 2002. The influence of cultural factors on price clustering: evidence from Asia-Pacific stock markets. Pacific- Basin Finance Journal 10, 307–332.
Chung, H. and S. Chiang , 2006. Price clustering in e-mini and floor-traded
index futures. Journal of Futures Markets 26, 269-295.
Chiao, C., K. Hung, and C.F. Lee, 2004. The price adjustment and lead-lag relations between stock returns: microstructure evidence from the Taiwan stock market. Journal of Empirical Finance 11, 709-731.
Chiao, C., Z. Wang, and H. Lai, 2007. Order submission behaviors and opening price behaviors in the Taiwan Stock Market. Unpublished manuscript, National Dong Hwa University.
Christie, W.G., and P.H. Schultz, 1994. Why do NASDAQ market makers avoid odd-eighth quotes? Journal of Finance 49, 1813-1840.
Chung, K.H., K.A. Kim, and P. Kitsabunnarat, 2005. Liquidity and quote clustering in a market with multiple tick sizes. Journal of Financial Research 28, 177-195.
Chung, K.H., B.F. Van Ness, and R.A. Van Ness, 2004. Trading costs and quote clustering on the NYSE and Nasdaq after decimalization. Journal of Financial Research 32, 309-328.
Cooney, J.W. Jr., and R. W. Sias, 2004. Informed trading and order type.
Journal of Banking and Finance 28, 1711-1743.
Cooney, J.W. Jr., B.F. Van Ness, and R.A. Van Ness, 2003. Do investors prefer even-eighth prices? Evidence from NYSE limit orders. Journal of Banking and Finance 27, 719-748.
Falkenstein, E., 1996. Preferences for stock characteristics as revealed by mutual fund portfolio holdings. Journal of Finance 51, 111-135.
Glosten, L.R., 1994. Is the electronic open limit order book inevitable?
Journal of Finance 49, 1127-1161.
Goodhart, C. and R. Curcio, 1991. The clustering of bid-ask prices and the spread in the foreign exchange market. London School of Economics, Discussion Paper 110.
Grossman, S.J., M.H. Miller, K.R. Cone, D.R. Fischel, and D.J. Ross, 1997. Clustering and competition in asset markets. Journal of Law and Economics 40, 23-60.
Hameed, A. and E. Terry, 1998. The effect of tick size on price clustering and trading volume. Journal of Business Finance and Accounting 25, 849- 867.
Harris, L., 1991. Stock price clustering and discreteness. Review of Financial Studies 4, 389-415.
Harrison, M., 1994. Asia-Pacific securities markets, 2nd ed. Hong Kong:
Longman.
Hornick, J., J. Cherianand, and D. Zakay, 1994. The influence of prototypic values on the validity of studies using time estimates. Journal of Market Research Society 36, 145-147.
Huang, R. and H. Stoll, 1997. The components of the bid-ask spread: A general approach. Review of Financial Studies 7, 995–1034.
Kahn, C., G. Pennachi, and B. Sopranzetti, 1999. Bank deposit rate clustering: Theory and empirical evidence. Journal of Finance 54, 2185- 2214.
Kandel, S., O. Sarig, and A. Wohl, 2001. Do investors prefer round stock prices? Evidence from Israeli IPO auctions, Journal of Banking and Finance 25, 1543-1551.
Kavajecz, K. and E. Odder-White, 2004. Technical analysis and liquidity provision. The Review of Financial Studies 17(4), 1043-1071.
Koski, J.L., J.T. Scruggs, 1998. Who trades around the ex-dividend day?
Evidence from NYSE audit file data. Financial Management 27, 58-72.
Lin, J., G. Sanger, and G. G. Booth, 1995. Trade size and components of the bid ask spread. Review of Financial Studies 8, 1153–83.
Niederhoffer, V.B, 1965. Clustering of stock prices. Operations Research 13, 258–265.
Ohta, W., 2006. An analysis of intraday patterns in price clustering on the Tokyo Stock Exchange. Journal of Banking and Finance 30, 1023-1039.
O’Neill, M. and J. Swisherm, 2003. Institutional investors and information asymmetry: An event study of self-tender offers. Financial Review 38, 197- 211.
Osborne, M.F.M., 1962. Periodic structure in the Brownian motion of stock prices. Operations Research 10, 345-379.
Osler, C.L., 2003. Currency orders and exchange rate dynamics: An
explanation for the predictive success of technical analysis. Journal of Finance 58, 1791-1820.
Peterson, M. and E. Sirri, 2002. Order submission strategy and the curious case of marketable limit orders. Journal of Financial and Quantitative Analysis 37, 221-241.
Seasholes, M., 2004. Re-examining Information Asymmetries in Emerging Markets. working paper, Haas School of Business, University of California, Berkeley.
Seppi, D.J., 1997. Liquidity provision with limit orders and a strategic specialist. Review of Financial Studies 10, 103-150.
Schwartz, R.A. and J.E. Shapiro, 1992. The challenge of
institutionalization for the equity market, in: Recent Development in
Finance: Conference in Honor of Arnold Sametz, A. Saunders, New York:
New York University Salomon Center.
Schwartz, A., B.F. Van Ness and R.A. Ness, 2004. Clustering in the futures market: Evidence from S&P 500 futures contracts. Journal of Futures Markets 24, 413-428
Shiller, R., 2000. Irrational Exuberance. Princeton: Princeton University Press.
Sofianos, G., and I. Werner, 2000. The trades of NYSE floor brokers.
Journal of Financial Markets 3, 139-176.
Sonnemans, J., 2003. Price clustering and natural resistance points in the Dutch Stock Market: A natural experiment. Discussion Paper. University of Amsterdam.
Sopranzetti, Ben J. and Vinay Datar, 2002. Price clustering in foreign exchange spot markets. Journal of Financial Markets 5, 411-417.
Table 1. Summary statistics
This table reports summary statistics for 643 common stocks listed on the TSE from 9/2005 to 5/2006, for a total of 183 trading days. For each tick-size group, the means and medians (in parentheses) of average stock price, daily return standard deviation, average daily volume, average daily number of trades, average turnover and average institutional ownership are calculated. All averages are equally weighted.
Tick-size
group Price range
(NT $) Number
of stocks Tick size (NT $)
[Relative tick size] Average price (NT $)
Average daily return standard
deviation
Average daily volume (1,000
shares)
Average number of
trades
Average turnover (%)
Average institutional ownership (%)
1 0.01-10 203 0.01 5.682 2.679 2581 366 0.363 4.127
[0.1% ~ 100%] (5.773) (2.490) (721) (139) (0.282) (1.182)
2 10-50 379 0.05 21.862 2.174 4988 1064 0.945 12.178
[0.1% ~ 0.5%] (19.252) (2.121) (2023) (500) (0.617) (6.927)
3 50-100 43 0.1 66.927 2.057 6029 1766 1.242 30.060
[0.1% ~ 0.2%] (61.946) (1.977) (2862) (1253) (0.621) (29.946)
4 100-500 17 0.5 180.326 2.515 4013 2005 1.582 31.413
[0.1% ~ 0.5%] (151.260) (2.649) (2865) (1665) (1.356) (32.248)
5 500-1000 1 1 661.199 3.534 9658 6161 2.705 48.022
[0.1% ~ 0.2%] (661.199) (3.534) (9658) (6161) (2.705) (48.022)