An Evaluation of the Assessing the Development Level
of the Standing Long Jump Observation Checklist
Chou, Song-I Yau, Han-Dau
Graduate Institute of Sports Training Science, National College of P. E. & Sports, 250, Wen-Hua 1st Road, Kueishan 333 Taoyuan, Taiwan, ROC.
E-Mail: [email protected]
Abstract
The purpose of the study was to evaluate the Assessing Development Level of the Standing Long Jump Observation Checklist. Haywood’s (1993) “Assessing the Development Level of the Standing Long Jump Observation Checklist” was based on the method of component analysis. The motors of standing long jump were takeoff and flight / landing components. We observed and assessed leg action, trunk action and arm action in six items. One of the items had Outfit (the outlier sensitive, mean-squared fit statistics) test greater than 1.5 in the Rasch analysis. It was not item-model fitness. The subjects were 135 boys aged 4 to 6 years. The Rasch model studied the misfit item, disordered question and the scale of
reasonability. Lastly it would be expected to evaluate exactly “the Assessing of the Standing Long Jump Observation Checklist”.
Introduction
In our laboratory exercise we observe and assess the Standing Long Jump. The process is somewhat different from observing swimming. Swimming is
repetitive; we can focus on a limb, watch for several actions and then make a decision. On the contrary, a jumper executes only one standing long jump at a time. Therefore, in observing jumping, we need to make a decision based on as less jumps as possible before the jumper tires. Nowadays, several observation checklists have been
developed and are currently in an extensive use to assess the development level of the Standing Long Jump.
Liu (2005) assessed the movements and the performances of the Standing Long Jump in 4 to 6 year-old boys by Haywood’s (1993) “Assessing the Development Level of the Standing Long Jump Observation Checklist”. The results of his study indicated that there have been associations between the movements and the
performances of the Standing Long Jump. In the research, we’ve found out that the Kendall's coefficient of concordance is 0.97, and the test-retest reliability coefficient is 0.95, while the Cronbach's Alpha is 0.63. As to the classic test theory, this result is questionable. On the other hand, Liu (2005) also indicated the generalizability coefficient is 0.98, but the person reliability was 0.79. Above all, it shows that this checklist has some problems for further research.
Each item of the checklist is modeled to have its own response structure. The Partial Credit Model is extended to any questionnaire using ordered polytomies in which the response structure is modeled to be unique to each item (Linacre, 2005).
Methods
Subjects
The sample for the evaluation of the Assessing Development Level of the Standing Long Jump Observation Checklist comprised 45 student responses on 135 jumps collected in January 2004. These students were sampled randomly from groups enrolled on a 4-year-old group, a 5-year-old group, and a 6-year-old group of various kinds in Taipei San-Xia Elementary School and its kindergarten. Details of the sample were given in Table1 as below.
Table 1
Sample Description
age No. student responses No. jumps
4 15 45
5 15 45
6 15 45
Total 45 135
Instruments
The Assessing Development Level of the Standing Long Jump Observation
Checklist.
Among the six items, two items have a total of three points, three items have a total of four points, and only one item has a total of five points. Those items are scored so that the higher scores would represent the greater jump level than the lower scores do.
Evaluation based on Rasch analysis
To evaluate the observation checklist, we used Rasch model anaysis. The Rasch model provides estimates of both items and persons independly. It maintains the specific objectivity. On the other hand, the Partial Credit Model (Masters, 1982) can accommodate responses that reflect several ordered levels of the performance on each item (Fox, 1999). In addition, it is the most general
polytomous responses of Rasch models. Following the above, we evaluated the observation checklist on “Partial Credit” Rasch Model. We used the indicator of fit statistics, person response and principal component analysis.
Results
Reliability
The person reliability was .79, which indicated that we could increase the extending range of person measures, testing persons with more extreme abilities. The Pearson correlation between raw scores and measures was expected to be close to 1.0 for persons and -1.0 for items. However, in fact, the Pearson correlation for persons was .99, while it was - .32 for items.
Fit statistics
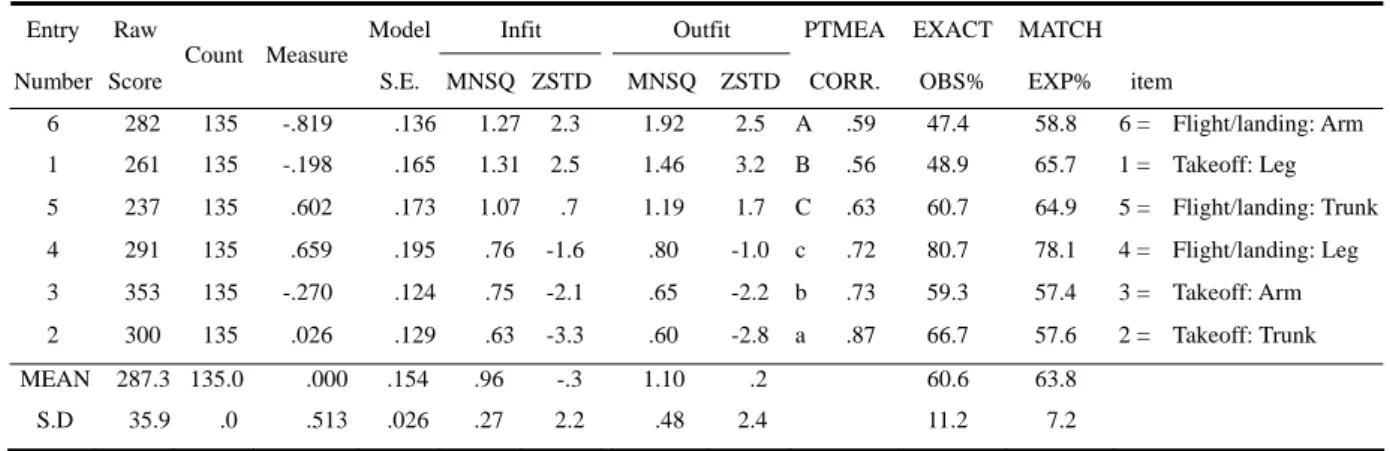
1. The reasonable ranges of item mean-square for infit and outfit statistics are from 0.5 to 1.5, which means it’s productive of measurement. We get the criterion from the User’s Guide to Winsteps (Linacre, 2005).
Table 2 indicates that the goodness of fit indices (infit and outfit) are all close to 1and ranged from 0.6 to 1.46, except the sixth item. The outfit mean-square of the sixth item was 1.92 only (Table 2). This suggested that there was strong consistency between the data and the Rasch unidimensional model. Also, it indicated the
presence of the unexpected outliers. Thus, it was not item-model fitness. The dimensionality was not consistent with the suggestion of one underlying factor for this set of items. The outfit mean-square of the category label 2 of the sixth item was 4.0, and the point biserial correlation was .007, which violated the model. The situation, the percentage in category label 2 was 20%, the percentage in category label 1 was 36%, and the percentage in category label 3 was 44%, has shown to be violating the normal distribution. The outfit mean-square of the category label 2 of the first item was 2.1, which degraded measurement.
Table 2
Item Statistics: Misfit Order
Entry Raw Model Infit Outfit PTMEA EXACT MATCH
Number Score
Count Measure
S.E. MNSQ ZSTD MNSQ ZSTD CORR. OBS% EXP% item
Table 3
Item Category/Option/Distracter Frequencies: Misfit Order
Data Entry Number Data Code Score Value Count % Average Measure S.E. Mean OutF MNSQ PTMEA Corr. Item 6A 1 1 48 36 -1.59 .14 1.2 -.52 6.1 2 2 27 20 -.59 .30 4.0 -.07 6.2 3 3 60 44 .75 .22 1.0 .55 6 = Flight/ Landing: Arms 6.3 1B 1 1 40 30 -1.42 .15 1.2 -.39 1.1 2 2 64 47 -.53 .21 2.1 -.10 1.2 3 3 31 23 1.41 .26 1.2 .54 1 = Takeoff: Legs 1.2 5C 1 1 51 38 -1.52 .09 .8 -.52 5.1 2 2 66 49 -.08 .21 1.4 .15 5.2 3 3 18 13 1.98 .39 1.4 .52 5 = Flight/ Landing: Trunk 5.3 4c 1 1 10 7 -1.94 .48 .9 -.25 4.1 2 2 100 74 -.85 .11 .6 -.48 4.2 3 3 19 14 1.98 .33 .8 .53 4.3 4 4 6 4 3.33 .21 .6 .45 4 = Flight/Landing: Legs 4.4 3b 1 1 33 24 -2.05 .13 .7 -.55 3.1 2 2 3 2 -2.57 .00 .7 -.19 3.2 3 3 82 61 -.24 .13 .6 .08 3.3 4 4 17 13 2.80 .19 .6 .68 3 = Takeoff: Arms 3.4 2a 1 1 45 33 -1.83 .11 .8 -.59 2.1 2 2 42 31 -.87 .11 .5 -.20 2.2 3 3 21 16 .24 .21 .5 .14 2.3 4 4 27 20 2.46 .21 .6 .79 2 = Takeoff: Trunk 2.4 Note. Item description:
6.1 Arms asymmetrical or move down and back
6.2 Arms wing backward in flight and parachute (more forward) for landing 6.3 Arms extended overhead or rotate backward and wing down at landing 1.1 Asymmetrical
1.2 Symmetrical, bent
1.2 Symmetrical, full extension 5.1 Trunk inclined less than 0
30
5.2 Trunk remained inclined 0
30 or hyper stretched 5.3 Trunk maintained a lean of 0
4.2 Asymmetrical two-foot landing
4.3 Waist and knees flex together at landing 4.4 Knees flex first and then waist
3.1 Arms flex at two side of the trunk
3.2 Arms in winging posture and stretch backward 3.3 Arms move out, move overhead or in defense posture
3.4 Arms flex slightly forward and upward, but not fully extended 2.1 Trunk lean less than 0
30 , neck is hyper extended 2.2 Trunk lean less than 0
30 , neck is flexed or aligned with the trunk 2.3 Trunk maintained a lean of 0
30 , neck is flexed 2.4 Trunk maintained a lean of 0
30 , neck is aligned
Disorder
The average measure of the category 2 of the item 3 was -2.57. This disorder in the “average measures” of categories can imply the disorder in the category
definitions (Table 3). The categories have been deliberately disordered in the data. It is seen that this results in disorder of the average measures.
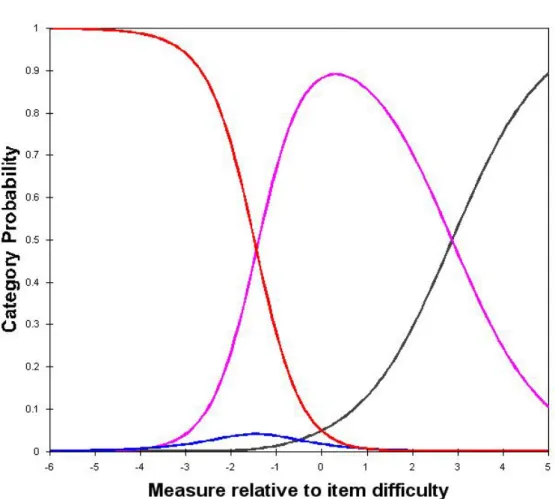
The disorder in the “step calibration” implies less frequently observed intermediate categories (Linacre, 2005). It reflects the relative infrequency of category 2, which was only three (Figure 1). The Infrequency of category 2 is pictured in plot of probability curves, which shows that there’s never a modal category in these data. The step calibration values do not indicate whether
Figure1. Disorder categories of the third item.
Table 4
Table of Poorly Fitting Items (persons in ENTRY ORDER)
Number Name Position Measure Infit(MSNQ) Outfit 6 6 = Flight/Landing: Arms -.819 1.3 A 1.9
Response: Z-Residual:
91: 3 3 3 1 1 1 2 2 2 3 -6 -6 -6
Number Name Position Measure Infit(MSNQ) Outfit 1 1 = Takeoff: Legs -.198 1.3 B 1.5
Response: Z-Residual:
101: 3 3 2 2 2 3 3 3 3 3 -3 -3 -2
Principal Components Analysis of Residuals
Table 5
Principal Components (Standardized Residual) Factor Plot
Table of STANDARDIZED RESIDUAL variance (in Eigenvalue units)
Empirical Modeled
Total variance in observations = 24.2 100.0% 100.0% Variance explained by measures = 18.2 75.2% 78.6% Unexplained variance (total) = 6.0 24.8% 100% 21.4% Unexpl var explained by 1st factor = 1.9 7.9% 31.7%
Note. Factor 1 extracts 1.9 units out of 6 units of item residual variance noise. Yardstick (variance explained by measures)-to-This Factor ratio: 9.6:1
The purpose of PCA of residuals is to explain variance.
Table 5 shows Factor 1 extracts 1.9 units out of 6 units of item residual variance noise. Because 6 divided by 1.9 equals 3.15, which is above 3 times, the test was probably unidimensional. Empirical explained Variance was 75.2%.
As the Empirical explained Variance (75.2%) was similar with Modeled explained Variance (78.6%), the test was unidimensional.
Conclusion
The analysis of the evaluation of the Assessing Development Level of the
Standing Long Jump Observation Checklist were conducted by using the data from 45 student responses on 135 jumps collected in January 2004.
With the validation analysis, it appears the followings:
(1) The test is probably unidimensional, and the Rasch analysis of the test is valid.
(2) The person reliability was .79, which indicated that we can increase the extending range of person measures.
(3) The pearson correlation between raw scores and measures was expected to close to –1.0 for items. However, while it was -.32 for the items, it should be more improved.
(4) The sixth item is a poorly fitting item. Its item outfit mean-square was 1.92 and the ZSTD was 2.5, which implied the disorder in the category.
Therefore, the category definitions need to be reviewed.
Reference
Fox, C. (1999) An introduction to the partial credit model for developing nursing assessments. Journal of Nursing Education, 38,(8) 1-7.
Haywood, K. M. (1993). Laboratory activities for life span motor development. (2nd ed.). Champaign IL: Human Kinetics Publishers.
Haywood, K. M., & Getchell, N. (2001). Life span motor development. (3rd ed.).Champaign:Human Kinetics.
Liu, C. C. (2005). The Study of the Movements and Performance of Standing Long
Jump in 4 to 6 Years-Old Boys. Unpublished doctoral dissertation, College of
National Sport, Taoyuan.
Linacre, J. M. (2005). A User’s Guide to Winstep. Chicago: MESA Press.
Masters, G. N. (1982). A Rasch model for partial credit scoring. Psychometrika, 47, 149-174.