Molecular evolution and phylogeny of the atpB–
rbcL spacer of chloroplast DNA in the true
mosses
Tzen-Yuh Chiang and Barbara A. Schaal
Abstract: The nucleotide variation of a noncoding region between the atpB and rbcL genes of the chloroplast genome was used to estimate the phylogeny of 11 species of true mosses (subclass Bryidae). The A+T rich (82.6%) spacer se- quence is conserved with 48% of bases showing no variation between the ingroup and outgroup. Rooted at liverworts, Marchantia and Bazzania, the monophyly of true mosses was supported cladistically and statistically. A nonparametric Wilcoxon Signed-Ranks test Ts statistic for testing the taxonomic congruence showed no significant differences be- tween gene trees and organism trees as well as between parsimony trees and neighbor-joining trees. The reconstructed phylogeny based on the atpB–rbcL spacer sequences indicated the validity of the division of acrocarpous and
pleurocarpous mosses. The size of the chloroplast spacer in mosses fits into an evolutionary trend of increasing spacer length from liverworts through ferns to seed plants. According to the relative rate tests, the hypothesis of a molecular clock was supported in all species except for Thuidium, which evolved relatively fast. The evolutionary rate of the chloroplast DNA spacer in mosses was estimated to be (1.12 ± 0.019) × 10–10nucleotides per site per year, which is close to the nonsynonymous substitution rates of the rbcL gene in the vascular plants. The constrained molecular evo- lution (total nucleotide substitutions, K≈0.0248) of the chloroplast DNA spacer is consistent with the slow evolution in morphological traits of mosses. Based on the calibrated evolutionary rate, the time of the divergence of true mosses was estimated to have been as early as 220 million years ago.
Key words: atpB–rbcL noncoding spacer, chloroplast DNA, gene tree, molecular evolution, molecular clock, mosses, phylogeny.
Résumé : La variation nucléotidique dans la région non-codante située entre les gènes atpB et rbcL du génome chloro- plastique a été employée afin d’estimer la phylogénie chez onze espèces de mousses véritables (sous-classe des Bryidae). La séquence riche en A+T (82,6 %) de l’espaceur est conservée puisque 48 % des positions ne montrent au- cune variation entre les groupes interne et externe. Prenant racine chez les hépatiques Marchantia et Bazzania, le carac- tère monophylétique des mousses véritables était supporté à la fois sur les plans cladistiques et statistiques. Une statistique non-paramétrique Ts de Wilcoxon pour échantillons appariés permettant de tester la conformité taxonomique n’a montré aucune différence significative entre les arbres basés sur les gènes et ceux plus globaux (au niveau de l’organisme) de même qu’entre les arbres dérivés de méthodes d’analyse de parsimonie ou « neighbor-joining ». La phylogénie fondée sur la séquence de l’espaceur atpB–rbcL a validé la justesse de la division des mousses en deux groupes : les acrocarpes et les pleurocarpes. La taille de l’espaceur chloroplastique chez les mousses dénote une ten- dance à l’allongement de l’espaceur à partir des hépatiques, en passant par les fougères, jusqu’aux plantes à graines.
Selon les tests de taux relatifs, l’hypothèse d’une horloge moléculaire était supportée chez toutes les espèces à l’exception du Thuidium, lequel a évolué relativement rapidement. Le taux d’évolution de l’espaceur chloroplastique chez les mousses a été estimé à (1,23 ± 0,019) × 10–10nucléotide par site par année, ce qui est proche des taux de substitution non-synonyme au niveau du gène rbcL chez les plantes. L’évolution moléculaire contrainte (K≈0,0248) chez l’espaceur chloroplastique est conforme avec le taux d’évolution lent des caractères morphologiques chez les mousses. En fonction du taux d’évolution calibré, le moment de la divergence des mousses véritables est estimé s’être produit aussi tôt qu’il y a 220 millions d’années.
Mots clés : espaceur non-codant atpB–rbcL, ADN chloroplastique, arbre génique, évolution moléculaire, horloge moléculaire, mousses, phylogénie.
[Traduit par la Rédaction] Chiang and Schaal 426
Corresponding Editor: G. Bellemare.
Received March 15, 1999. Accepted September 30, 1999. Published on the NRC Research Press website on April 27, 2000.
T.-Y. Chiang.1Department of Biology, Cheng-Kung University, Tainan, Taiwan 700.
B.A. Schaal. Department of Biology, Washington University, St. Louis, MO 63130–4899, U.S.A.
1Author to whom all correspondence should be addressed (e-mail: tychiang@mail.ncku.edu.tw).
Introduction
The chloroplast genome has been extensively used for evo-
lutionary and systematic studies (Palmer 1987; Avise 1994).
Compared to the nuclear DNA and animal mitochondrial
DNA, chloroplast genes evolve relatively slowly (Clegg et
al. 1991; Li 1997). Among molecular markers, the rbcL
gene has been widely used for systematics at higher levels
(e.g. Olmstead et al. 1992; Chase et al. 1993; Qiu et al.
1993; Hasebe et al. 1994; Nickrent and Soltis 1995). High
levels of homoplasy in cpDNA sequence have been found in
some groups (Kim et al. 1992) making the sequence some-
what less reliable in phylogenetic reconstruction than is usu-
ally assumed. Moreover, since the chloroplast genome is
uniparentally inherited (Sears 1980), the phylogeny inferred
from cpDNA sequences may represent a gene tree rather
than an organism tree (Pamilo and Nei 1988; Zurawski and
Clegg 1987).
The noncoding region between rbcL and atpB genes has
been used in phylogenetic studies (e.g., Savolainen et al.
1994; Ehrendorfer et al. 1994; Natali et al. 1995) and the
function (such as promoters for rbcL) of this spacer in vas-
cular plants has been well documented (Orozco et al. 1990;
Manen et al. 1994; Mullet et al. 1985; Gruissem and
Zurawski 1985). The spacer region is variable in size, with
differences among major groups of plants (Yoshinaga et al.
1992; Chiang et al. 1998). In spite of length differences, the
evolution of the atpB–rbcL spacer sequence is constrained
relative to the rbcL gene in angiosperms (Zurawski et al.
1984). Until now no work has compared the spacer sequence
evolution between mosses and other major groups.
In this study, we investigate the tempo and mode of
evolution of the atpB–rbcL chloroplast spacer in mosses.
Mosses have been described as “primitive” terrestrial plants
(Lemoigne 1970). Based on the fossil evidence, the pace of
evolution in mosses is thought to be slower than in angio-
sperms (Delcourt and Delcourt 1991). However, no evidence
from molecular perspectives has been considered.
This study had four goals: (1) to reconstruct the gene tree
of atpB–rbcL spacer; (2) to investigate the evolutionary mode
of this spacer; (3) to test the hypothesis of a molecular
clock; and (4) to estimate the time of divergence from a
common ancestor of the true mosses.
Materials and methods
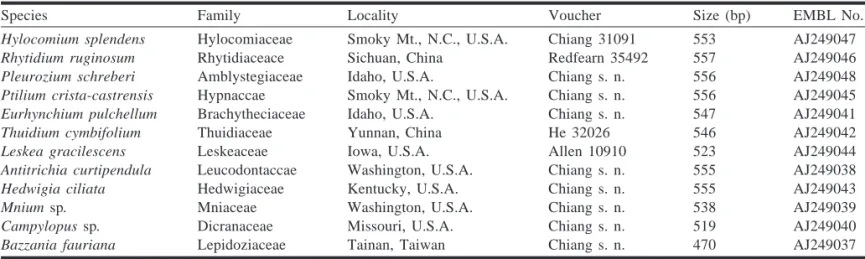
Plant materialsEleven species representing 11 families of both acrocarpous and pleurocarpous mosses (subclass Bryidae) were sampled (Table 1).
Most of the plants, except for Rhytidium, Leskea, and Thuidium, were collected from the field in the United States and were air- dried without any special field treatment. Voucher specimens are deposited in the herbaria of Missouri Botanical Garden (Mo.) and Academia Sinica, Taipei (HAST).
DNA extraction and sequencing
Leaf tissue from single individuals was frozen in liquid nitrogen and ground in Eppendorf tubes with a metal dounce. Genomic DNA was extracted from the powdered tissue in 600µL 2× CTAB (cetyltrimethylammonium bromide) buffer (Doyle and Doyle 1987) with 0.4% (v/v)β-mercaptoethanol and incubated for 1 h at 65°C.
After adding equal volume of 24:1 chloroform : isoamyl alcohol,
the tissue mixture was centrifuged at 14 000 rpm for 15 min at room temperature. The supernatant was transferred to an Eppendorf tube followed by addition of 1.2 mL of absolute etha- nol. After overnight incubation at 4°C, DNA was recovered by centrifuging the mixture at 14 000 rpm for 15 min at 4°C. The brown to black DNA pellet was rinsed in 70% ethanol and centri- fuged for 5 min at 10 000 rpm. The DNA pellet was resuspended in 20µL TE.
The extracted genomic DNA was purified on a low-melting- point agarose gel to remove secondary compounds and RNA. The band on the gel containing the DNA of the correct size was cut and transferred into an Eppendorf tube. Equal weights of distilled water were added to the gel block containing the purified DNA. Prior to use of the DNA for polymerase chain reaction (PCR), the gel was heated in a 65°C water bath for 3 min.
Two universal primers, rbcL-1 (5′-AACACCAGCTTTRAATC- CAA-3′) and atpB-1 (5′-ACATCKARTACKGGACCAATAA-3′), were developed for amplifying and sequencing the rbcL-atpB spac- ers (Chiang et al. 1998) from the sequences of Marchantia (Umesono et al. 1988), tobacco (Shinozaki et al. 1986), and rice (Nishizawa and Hirai 1987). The PCR amplification protocol uti- lized two units of Taq polymerase (New England BioLab), the Taq buffer (500 mM KCl, 100 mM Tris–HCl, pH 9.0, and 1.0% Triton X–100), 2.5 mM MgCl2, 10 pmol of each primer, and 8 mM dNTP in 100µL reaction. PCR amplification was carried out in 30 cycles of 94°C denaturing for 45 s, 57°C annealing for 1 min 15 s, and 72°C extension for 1 min 15 s, followed by 72°C extension for 10 min and 4°C for storing. PCR products were polyacrylamide- gel-purified and sequenced by the dideoxy-mediated chain- termination method (Sanger et al. 1977). The fmol™ DNA Se- quencing System (Promega), which uses Taq polymerase, was used for sequencing. The detergent NP–40 (10%) was added to assist se- quencing through G+C rich regions and secondary structure (Wang et al. 1992). Both strands of DNA were sequenced with about 50- base overlap.
Data analysis
Sequence alignment
Sequences were aligned by multiple alignments without weight- ing transversions or transitions using the CLUSTAL V Program (Higgins et al. 1992). The fixed gap penalty was 35 and the float- ing penalty was 4. The sequences of Marchantia polymorpha (Umesono et al. 1988) and Bazzania fauriana were used as out- groups.
Phylogenetic analyses
The cladistic analyses of sequencing data were performed by the maximum parsimony using Phylogenetic Analysis Using Parsi- mony Program (PAUPv. 3.1.1., Swofford 1993) and the neighbor- joining (NJ) method using Molecular Evolutionary Genetics Anal- ysis Program (MEGAv. 1.01, Kumar et al. 1993). Parsimony analy- ses were conducted using heuristic searches with TBR branch swapping, accelerated transformation (ACCTRAN), an uncon- strained number of maximum trees, and retention of multiple most parsimonious trees (MULPARS). Neighbor-joining analyses were conducted by calculating Kimura’s (1980) 2-parameter distance.
Both strict (Sokal and Rohlf 1981) and 50% majority-rule (Margush and McMorris 1981) consensus trees were computed rooted at both Marchantia and Bazzania.
A g1test (Huelsenbeck 1991) of skewed tree-length distributions was calculated from 10 000 random trees generated byPAUPin or- der to measure the information content of the data. Critical values of the g1test were obtained from Hillis and Huelsenbeck (1992).
The fit of character data on phylogenetic hypotheses (Swofford 1991) was evaluated and calculated by the consistency index, CI (Kluge and Farris 1969) and the retention index, RI (Archie 1989;
Farris 1989). The statistical significance of CI was determined ac- cording to Klassen et al. (1991). The confidence of the clades was tested by bootstrapping (Efron 1982; Felsenstein 1985) with 400 replicates (Hedges 1992) of heuristic searches on the 50% majority rule trees. The nodes with bootstrap values greater than 0.70 are significantly supported with ≥95% probability (Hillis and Bull 1993).
Tests of taxonomic congruence and alternative trees
Different analytic methods (in this case,PAUPandMEGA) may re- sult in different topologies. Moreover, the phylogeny inferred from the chloroplast spacer sequence represents a gene phylogeny and may conflict with the organism tree. To test the taxonomic congru- ence between topologies as well as gene trees versus organism trees, a nonparametric Wilcoxon Signed-Ranks Test was employed (Templeton 1983; Larson 1994). Two-tailed probabilities were used to examine the significance levels (Felsenstein 1985; statisti- cal tables see Rohlf and Sokal 1981). The information on charac- ters favoring each tree with signs of different steps according to the assumption of parsimony was obtained from the computer programMACCLADE(Maddison and Maddison 1992).
Relative rate tests
The hypothesis of a molecular clock (Zuckerkandl and Pauling 1965) was tested by relative rate tests (Sarich and Wilson 1973;
Wu and Li 1985). The total number of nucleotide substitutions (K), which is the number of transitional and transversional substitutions per site, was calculated from each lineage using Marchantia as the reference species. The data on number and ratio of transversion versus transition between taxa was obtained from the MEGA pro- gram. The null hypothesis of a molecular clock suggests that the number of nucleotide substitutions between two lineages would be the same. Based on the assumption of a normal distribution of nu- cleotide substitutions (Wu and Li 1985), the hypothesis of a molec- ular clock will be rejected with 95% significance, when the difference of substitution rates between two lineages is greater than 1.96 times the standard error (sx).
Results and discussion
DNA sequences and the mode of evolution
The size of the atpB–rbcL spacer is variable among moss
families from 519 to 557 base pairs (average = 549 bp,
Table 1). An evolutionary trend of increasing size of the
chloroplast spacer from liverworts (470, Bazzania; 507,
Marchantia), through mosses (549), ferns (ca. 600, Angiopteris,
Yoshinaga et al. 1992), angiosperms (899, grasses, Golenberg et
al. 1993; 841, Begonia, Liu et al. 1998; and 900, Quercus,
Hong et al. 1999), and to gymnosperms (1000, Cunninghamia,
Chiang et al. 1998), appears to be emerging. Insertions and
(or) deletions (indels) are a common phenomenon in mosses
as well as in grasses (Golenberg et al. 1993). In 357 indel
events, 289 (73.5%) are single-base indels, 37 (14.4%) are
two-base indels, 23 (8.9%) are three- to seven-base indels.
Eight (3%) large indels with more than 10 bases were ob-
served, respectively, in the Marchantia (11 bases between
positions 39 and 49; 23 bases between positions 290 and
312; 12 bases between positions 320 and 331), Campylopus
(10 bases between positions 26 and 35; 13 bases between
positions of 275 and 287; 18 bases between positions 302
and 109), Leskea (33 bases between positions 401 and 433),
and Thuidium (12 bases between positions 301 and 312) se-
quences.
Nucleotides A and T are rich in the chloroplast spacer,
which is consistent with the nucleotide composition of most
noncoding spacers and pseudogenes due to low functional
constraints (cf. Li 1997). The average A+T content is 82.6%.
Among the taxa, Campylopus has the highest level of A
(40.7%), and Rhytidium, Hedwigia, and Thuidium have the
highest levels of T (44.5%).
The ratios between transitions and transversions obtained
from
MEGAranged from 0.630 (between Campylopus and
Antitrichia) to 1.40 (between Thuidium and Antitrichia) in
mosses. In total, 1161 transitions and 1132 transversions
were observed (with a ratio of transitions/transversions of
1.03). Biased substitution patterns toward transitions, with
deviation from random mutation (with an expected transi-
tions/transversions ratio of 0.5), have been found in several
fast-evolving genes, such as primate mtDNA control region
(ratio
≈15.0–15.7, Kocher and Wilson 1991; Vigilant et al.1991; Tamura and Nei 1993) and nuclear satellite DNA (Wu
et al. 1999), both of which are generally subject to very
weak selective constraints (cf. Li 1997). However, more like
the coding sequences of mtDNA (Brown et al. 1982), the
atpB–rbcL noncoding spacer of the chloroplast DNA has a
much lower ratio between transitions and transversions both in
angiosperms (e.g., 1.5 between barley and maize, Zurawski et
al. 1984) and mosses (1.03). A lower transition/transversion
ratio indicates a conserved nature of this chloroplast spacer
and low evolutionary rates in the plants (discussed below).
But, unlike the strong functional and selective constraints in
Species Family Locality Voucher Size (bp) EMBL No.
Hylocomium splendens Hylocomiaceae Smoky Mt., N.C., U.S.A. Chiang 31091 553 AJ249047
Rhytidium ruginosum Rhytidiaceace Sichuan, China Redfearn 35492 557 AJ249046
Pleurozium schreberi Amblystegiaceae Idaho, U.S.A. Chiang s. n. 556 AJ249048
Ptilium crista-castrensis Hypnaccae Smoky Mt., N.C., U.S.A. Chiang s. n. 556 AJ249045
Eurhynchium pulchellum Brachytheciaceae Idaho, U.S.A. Chiang s. n. 547 AJ249041
Thuidium cymbifolium Thuidiaceae Yunnan, China He 32026 546 AJ249042
Leskea gracilescens Leskeaceae Iowa, U.S.A. Allen 10910 523 AJ249044
Antitrichia curtipendula Leucodontaccae Washington, U.S.A. Chiang s. n. 555 AJ249038
Hedwigia ciliata Hedwigiaceae Kentucky, U.S.A. Chiang s. n. 555 AJ249043
Mnium sp. Mniaceae Washington, U.S.A. Chiang s. n. 538 AJ249039
Campylopus sp. Dicranaceae Missouri, U.S.A. Chiang s. n. 519 AJ249040
Bazzania fauriana Lepidoziaceae Tainan, Taiwan Chiang s. n. 470 AJ249037
Note: s. n., no collection number.
Table 1. Materials of true mosses and a liverwort (Bazzania, outgroup) collected for DNA isolation and nucleotide sequencing.
the mtDNA coding region, the mechanisms causing the low
variation in this noncoding spacer have remained unknown.
In contrast to the bias toward transitions in true mosses, the
transition/transversion ratios between Marchantia and the
mosses were much closer to random mutation with a range
0.409–0.571. The absence of the biased trend may be closely
correlated with the long evolutionary history between mosses
and liverworts, which allowed the evolutionary changes in
the chloroplast spacer between the two lineages reached sat-
uration.
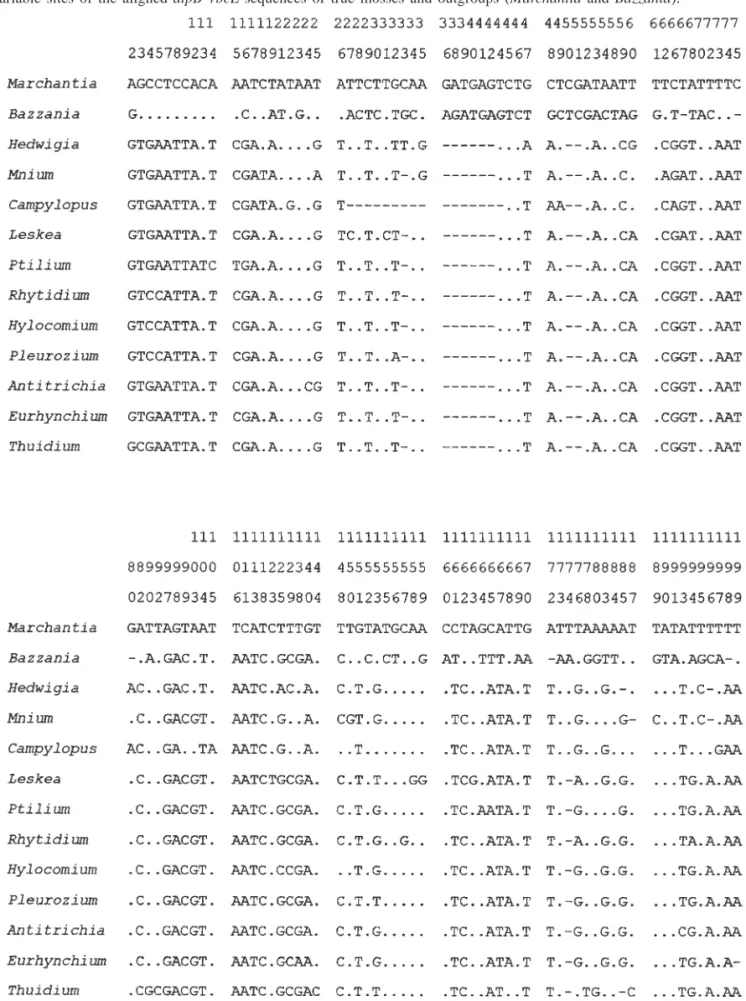
Fig. 1. Variable sites of the aligned atpB–rbcL sequences of true mosses and outgroups (Marchantia and Bazzania).
Phylogenetic reconstruction
Cladistic analyses were conducted on the aligned se-
quences of 584 bases (Fig. 1). Aligned sequence is available
upon request from the authors. The sequences are conserved,
with 284 bases (48%) having no variation among moss taxa
and liverworts. Nevertheless, the level of synapomorphy,
Fig. 1 (continued).233 bases out of a total of 584 (39.9%), is high. Within the
variable bases, 77% (233 of 300) were synapomorphies.
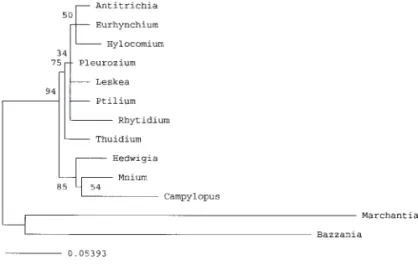
A single most parsimonious tree with 394 steps, a CI of
0.871 (P
≤0.01), and an RI of 0.571, was recovered by
PAUP(Fig. 2). A g
1statistic of –1.275 indicates significant signal
(P
≤0.01) of the data matrix on the phylogenetic hypothesis.
The monophyly of the true mosses was significantly sup-
ported with a bootstrap value of 0.90 (P
≥95%). Within true
Fig. 1. (concluded). Variable sites of the aligned atpB–rbcL sequences of true mosses and outgroups (Marchantia and Bazzania).mosses, two monophyletic groups, i.e., the acrocarpous mos-
ses (bootstrap value = 87%) and the pleurocarpous mosses
(bootstrap value = 77%), were recognized and well sup-
ported statistically. The close relationship between Hedwigia
and Mnium was revealed by the cladistic analysis with a
bootstrap value of 74%. Two nodes had bootstrap values
greater than 50% (but less than 70%): the clade of Hylo-
comium and Pleurozium (56%), and the clade of Leskea and
Ptilium (63%).
Neighbor-joining analysis was conducted based on the
distance matrix. A K2P tree (Fig. 3) was obtained with com-
plete resolution, but the topology is not fully congruent with
the tree identified by
PAUP. On the neighbor-joining tree,
Hylocomium was closely related to Eurhynchium and Anti-
trichia instead of Pleurozium. Rhytidium and Thuidium were
the basal taxa of the pleurocarpous mosses instead of clus-
tering together.
Interestingly, both analytic methods supported the taxo-
nomic position of Hedwigia being more closely related to
the acrocarpous mosses instead of the pleurocarpous mosses.
Recent classifications, such as Buck and Vitt (1986), have
placed the Hedwigiaceae close to the family Leucodontaceae,
another member of the pleurocarpous mosses, based on im-
mersed capsules, autoicous plants, and papillose leaf-cells.
Apparently, this close relationship between families was not
supported by the atpB–rbcL spacer sequence analysis. In
contrast, a more traditional classification, which places the
Hedwigiaceae in the acrocarpous mosses and closely related
to the Grimmiaceae (Hedwig 1801), was supported by the
molecular data. Nonetheless, the systematic position of the
Hedwigiaceae remains problematic (cf. Mishler and de Luna
1991). The phylogeny inferred from the chloroplast DNA
sequences may merely represent gene trees instead of the or-
ganism trees. To achieve better understanding of the phylog-
eny of the Hedwigiaceae, more molecular data as well as
ontogenetic data are required.
Tests of alternative trees
The most parsimonious tree identified by
PAUPis not com-
pletely consistent with the organism trees inferred from both
morphological data (Rohrer 1985) and the combined data of
ITS (internal transcribed spacer) of nrDNA and atpB–rbcL
spacers (Chiang 1994), which suggests that Hylocomium is
related to Rhytidium and that Pleurozium and Antitrichia are
closely related. Templeton’s test was used to determine the
character fit to the topology of the chloroplast tree and the
organism trees. Eleven characters favored the chloroplast
tree and three characters favored the organism trees. A Ts-
statistic of 22.5 obtained from the Wilcoxon Signed-Ranks
tests therefore suggested a non-significant difference be-
tween the gene tree and organism trees (P
≤0.0688). That is,
the organism trees are suboptimal to the trees inferred from
the chloroplast spacer.
Likewise, a significant difference between K2P tree and
parsimony tree is not supported by Templeton’s test. Ten
characters, of which two have sign of +2 (two steps shorter
than in the alternative tree) and eight have sign of +1, fa-
vored the parsimony tree and six characters, with sign of –1,
favored the K2P trees. The Ts statistic is equal to 45.0 (P <
0.10, non-significant).
The taxonomic hypothesis of the Hedwigiaceae belonging
to the pleurocarpous mosses was also tested. The Wilcoxon
Signed-Ranks test showed that 27 characters, with a sign of
+1, favored the chloroplast tree, in which the Hedwigiaceae
Fig. 2. The most parsimonious tree rooted at Marchantia andBazzania reconstructed byPAUPbased on the nucleotide variation of the atpB–rbcL spacer of the chloroplast DNA. Numbers at nodes indicate the bootstrap values of the clades. A, acrocarpous mosses; P, pleurocarpous mosses.
Fig. 3. The K2P tree recovered byMEGAbased on the genetic distance of the chloroplast DNA spacer between atpB and rbcL genes in true mosses and outgroups (Marchantia and Bazzania).
Numbers at nodes indicate the bootstrap values.
is related to acrocarpous mosses, and five characters, with
sign of –1, favored the alternative tree. The Ts statistic of
82.5 suggested a significant difference (P < 0.01). That is,
the hypothesis of the Hedwigiaceae in the pleurocarpous
mosses was rejected by the atpB–rbcL spacer sequence anal-
ysis.
Relative rate tests
The differences in nucleotide substitutions per site be-
tween mosses and Marchantia varied from 0.096 to 0.104
with an average of 0.0985 ± 0.0017 (s
x). In contrast, differ-
ences in nucleotide substitutions within mosses were highly
variable from 0.008 to 0.050 (average = 0.0248). Obviously,
the nucleotide substitutions obtained within mosses are less
than those between mosses and Marchantia due to the long
time of divergence between mosses and liverworts from their
common ancestor.
It is noteworthy that the evolutionary rate of the atpB–
rbcL noncoding spacer in mosses is much slower than in
vascular plants. For example, the difference in nucleotide
substitution between maize and barley is 0.0691 (Zurawski
et al. 1984), which apparently have much shorter coales-
cence time than do mosses. Furthermore, as a noncoding re-
gion, the atpB–rbcL spacer should have evolved faster than
the rbcL gene due to the lower functional constraints. How-
ever, compared to the third position substitution rate of
0.190 for the rbcL gene between barley and maize
(Bousquet et al. 1992), the number of substitutions per site
of the noncoding spacer in mosses is even slower (average =
0.02). Accordingly, the evolutionary rate of atpB–rbcL spac-
ers found here is close to the nonsynonymous rates of the
rbcL gene in gymnosperms and ferns (Savard et al. 1994).
Among the taxa analyzed, the chloroplast spacer of
Thuidium evolved relatively rapidly. When pairwise compar-
isons of relative rate tests were made using Marchantia as a
reference species, most lineages are congruent with the hypoth-
esis of a molecular clock, except for the pairs of Thuidium and
Leskea, and Thuidium and Pleurozium (Table 2).
The time between the common ancestor of true mosses
and other groups was estimated from the molecular clock
constructed from the noncoding atpB–rbcL spacer. Savard et
al. (1994) suggested that liverworts and seed plants diverged
440 million years ago. According to a cladistic study of the
phylogeny of bryophytes and related major groups (Mishler
and Churchill 1984), bryophytes appear to be a paraphyletic
group, within which mosses were more related to vascular
plants than to liverworts or hornworts. Therefore, 440 mil-
lion years can be used as the reference for the branching of
mosses from a common ancestor. The rate of evolution for
the chloroplast spacer was estimated to be (1.12 ± 0.019) ×
10
–10substitutions per site per year. The evolution of the
true mosses, excluding Thuidium, can thus be traced back to
220 million years ago.
Conclusions
In this study, we investigated the molecular evolution of
atpB–rbcL spacer of the chloroplast genome in the true
mosses. Not only the morphological traits, but also the mo-
lecular evolution of the cpDNA spacer in mosses was con-
strained. The sequences of the noncoding region are highly
conserved both within mosses and between mosses and liv-
Taxa1234567891011 10.062±0.400.251±0.470.252±0.42–0.190±0.42–0.380±0.440.126±0.450.125±0.41–0.130±0.420.126±0.42–0.570±0.50 20.1550.188±0.510.190±0.46–0.250±0.45–0.440±0.470.063±0.460.062±0.43–0.190±0.430.064±0.45–0.640±0.50 30.5340.3690.000±0.510.440±0.54–0.630±0.54–0.130±0.54–0.130±0.54–0.380±0.53–0.120±0.54–0.820±0.57 40.6000.4130.00–0.440±0.31–0.630±0.38–0.130±0.38–0.130±0.31–0.380±0.35–0.130±0.33–0.820±0.41 50.4520.5560.8151.420–0.190±0.310.314±0.290.315±0.230.253±0.320.316±0.26–0.380±0.35 60.8640.9361.1710.6600.6130.505±0.390.505±0.280.505±0.290.506±0.32–0.250±0.39 70.2800.1370.2400.3421.0911.2900.000±0.24–0.250±0.300.000±0.27–0.700±0.40 80.3050.1440.2500.4191.3701.8000.000–0.250±0.250.000±0.25–0.70±0.35 90.3100.4420.7171.0900.7911.7400.8331.0000.252±0.27–0.440±0.31 100.3000.1420.2220.3941.2201.5800.0000.0000.933–0.70±0.35 111.1401.2611.4422.000*1.0900.6411.7502.000*1.1901.890 Note:1,Hedwigia;2,Mnium;3,Campylopus;4,Leskea;5,Ptilium;6,Rhytidium;7,Hylocomium;8,Pleurozium;9,Antitrichia;10,Eurhynchium;11,Thuidium. *Pⱕ0.05(significancelevel).Table2.Differences(×100)innumberofnucleotidesubstitutionspersiteK(=Kl3–K23)forchloroplastDNAspacersusingMarchantiaasthereferencespecies;whereK13 (K23)isthedifferenceofsubstitutionsbetweenspecies1(2)andspecies3(referencetaxon)(abovediagonal)–absolutevalueofK/sx(sx=standarderror)(belowdiagonal).
erworts. The conserved nature of these sequences suggests
that this spacer may not be an appropriate marker for phy-
logeny at lower levels. Based on the relative rate tests, the
molecular clock ticked at nearly a regular rate, which was
estimated to be (1.12 ± 0.019) × 10
–10substitutions per site
per year in this noncoding region of true mosses. Neverthe-
less, since the relative rate test only considers the numbers
of nucleotide substitutions and not the numbers of indels,
these tests may be biased when applied to genes with high
numbers of indels.
Acknowledgements
We thank Dr. Brent D. Mishler for his advice on DNA ex-
traction. We are indebted to Steve O’Kane and Cheng-Fang
Chiang for the assistance in DNA sequencing and data anal-
ysis. We are grateful to Prof. Peter H. Raven for his encour-
agement on this research.
References
Archie, J.W. 1989. Homoplasy excess ratios: New indices for mea- suring levels of homoplasy in phylogenetic systematics and a critique of the consistency index. Syst. Zool. 38: 253–269.
Avise, J.C. 1994. Molecular markers, natural history and evolution.
Chapman & Hall, New York.
Bousquet, J., Strauss, S.H., Doerksen, A.H., and Price, R.A. 1992.
Extensive variation in evolutionary rate of rbcL gene sequences among seed plants. Proc. Natl. Acad. Sci. U.S.A. 89: 7844–
7848.
Brown, W.M., Prager E.M., Wang, A., and Wilson, A.C. 1982. Mi- tochondrial DNA sequences of primates: Tempo and mode of evolution. J. Mol. Evol. 18:225–239.
Buck, W.R., and Vitt, D.H. 1986. Suggestions for a new familial classification of pleurocarpous mosses. Taxon, 35: 21–60.
Chase, M.W., Soltis, D.E., Olmstead, R.G., Morgan, D., Les, D.H., Mishler, B.D., Duvall, M.R., Price, R.A., Hills, H.G., and Qiu, Y.L. 1993. Phylogenies of seed plants: An analysis of nucleotide sequences from the plastid gene rbcL. Ann. Mo. Bot. Gard. 80:
528–580.
Chiang, T.Y. 1994. Molecular systematics of the Hylocomiaceae (Order Hypnales) inferred from DNA sequences of the internal transcribed spacers of ribosomal DNA and the atpB–rbcL non- coding spacers of chloroplast DNA. Ph.D. Dissertation, Depart- ment of Biology, Washington University, St. Louis.
Chiang, T.Y., Schaal, B.A., and Peng, C.I. 1998. Universal primers for amplification and sequencing a noncoding spacer between the atpB and rbcL genes of chloroplast DNA. Bot. Bull. Acad.
Sin. (Taipei) 39: 245–250.
Clegg, M.T., Learn, G.H., and Golenberg, E.M. 1991. Molecular evolution of chloroplast DNA. In Evolution of the Molecular Level. Edited by R.K. Selander, A.G. Clark, and T.S. Whittam.
Sinauer Association Inc. Publishers, Sunderland, Mass. pp. 135–
149.
Delcourt, H.R., and Delcourt, P.A. 1991. Quaternary Ecology. A paleoecological perspective. Chapman and Hall, New York.
Doyle, J.J., and Doyle, J.L. 1987. A rapid isolation procedure for small quantities of fresh leaf tissue. Phytochem. Bull. 19: 11–
15.
Efron, B. 1982. The jackknife, the bootstrap, and other resampling plans. CBMS-NSF Regional Conference Series in Applied Mathematics, Monograph 38. Society of Industrial and Applied Mathematics, Philadelphia. pp. 1–92.
Ehrendorfer, F., Manen, J.F., and Natali, A. 1994. cpDNA inter- genic sequences corroborate restriction site data for reconstruct- ing Rubiaceae phylogeny. Plant Syst. Evol. 190: 245–248.
Farris, J.S. 1989. The retention index and homoplasy excess. Syst.
Zool. 38: 406–407.
Felsenstein, J. 1985. Confidence limits on phylogenies: An ap- proach using the bootstrap. Evolution, 39: 783–791.
Golenberg, E.M., Clegg, M., Durbin, M.L., Doebley, J., and Ma, D.P. 1993. Evolution of a noncoding region of the chloroplast genome. Mol. Phylogenet. Evol. 2: 52–64.
Gruissem, W., and Zurawski, G. 1985. Analysis of promoter re- gions for the spinach chloroplast rbcL, atpB and psbA genes.
EMBO J. 4: 3375–3383.
Hasebe, M., Omori, T., Nakazawa, M., Sano, T., Kato, M., and Iwatsuki, K. 1994. rbcL gene sequences provide evidence for the evolutionary lineages of leptosporangiate ferns. Proc. Natl.
Acad. Sci. U.S.A. 91: 5730–5734.
Hedges, S.B. 1992. The number of replications needed for accurate estimation of the bootstrap P value in phylogenetic studies. Mol.
Biol. Evol. 9: 366–369.
Hedwig, J. 1801. Species Muscorum Frondosorum. J.A. Barth, Leip- zig, Germany. pp. 353.
Higgins, D.G, Bleasby, A.J., and Fuchs, R. 1992. CLUSTAL V: Im- proved software for multiple sequence alignment. CABIOS, 8:
189–191.
Hillis, D.M., and Bull, J.J. 1993. An empirical test of bootstrap- ping as a method assessing confidence in phylogenetic analysis.
Syst. Biol. 42: 182–192.
Hillis, D.M., and Huelsenbeck, J.P. 1992. Signal, noise, and reli- ability in molecular phylogenetic analyses. J. Hered. 83: 189–
195.
Hong, K.S., Chen, T.Y., and Chiang, T.Y. 1999. Sequence announce- ment: Promoter of rbcL gene from isolate H002 of Quercus dodonaeifolius. Plant Mol. Biol. 39: 389.
Huelsenbeck, J.P. 1991. Tree-length distribution skewness: An in- dicator of phylogenetic information. Syst. Zool. 40: 257–270.
Kim, K.J., Jansen, R.K., Wallace, R.S., Michaels, H.J., and Palmer, J.D. 1992. Phylogenetic implication of rbcL sequence variation in the Asteraceae. Ann. Mo. Bot. Gard. 79: 428–445.
Kimura, M. 1980. A simple method for estimating evolutionary rates of base substitutions through comparative studies of nucle- otide sequences. J. Mol. Evol. 16: 111–120.
Klassen, G.J., Mooi, R.D., and Locke, A. 1991. Consistency indi- ces and random data. Syst. Zool. 40: 446–457.
Kluge, A.G., and Farris, J.S. 1969. Quantitative phyletics and the evolution of anurans. Syst. Zool. 18: 1–32.
Kocher, T.D., and Wilson, A.C. 1991. Sequence evolution of mito- chondrial DNA in human and chimpanzees: Control region and a protein-coding region. In Evolution of life: Fossils, molecules, and culture. Edited by S. Osawa and T. Honjo. Springer-Verlag, Tokyo.
Kumar, S., Tamura, K., and Nei, M. 1993.MEGA: Molecular Evolu- tionary Genetics Analysis, version 1.01. Pennsylvania State Uni- versity, University Park, Pennsylvania.
Larson, A. 1994. The comparison of morphological and molecular data in phylogenetic systematics. In Molecular Ecology and Evo- lution: Approaches and applications. Edited by B. Schierwater, B.
Streit, G.P. Wagner, and R. DeSalle. Birkhauser Verlag, Basel, Switzerland. pp. 371–390.
Lemoigne, Y. 1970. Nouvfles diagnoses du genre Rhynia et de 1’espece Rhynia gwynne-vaughnii. Bulletin de la société bota- nique de France, 117: 307–320.
Li, W.H. 1997. Molecular evolution. Sinauer, Sunderland, Mass.
Liu, S.L., Chiang, T.Y., and Peng, C.I. 1998. Sequence announce- ment: Promoter of rbcL gene from Begonia chitoensis. Plant Mol. Biol. 38: 907.
Maddison, W.P., and Maddison, D.R. 1992.MACCLADE: Analysis of phylogeny and character evolution, Version 3. Sinauer Associ- ates, Sunderland, Mass.
Manen, J., Savolainen, V., and Simon, P. 1994. The atpB and rbcL promoters in plastid DNAs of a wide dicot range. J. Mol. Evol.
38: 577–582.
Margush, T., and McMorris, F.R. 1981. Consensus n-trees. Bull.
Nath. Biol. 43: 239–244.
Mishler, B.D., and Churchill, S.P. 1984. A cladistic approach to the phylogeny of the “bryophytes.” Brittonia, 36: 406–424.
Mishler, B.D., and de Luna, E. 1991. The use of ontogenetic data in phylogenetic analysis of mosses. Adv. Bryol. 4: 121–167.
Mullet, J.E., Orozco, E.M., and Chua, N. 1985. Multiple tran- scripts for higher plant rbcL and atpB genes and localization of the transcription initiation site of the rbcL gene. Plant Mol. Biol.
4: 39–54.
Natali, A., Manen, J., and Ehrendorfer, F. 1995. Phylogeny of the Rubiaceae-Rubioideae, in particular the tribe Rubieae: Evidence from a non-coding chloroplast DNA sequence. Ann. Mo. Bot.
Gard. 82: 428–439.
Nickrent, D.L., and Soltis, D.E. 1995. A comparison of angio- sperm phylogenies from nuclear 18S rDNA and rbcL sequences.
Ann. Mo. Bot. Gard. 82: 208–234.
Nishizawa, Y., and Hirai, A. 1987. Nucleotide sequence and ex- pression of the gene for the large subunit of rice ribulose 1,5- bisphosphate carboxylase. Jpn. J. Genet. 62: 223–229.
Olmstead, R.G., Michaels, H.J., Scott, K.M., and Palmer, J.D.
1992. Monophyly of the Asteridae and identification of their major lineages inferred from DNA sequences of rbcL. Ann. Mo.
Bot. Gard. 79: 249–265.
Orozco, E.M., Chen, L., and Eilers, R.J. 1990. The divergently transcribed rbcL and atpB genes of tobacco plastid DNA are separated by nineteen base pairs. Curr. Genet. 17: 65–71.
Qiu, Y.L., Chase, M.W., Les, D.H., and Parks, C.R. 1993. Molecu- lar phylogenetics of the Magnoliidae: Cladistic analyses of nu- cleotide sequences of the plastid gene rbcL. Ann. Mo. Bot.
Gard. 80: 587–606.
Palmer, J.D. 1987. Chloroplast DNA evolution and biosystematic uses of chloroplast DNA variation. Am. Nat. 130(Suppl.): S6–
S29.
Pamilo, P., and Nei, M. 1988. Relationships between gene trees and species trees. Mol. Biol. Evol. 5: 568–583.
Rohlf, V.L., and Sokal, R.R. 1981. Statistical Tables. W.H. Free- man and Co., San Franscisco.
Rohrer, J.R. 1985. A generic revision of the Hylocomiaceae. J.
Hattori Bot. Lab. 59: 241–278.
Sanger, F., Nicklen, S., and Coulson, A.R. 1977. DNA sequencing with chain-terminating inhibitors. Proc. Natl. Acad. Sci. U.S.A.
74: 5463–5467.
Sarich, V.M., and Wilson, A.C. 1973. Generation time and genomic evolution in primates. Science, 179: 1144–1147.
Savard, L., Li, P., Strauss, S.H., Chase, M.W., Michaud, M., and Bousquet, J. 1994. Chloroplast and nuclear gene sequences indi- cate late Pennsylvanian time for the last common ancestor of ex- tant seed plants. Proc. Natl. Acad. Sci. U.S.A. 91: 5136–5167.
Savolainen, V., Manen, J.F., Douzery, E., and Spichiger, R. 1994.
Molecular phylogeny of families related to Celastrales based on rbcL 5′flanking sequences. Mol. Phylogenet. Evol. 3: 27–37.
Sears, B.B. 1980. Elimination of plastids during spermatogenesis and fertilization in the plant kingdom. Plasmid, 4: 233–255.
Shinozaki, K., Tanaka, M., Wakasugi, T., Hayashida, N., Matsubayashi, T., Zaita, N., Chunwongse, J., Obokata, J., Yamaguchi-Shinozaki, K., Ohto, C., Torazawa, K., Meng, B.Y., Sugita, M., Deno, H., Karnogashira, T., Yamada, K., Kusuda, J., Takaiwa, F., Kato, A., Tohdoh, N., Shimada, H., and Sugiura, M. 1986. The complete nu- cleotide sequence of tobacco chloroplast genome: Its gene organiza- tion and expression. EMBO J. 5: 2043–2049.
Sokal, R.R., and Rohlf, F.J. 1981. Biometrics. W.H. Freeman, San Francisco.
Swofford, D.L. 1991. When are phylogeny estimates from molecular and morphological data incongruent? In Phylogenetic Analysis of DNA Sequences. Edited by M.M. Miyamoto and J. Cracraft. Ox- ford University Press. New York, Oxford. pp. 295–333.
Swofford, D.L. 1993. PAUP: Phylogenetic Analysis Using Parsi- mony, Version 3. 1. 1. Computer program distributed by the Illi- nois Natural History Survey, Champaign, Ill.
Tamura, K., and Nei, M. 1993. Estimation of the number of nucle- otide substitutions in the control region of mitochondrial DNA in humans and chimpanzees. Mol. Biol. Evol. 10: 512–526.
Templeton, A. 1983. Phylogenetic inference from restriction endo- nuclease cleavage site maps with particular reference to the evo- lution of humans and the apes. Evolution, 37: 221–244.
Umesono, K., Inokuchi, H., Shiki, Y., Takeuchi, M., Chang, Z., Fujuzawa, H., Kochi, T., Shirai, H, Ohayama, K., and Ozeki, II.
1988. Gene organization of the large copy region from rps′12 to atpB. J. Mol. Biol. 203: 299–331.
Vigilant, L., Stoneking, M., Harpending, H., Hawkes, K., and Wil- son, A.C. 1991. African populations and the evolution of human mitochondrial DNA. Science, 253: 1503–1507.
Wang, B., Fang, Q., Williams, W.V., and Weuber, D.B. 1992. Dou- ble-stranded DNA sequencing by linear amplification with Taq DNA polymerase. BioTec. 13: 527–529.
Wu, C.I., and Li, W.H. 1985. Evidence for higher rates of nucleo- tide substitution in rodents than in man. Proc. Natl. Acad. Sci.
U.S.A. 82: 1741–1745.
Wu, W.L., Wang, J.P., Tseng, M.C., and Chiang, T.Y. 1999. Clon- ing and genetic variability of an Hind III repetitive DNA in Acrossocheilus paradoxus (Cyprinidae). Genome, 42: 780–788.
Yoshinaga, K., Kubota, Y., Ishii, T., and Wada, K. 1992. Nucleo- tide sequence of atpB, rbcL, trnR, dedB and psaL chloroplast genes from a fern Angiopteris lygodiifolia: A possible emer- gence of Spermatophyta lineage before the separation of Bryophyta and Pteridophyta. Plant Mol. Biol. 18: 79–82.
Zuckerkandl, E., and Pauling, L. 1965. Evolutionary divergence and convergence in proteins. In Evolving genes and proteins.
Edited by V. Bryson and H.J. Vogel. Academic Press, New York.
pp. 97–166.
Zurawski, G., and Clegg, M.T. 1987. Evolution of higher-plant chloroplast DNA-encoded genes: Implications for structure- function and phylogenetic studies. Ann. Rev. Plant Physiol. 38:
391–418.
Zurawski, G., Clegg, M.T., and Brown, A.D.H. 1984. The nature of nu- cleotide sequence divergence between barley and maize chloroplast DNA. Genetics, 106: 735–749.