科技部補助專題研究計畫成果報告
期末報告
AI於生醫之認知雲端與神經型態運算-深度學習與人及機器的互
動對阿滋海默的早期發現(2/4)
計 畫 類 別 : 整合型計畫 計 畫 編 號 : MOST 108-2634-F-006-009-執 行 期 間 : 108年01月01日至108年07月31日 執 行 單 位 : 國立成功大學機械工程學系(所) 計 畫 主 持 人 : 吳馬丁 共 同 主 持 人 : 郭余民 計畫參與人員: 碩士級-專任助理:那大衛 碩士級-專任助理:白伊娃 學士級-專任助理:林菀其 碩士班研究生-兼任助理:蔡帛融 碩士班研究生-兼任助理:張舜傑 碩士班研究生-兼任助理:游景琦 碩士班研究生-兼任助理:許桓維 碩士班研究生-兼任助理:吳雨衡 碩士班研究生-兼任助理:陳品璁 碩士班研究生-兼任助理:賴柏毓 碩士班研究生-兼任助理:林佳明 碩士班研究生-兼任助理:伍錫志 碩士班研究生-兼任助理:王建智 碩士班研究生-兼任助理:嚴焌榮 碩士班研究生-兼任助理:邱柏蓉 碩士班研究生-兼任助理:黃宇安 碩士班研究生-兼任助理:黃柏喻 碩士班研究生-兼任助理:普莎夏 大專生-兼任助理:許睦辰 大專生-兼任助理:李迪生 博士班研究生-兼任助理:陳正慧 博士班研究生-兼任助理:張禾孟 博士班研究生-兼任助理:亞歷山卓海曼博士班研究生-兼任助理:艾羅曼 博士後研究-博士後研究:劉一帆 博士後研究-博士後研究:艾克拉 博士後研究-博士後研究:毛葆拉
本研究具有政策應用參考價值:■否 □是,建議提供機關
(勾選「是」者,請列舉建議可提供施政參考之業務主管機關)
本研究具影響公共利益之重大發現:□否 □是
中 華 民 國 108 年 11 月 07 日
中 文 摘 要 : 自從ImageNet LSVRC-2012競賽以來,人工智慧,尤其是深度學習成 為工業4.0的重要元素。狹義人工智慧(弱人工智能)能快速的成功有 四大因素:帶標籤的大數據、GPU高性能運算、開源軟體以及演算法 。在疾病研究上,如阿茲海默症,其資料非常難取得,使得此研究 難以推進,目前的人工神經網路仍需要大量的數據。目前台灣在 AI發展這塊領域仍是遲滯不前 。 我們欲建立以應用為出發點來發展基礎研究,著重在建立一個藉由 人類幼兒的學習方式來啟發人工神經網路的新學習方法.期待此計 畫能將台灣推向全球網絡.我們將在幼兒玩具裡嵌入多重傳感器 ,以追蹤幼兒的學習過程.這每天且長達多年的時間序列資料,將 會以動態系統來解釋學習過程。 我們將從動態黑盒子系統、神經網 路系統,以及我們國際合作團隊:瑞典皇家工學院的Hellgren Kotaleski博士發展的細胞/微電路尺度模型來進行測試。這個得到 的模組,很有潛力成為第一個應用在幼兒感覺運動功能發展上的動 態模組. 基於上述概念,我們試圖創造一個能夠減少卷積神經網路所需樣本 數的學習戰略,以利於我們可以從神經影像 (neuroimaging) 預測 在有輕微辨識障礙前的阿茲海默症病友的發病時間。根據類澱粉蛋 白假說,當腦中的β-類澱粉蛋白增加會導致突觸及神經元損傷以致 引發癡呆症,此損傷至今證實是不可修復的,其治療的關鍵在於發 病前的早期預測。我們會與台灣、美國、加拿大以及瑞典實驗團隊 合作,一起組成最大規模的阿茲海默症核磁共振造影資料庫,此資 料庫將可用來訓練卷積神經網路以預測阿茲海默症的發病時間以及 認知能力的改變。 這個計畫是李國君教授主持的「人工智慧認知雲以及用於生物醫藥 的仿神經計算」整合計畫中的一部份。經由這個跨領域研究,未來 能吸引到國內外超過二十名國內外學生並將他們培育成人工智慧方 面的專家,此外,我們預計將創新創業,將這個創新理念商品化 ,為社會帶來貢獻。 中 文 關 鍵 詞 : 人工智能(AI);人工神經網絡(ANN);深度學習;弱人工智能 (ANI);阿茲海默病(AD);系統生物學;生物資訊學 ;反向工 程 ;系統辨識
英 文 摘 要 : Artificial intelligence (AI), in particular Deep learning, has since the ImageNet LSVRC-2012 contest established itself as one of the core technologies driving the 4th industrial revolution with a many commercial applications. This rapid success of Artificial narrow intelligence (ANI) is due to four factors: big labelled data, GPU accelerated distributed computing, open source software, and
algorithms. Labelled training data for many diseases, such as Alzheimer’s disease (AD), is however scarce and costly. Humans can learn from a single example, while artificial neural networks (ANNs) require orders of magnitude more samples. Currently, Taiwan is lagging behind in the
application driven basic research focused on creation of new learning methods for ANNs inspired by how children learn. We will track the complexity of the sensorimotor function and learning process in children based on sensors embedded in toys during play at home. The daily time-series data acquired over multiple years will be interpreted in a dynamical systems theory framework, which has arisen as a popular theory of cognitive development in the last decade. We will test dynamical black box system models, neural networks, and established system and cellular/microcircuit level models of neuronal mechanisms developed by our
international collaborator Dr. Hellgren Kotaleski at KTH Royal Institute of Technology/Karolinska Institutet in Sweden. These models will likely be the first dynamical models of sensorimotor function development in individual children.
Based on these insights, we intend to invent a learning strategy that decreases the number of samples needed for learning of deep convolutional neural networks (DCNNs), so that we can predict onset of AD from neuroimaging data before signs of mild cognitive impairment. According to the amyloid hypothesis, increased levels of the amyloid-β protein in the brain lead to damage and dysfunction of affected synapses and neurons causing dementia. Since this damage so far has proven irreparable, early detection of onset is thought to be the key to treatment. Through our collaborators in Taiwan, U.S.A., Canada, and Sweden, we intend to compose the largest magnetic resonance imaging (MRI) dataset of confirmed AD cases. This MRI dataset will be used to train a DCNN to predict onset of AD and changes in cognitive ability.
This project is part of the integrated project “AI Cognitive Cloud and Neuromorphic Computing for
Biomedicine” lead by Prof. Chris Lee. Through this cross-disciplinary research we will attract and train >20
domestic and international students as AI professionals. Together we plan to form a startup to commercialise the innovations for the benefit of the society.
英 文 關 鍵 詞 : Artificial intelligence (AI);Artificial neural networks (ANNs);Deep learning;Artificial narrow intelligence (ANI);Alzheimer’s disease (AD);Systems
biology;Bioinformatics;Reverse engineering;System identification
科技部補助專題研究計畫成果報告
(
□期中進度報告(midterm)/
■ 期末報告(final report))
(計畫名稱)
AI 於生醫之認知雲端與神經型態運算-深度學習與人及機器的互動
對阿滋海默的早期發現(grant name)
計畫類別:
■個別型計畫(personal grant) □整合型計畫(integrated grant)
計畫編號:MOST 108-2634-F-006-009-
執行期間:
107 年 1 月 1 日至 108 年 7 月 31 日
執行機構及系所:國立成功大學機械工程學系
(所)(Institute)
計畫主持人:吳馬丁助理教授
共同主持人:郭余民
計畫參與人員:陳正慧
,張禾孟,亞歷山卓海曼,艾羅曼,嚴焌榮,黃柏喻,許睦辰,
邱柏蓉
,黃宇安,蔡帛融,張舜傑,游景琦,普莎夏,許桓維,吳雨衡,陳品璁,賴柏毓, 林佳
明
,伍錫志,王建智,歐維特,夏逢駿,周恆穎,李迪生,希帕爾,許雅萍,林菀其,白伊娃,那
大衛
,劉一帆,艾克拉,毛葆拉
(people involved)
本計畫除繳交成果報告外,另含下列出國報告,共
__ 份:
□執行國際合作與移地研究心得報告 (international cooperation)
□出席國際學術會議心得報告 (international conference)
□出國參訪及考察心得報告 (visiting)
目錄
目錄 ... I 中文摘要 ... II ABSTRACT ... III 報告內容 ... 4 1. PURPOSE AND AIMS ... 4 Purpose ... 4 Aims ... 5 2. RESEARCH OUTCOME ... 5 3. PUBLICATION LIST ... 37 Journal publications ... 37 Conference publications ... 38 Data, Databases, Toys, Tools, Software, and Services ... 38 國科會補助專題研究計畫成果報告自評表 ... 40 1. 請就研究內容與原計畫相符程度、達成預期目標情況作一綜合評估 ... 40 2. 研究成果在學術期刊發表或申請專利等情形 ... 42 3. 請依學術成就、技術創新、社會影響等方面,評估研究成果之學術或應用價值 ... 43 4. DETAILED COMPARISON TO THE ANTICIPATED RESEARCH OUTCOME ... 43中英文摘要
中文摘要
自從 ImageNet LSVRC-2012 競賽以來,人工智慧,尤其是深度學習成為工 業 4.0 的重要元素。狹義人工智慧(弱人工智能)能快速的成功有四大因素:帶標籤 的大數據、GPU 高性能運算、開源軟體以及演算法。在疾病研究上,如阿茲海默 症,其資料非常難取得,使得此研究難以推進,目前的人工神經網路仍需要大量的 數據。目前台灣在AI 發展這塊領域仍是遲滯不前 。 我們欲建立以應用為出發點來發展基礎研究,著重在建立一個藉由人類幼兒 的學習方式來啟發人工神經網路的新學習方法.期待此計畫能將台灣推向全球網絡. 我們將在幼兒玩具裡嵌入多重傳感器,以追蹤幼兒的學習過程.這每天且長達多年 的時間序列資料,將會以動態系統來解釋學習過程。 我們將從動態黑盒子系統、 神經網路系統,以及我們國際合作團隊:瑞典皇家工學院的 Hellgren Kotaleski 博 士發展的細胞/微電路尺度模型來進行測試。這個得到的模組,很有潛力成為第一 個應用在幼兒感覺運動功能發展上的動態模組. 基於上述概念,我們試圖創造一個能夠減少卷積神經網路所需樣本數的學習 戰略,以利於我們可以從神經影像 (neuroimaging) 預測在有輕微辨識障礙前的阿茲 海默症病友的發病時間。根據類澱粉蛋白假說,當腦中的 β-類澱粉蛋白增加會導 致突觸及神經元損傷以致引發癡呆症,此損傷至今證實是不可修復的,其治療的關 鍵在於發病前的早期預測。我們會與台灣、美國、加拿大以及瑞典實驗團隊合作, 一起組成最大規模的阿茲海默症核磁共振造影資料庫,此資料庫將可用來訓練卷積 神經網路以預測阿茲海默症的發病時間以及認知能力的改變。 這個計畫是李國君教授主持的「人工智慧認知雲以及用於生物醫藥的仿神經 計算」整合計畫中的一部份。經由這個跨領域研究,未來能吸引到國內外超過二十 名國內外學生並將他們培育成人工智慧方面的專家,此外,我們預計將創新創業, 將這個創新理念商品化,為社會帶來貢獻。 關鍵字:人工智能(AI),人工神經網絡(ANN),深度學習,弱人工智能(ANI), 阿茲海默病(AD),系統生物學、生物資訊學 、反向工程 、系統辨識Abstract
Artificial intelligence (AI), in particular Deep learning, has since the ImageNet LSVRC-2012 contest established itself as one of the core technologies driving the 4th industrial revolution with a many commercial applications. This rapid success of Artificial narrow intelligence (ANI) is due to four factors: big labelled data, GPU accelerated distributed computing, open source software, and algorithms. Labelled training data for many diseases, such as Alzheimer’s disease (AD), is however scarce and costly. Humans can learn from a single example, while artificial neural networks (ANNs) require orders of magnitude more samples. Currently, Taiwan is lagging behind in the adoption and development of AI.
We intend to put Taiwan on the global AI map through application driven basic research focused on creation of new learning methods for ANNs inspired by how children learn. We will track the complexity of the sensorimotor function and learning process in children based on sensors embedded in toys during play at home. The daily time-series data acquired over multiple years will be interpreted in a dynamical systems theory framework, which has arisen as a popular theory of cognitive development in the last decade. We will test dynamical black box system models, neural networks, and established system and cellular/microcircuit level models of neuronal mechanisms developed by our international collaborator Dr. Hellgren Kotaleski at KTH Royal Institute of Technology/Karolinska Institutet in Sweden. These models will likely be the first dynamical models of sensorimotor function development in individual children.
Based on these insights, we intend to invent a learning strategy that decreases the number of samples needed for learning of deep convolutional neural networks (DCNNs), so that we can predict onset of AD from neuroimaging data before signs of mild cognitive impairment. According to the amyloid hypothesis, increased levels of the amyloid-β protein in the brain lead to damage and dysfunction of affected synapses and neurons causing dementia. Since this damage so far has proven irreparable, early detection of onset is thought to be the key to treatment. Through our collaborators in Taiwan, U.S.A., Canada, and Sweden, we intend to compose the largest magnetic resonance imaging (MRI) dataset of confirmed AD cases. This MRI dataset will be used to train a DCNN to predict onset of AD and changes in cognitive ability.
This project is part of the integrated project “AI Cognitive Cloud and Neuromorphic Computing for Biomedicine” lead by Prof. Chris Lee. Through this cross-disciplinary research we will attract and train >20 domestic and international students as AI professionals. Together we plan to form a startup to commercialise the innovations for the benefit of the society.
Keywords: Artificial intelligence (AI), Artificial neural networks (ANNs), Deep learning, Artificial narrow intelligence (ANI), Alzheimer’s disease (AD), Systems biology, Bioinformatics, Reverse engineering, System identification
報告內容
1. Purpose and aims
Figure 1 Overview of the three parts of this project.
Purpose
A. Train 2 PostDocs, 7 Ph.D. students, and 15 M.Sc. students in Deep learning. Note that we used different applications for training to give a broad base of knowledge. B. Invent and implement a new learning method for Artificial Neural
Networks (ANNs) that requires less data and mimics the way kids learn. 1. Study cognitive development in kids through collection of sensorimotor data
using custom built smart toys with sensors.
2. Build a dynamical model of sensorimotor function.
3. Invent and implement regularisation in learning of ANNs inspired by the learning and natural removal of synapses in kids.
C. Train an ANN to detect onset of Alzheimer’s disease before cognitive impairment
Confidential research Copyright 2018 by Torbjörn Nordling ([email protected]) Problems addressed in “Deep learning in man and machine for early detection of Alzheimer’s disease” 2 Problem Solution Shortage of AI engineers and researchers
in Taiwan and globally. Educate 2 PostDocs, 7 PhDs, and 15 Masters over 4 years. Data for Alzheimer’s Disease (AD) is scarce, however training of artificial neural networks (ANNs) requires ~100 times more data samples than a human needs. Smart toys for studying learning in children in order to create a method for training of ANNs that requires less data. Key part of project. AD is diagnosed too late, after irreparable cognitive impairment. Apply algorithm inspired by insights from our study of learning in children to train an ANN on existing neuroimaging data for early detection of AD.
Aims
To build an AI innovation ecosystem trained skilled workers are needed. In this project we have a focus on attracting talented students and training them to become AI professionals. The new learning method will enable use of artificial neural networks within new applications where training data is too scarce today. This will provide Taiwanese industry an advantage through the >20 students trained to become AI professionals. The selected application—early detection of Alzheimer’s disease—is an example with potential to reduce suffering of millions with AD and healthcare costs by billions. The ability of ANNs to learn from a single example, like humans, would be a leap towards human level intelligence.
Since this project was terminated after the first year with a marginal bridge budget for 7 months only the second year, performance should be evaluated relative to the objectives for the first year. During the first year, the key objectives of the project were:
A. Training and recruitment:
1. Train 1 Ph.D. student, and 2 M.Sc. students in basic Deep learning. 2. Recruit 1 PostDoc, 1 Ph.D. student, 3 M.Sc. students, 1 Administrative
assistant.
3. Distribute the advertisement of the Ph.D. student positions in the Nordling Lab in 8 countries (U.K., Sweden, Germany, Japan, Turkey, India,
Indonesia, Chile)
4. Prof. Nordling should visit an internationally recognised AI lab.
B. Learning in children and learning of Artificial Neural Networks (ANNs):
1. Create the first prototype of 2 smart toys. 2. Start data collection.
3. Preliminary toy data analysis. 4. Start benchmark of regularization 5. Start benchmark of learning rules
6. Contact AI experts reachable through Prof. Nordling’s network
C. Detection of onset of Alzheimer’s disease(AD):
1. Start composing AD dataset.
2. Develop databases, tools, and software as part of the training of the students.
2. Research outcome
Here we will provide an overview of the research outcomes produced by this project, summarized in the form of abstracts and key figures from the published, submitted, or working manuscripts. Note that the abstracts of submitted and working manuscripts are subject to potential change before publication. Literature review, methods, results and conclusions, and future recommendations are all described in these publications. We therefore kindly refer any interested reader to these articles, instead of repeating all of it
here. For the convenience of the reader we here use the same figure numbers as in the original article. A few of the published articles are based on previous projects that were finished during this project and that helped build the competence needed for this project, e.g. database and web service construction.
Mesoscopic physical removal of material using sliding nanodiamond contacts
Authors: Umberto Celano, Feng-Chun Hsia, Danielle Vanhaeren, Kristof Paredis, Torbjörn E. M. Nordling, Josephus G. Buijnsters, Thomas Hantschel and Wilfried Vandervorst.
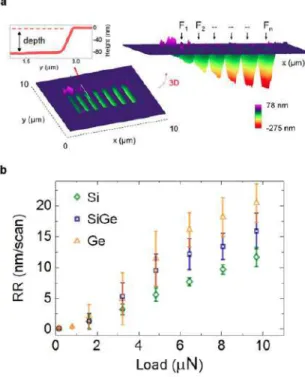
Scientific Reports,8(1):2994, feb 2018. (IF: 4.259, Multidisciplinary Sci. Rank: 10/64) Wear mechanisms including fracture and plastic deformation at the nanoscale are central to understand sliding contacts. Recently, the combination of tip-induced material erosion with the sensing capability of secondary imaging modes of AFM, has enabled a slice-and-view tomographic technique named AFM tomography or Scalpel SPM. However, the elusive laws governing nanoscale wear and the large quantity of atoms involved in the tip-sample contact, require a dedicated mesoscale description to understand and model the tip-induced material removal. Here, we study nanosized sliding contacts made of diamond in the regime whereby thousands of nm3 are removed. We explore the fundamentals of high-pressure tip-induced material removal for various materials. Changes in the load force are systematically combined with AFM and SEM to increase the understanding and the process controllability. The nonlinear variation of the removal rate with the load force is interpreted as a combination of two contact regimes each dominating in a particular force range. By using the gradual transition between the two regimes, (1) the experimental rate of material eroded on each tip passage is modeled, (2) a controllable removal rate below 5 nm/scan for all the materials is demonstrated, thus opening to future development of 3D tomographic AFM.
Figure 2. Experimental removal rate as a function of load forces. (a) Trench depths as seen by AFM topographical measurements across seven previously machined regions (size 4 µm °— 500 nm) with increasing load force (F1 < F2… < Fn). (b) Dependence of the removal rate on the tip load force for Si, SiGe and Ge for a diamond tip scanned in contact with the sample’s surface.
HRPDviewer: human ribosome profiling data viewer
Authors: Wei-Sheng Wu, Yu-Xuan Jiang , Jer-Wei Chang , Yu-Han Chu , Yi-Hao Chiu , Yi-Hong Tsao , Torbjörn E.M. Nordling, Yan-Yuan Tseng and Joseph T. Tseng Database, jul 2018. (IF: 3.978, Math. & Comp. Biol. Rank: 4/59)
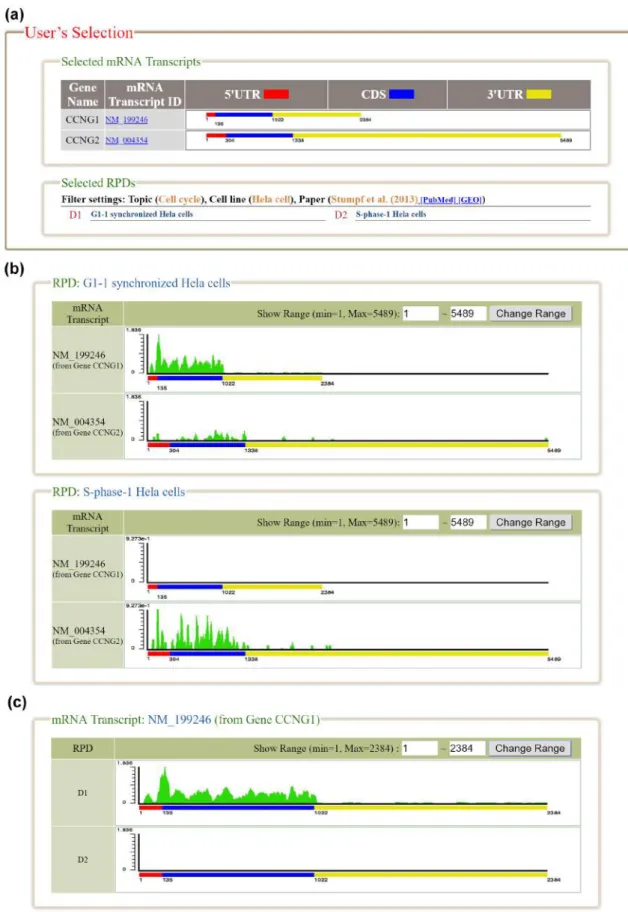
Translational regulation plays an important role in protein synthesis. Dysregulation of translation causes abnormal cell physiology and leads to diseases such as inflammatory disorders and cancers. An emerging technique, called ribosome profiling (ribo-seq), was developed to capture a snapshot of translation. It is based on deep sequencing of ribosome-protected mRNA fragments. A lot of ribo-seq data have been generated in various studies, so databases are needed for depositing and visualizing the published ribo-seq data. Nowadays, GWIPS-viz, RPFdb and TranslatomeDB are the three largest databases developed for this purpose. However, two challenges remain to be addressed. First, GWIPSviz and RPFdb databases align the published ribo-seq data to the genome. Since ribo-seq data aim to reveal the actively translated mRNA transcripts, there are advantages of aligning ribo-req data to the transcriptome over the genome . Second, Trans latomeDB does not provide any visualization and the other two databases only provide visualization of the ribo-seq data around a specific genomic location, while simultaneous visualization of the ribo-seq data on multiple mRNA transcripts produced from the same gene or different genes is desired. To address these two challenges, we developed the HRPDviewer (Human Ribosome Profiling Data viewer). HRPDviewer (i) contains 610 published human ribo-seq datasets from Gene Expression Omnibus (GEO), (ii) aligns the ribo-seq data to the transcriptome, and (iii) provides visualization of the ribo-seq data on the selected mRNA transcripts. Using HRPDviewer, researchers can compare the ribosome binding patterns of multiple mRNA transcripts from the same gene or different genes to gain an accurate understanding of protein synthesis in human cells. We believe that HRPDviewer is a useful resource for researchers to study translational regulation in human.
Database URL: http://cosbi4.ee.ncku.edu.tw/HRPDviewer/ or http://cosbi5.ee.ncku.edu.tw/HRPDviewer/.
Figure 3. The result page of the search mode. (a) The information about the selected mRNA transcripts and RPDs is provided. (b) The ribosome bind- ing patterns on different mRNA transcripts in the same RPD are shown. (c) The ribosome binding patterns on the same mRNA transcript in different RPDs are shown.
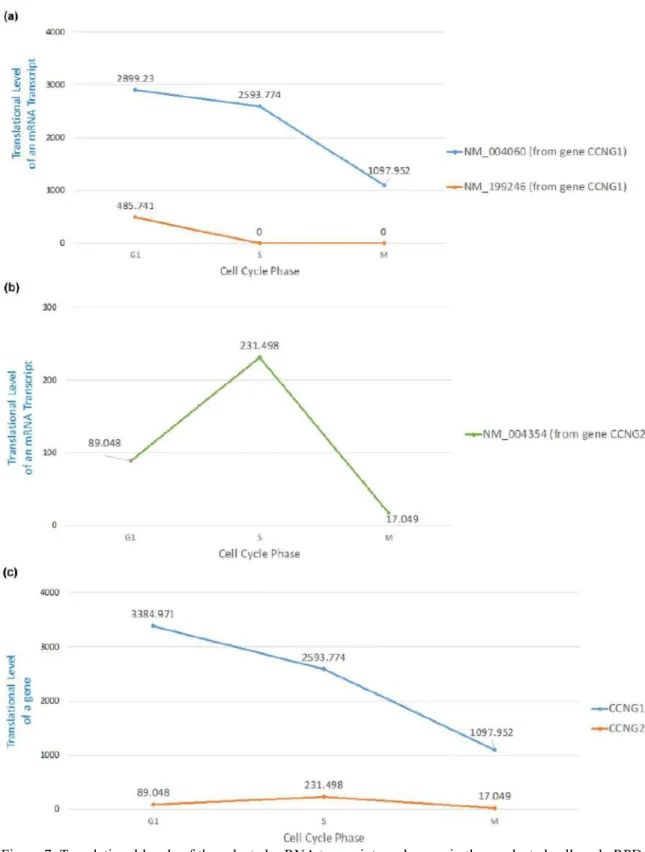
Figure 7. Translational levels of the selected mRNA transcripts and genes in three selected cell cycle RPDs (G1 phase, S phase and M phase). (a) The translational levels of NM_004060 and NM_199246 (the two mRNA isoforms of the gene CCNG1) are shown. (b) The translational levels of NM_004354 (the mRNA transcript of the gene CCNG2) are shown. (c) The translational levels of the genes CCNG1 and CCNG2 are shown.
A crowdsourced analysis to identify ab initio molecular signatures predictive of susceptibility to viral infection
Authors: Slim Fourati, Aarthi Talla, Mehrad Mahmoudian, Joshua G Burkhart, Riku Klen, Ricardo Henao, Zafer Aydin, Ka Yee Yeung, Mehmet Eren Ahsen, Reem Almugbel, Samad Jahandideh, Xiao Liang, Torbjörn E.M. Nordling, et al.
Nature Communications, 9(1):4418, oct 2018. (IF: 12.353, Multidisciplinary Sci. Rank: 3/64)
The response to respiratory viruses varies substantially between individuals, and there are currently no known molecular predictors from the early stages of infection. Here we conduct a community-based analysis to determine whether pre- or early post-exposure molecular factors could predict physiologic responses to viral exposure. Using peripheral blood gene expression profiles collected from healthy subjects prior to exposure to one of four respiratory viruses (H1N1, H3N2, Rhinovirus, and RSV), as well as up to 24 h following exposure, we find that it is possible to construct models predictive of symptomatic response using profiles even prior to viral exposure. Analysis of predictive gene features reveal little overlap among models; however, in aggregate, these genes are enriched for common pathways. Heme metabolism, the most significantly enriched pathway, is associated with a higher risk of developing symptoms following viral exposure. This study demonstrates that pre-exposure molecular predictors can be identified and improves our understanding of the mechanisms of response to respiratory viruses.
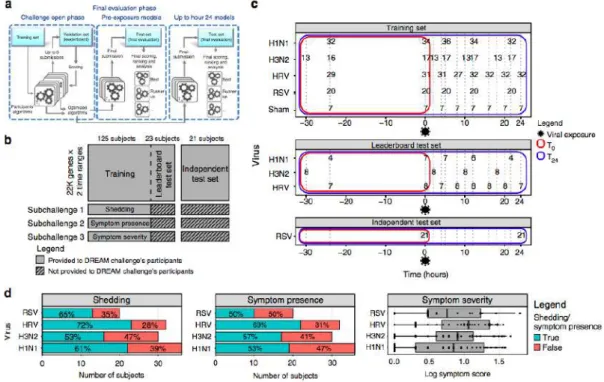
Fig. 1 Respiratory Viral DREAM Challenge overview. a Schematic representation of the Respiratory Viral DREAM Challenge workflow. Participants used feedback from evaluation on the leaderboard test set to optimize their T0 and T24 models, and submitted a single model, per timepoint, for final evaluation on the
Independent Test Set. b Schematic representing the data provided to participants. 125 subjects were provided as training data, 23 subjects were provided as a leaderboard test set, and 21 subjects from an independent data set were used for final evaluation. c Challenge data come from seven viral exposure trials with sham or one of four different respiratory viruses (H1N1, H3N2, Rhinovirus, and RSV). In each of these trials, healthy volunteers were followed for 7−9 days following controlled nasal exposure to one respiratory virus. Blood was collected and gene expression of peripheral blood was performed 1 day (24−30 h) prior to exposure, immediately prior to exposure and at regular intervals following exposure. Data were split into a training, leaderboard, and independent test set. Outcome data for the leaderboard and independent test set were not provided to the teams, but instead, teams were asked to predict them based on gene expression pre-exposure (T0) or up to 24 h post-exposure (T24). d Histograms and boxplot of the three outcomes by viruses. Symptom data and nasal lavage samples were collected from each subject on a repeated basis over the course of 7−9 days. Viral infection was quantified by measuring the release of viral particles from viral culture or by qRT-PCR (viral shedding). Symptomatic data were collected through self-report on a repeated basis. Symptoms were quantified using a modified Jackson score, which assessed the severity of eight upper respiratory symptoms (runny nose, cough, headache, malaise, myalgia, sneeze, sore throat, and stuffy nose). On the boxplot, the lower whisker, the lower hinge, the mid hinge, the upper hinge and the upper whisker correspond to −1.5× the interquartile (IQR) from the first quartile, the first quartile, the median, the third quartile and 1.5× IQR from the third quartile of the log symptom score, respectively
Fig. 2 Models perform better than expected at random. Observed −log10(p value) versus the null expectation for submitted predictions for predicting a presence of symptoms (SC2) and b log symptom score (SC3), where p values were assessed by permutation of the predictions relative to the true values. For both subchallenges significant enrichment of p values (Kolmogorov–Smirnov test for enrichment p value 0.008, 0.002, 0.021, and 0.05 for AUPR(T0), AUROC(T0), AUPR(T24), and AUROC(T24), respectively, for presence of symptoms, and one-sided Kolmogorov–Smirnov test for enrichment p value 0.005 and 0.035 for T0 and T24, respectively, for log symptom score) across submissions demonstrates that pre-exposure and early post-pre-exposure transcriptomic data can predict susceptibility to respiratory viruses
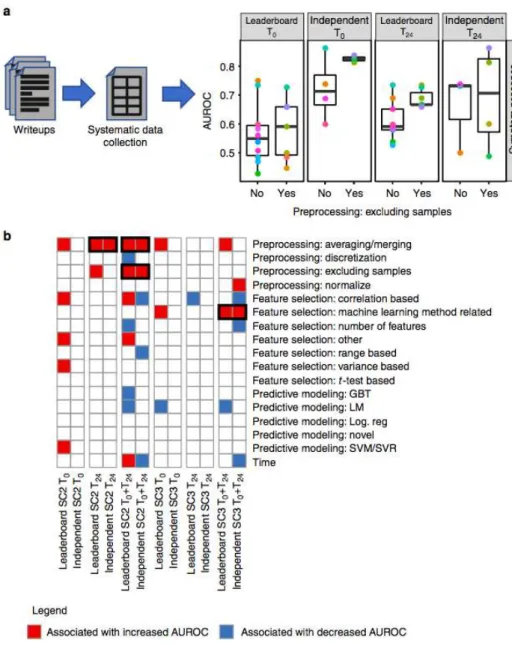
Fig. 3 Preprocessing leads to more accurate predictions. a Schematic representation of the analysis of the participating teams’ writeups to identify methodological steps associated with more accurate prediction of symptoms. First, the writeups were manually inspected to identify the preprocessing, feature selection and predictive modeling method used by each team. Second, the methods were regrouped into general categories across teams. Third, each general method was assessed for its association with predictive model accuracies on the leaderboard test set and the independent test set. On the boxplot, the lower whisker, the lower hinge, the mid hinge, the upper hinge and the upper whisker correspond to −1.5× IQR from the first quartile, the first quartile, the median, the third quartile and 1.5× IQR from the third quartile of the AUROC, respectively. b Heatmap showing the association of each general method with prediction ability (i.e. AUROC for SC2 (prediction of symptom presence) and Pearson’s correlation coefficient for SC3 (prediction of symptom severity)). For each general method, a Wilcoxon rank-sum test was used to assess the association between using the method (coded as a binary variable) and prediction ability.
Fig. 4 Overlap and pathway enrichment among predictors of symptoms. a Percent of team combinations showing statistically significant intersections of predictors at T0 and T24. Only teams with AUROC ≥ 0.5 or r ≥ 0 for subchallenges 2 and 3, respectively, were used for this analysis. The x-axis indicates the number of teams included in the combination. For example, the value 2 corresponds to pairwise overlaps, 3 corresponds to 3-way overlaps, etc. The yaxis indicates the percentage of team combinations with a statistically significant (p value < 0.05) predictor intersection. Point size indicates median intersection size of predictors among team combinations with significant predictor intersection; “X” indicates no significant predictor intersection. b Pathway enrichment among predictors of infection for each subchallenge (SC2 and SC3) at T0 and T24. The x-axis indicates subchallenge and each grid indicates timepoint. The y-axis indicates pathways enriched among predictors with a Benjamini−Hochberg-corrected Fisher’s exact test p value < 0.05. Point size represents the Fisher’s exact test enrichment −log10(p value). Point colors indicate whether the pathway was associated with symptoms (red) or lack thereof (blue). Pathways shared between both SC2 and SC3 at each timepoint are highlighted in gray. Pathways are ordered by the decreasing maxP test statistic as determined in Supplementary Figure 5. c GeneMANIA network of the union of predictors involved in the Heme metabolism pathway across timepoints (T0 and T24) and subchallenges (SC2 and SC3). Edges are inferred by GeneMANIA51 corresponding to coexpression (gray), physical interactions (orange), and genetic interactions (purple) among genes. Node size corresponds to the number of teams that selected the predictor
YHMI: a web tool to identify histone modifications and histone/chromatin regulators from a gene list in yeast
Authors: Wei-Sheng Wu, Hao-Ping Tu, Yu-Han Chu, Torbjörn E M Nordling, Yan-Yuan Tseng, and Hung-Jiun Liaw.
Database, oct 2018. (IF: 3.978, Math. & Comp. Biol. Rank: 4/59)
Post-translational modifications of histones (e.g. acetylation, methylation, phosphorylation and ubiquitination) play crucial roles in regulating gene expression by altering chromatin structures and creating docking sites for histone/chromatin regulators. However, the combination patterns of histone modifications, regulatory proteins and their corresponding target genes remain incompletely understood. Therefore, it is advantageous to have a tool for the enrichment/depletion analysis of histone
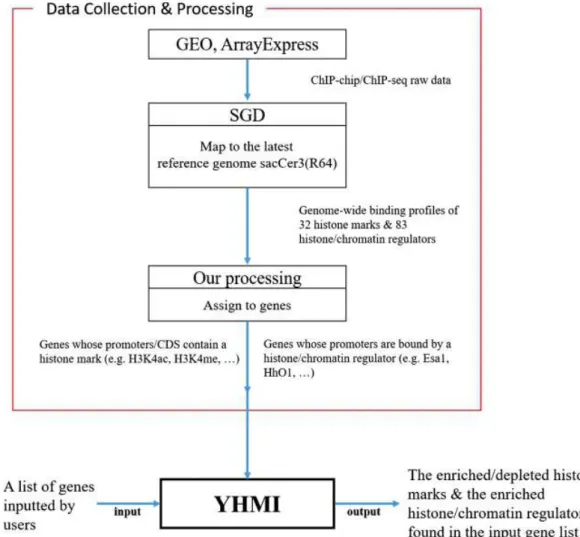
modifications and histone/chromatin regulators from a gene list. Many ChIP-chip/ChIP-seq datasets of histone modifications and histone/chromatin regulators in yeast can be found in the literature. Knowing the needs and having the data motivate us to develop a web tool, called Yeast Histone Modifications Identifier (YHMI), which can identify the enriched/depleted histone modifications and the enriched histone/chromatin regulators from a list of yeast genes. Both tables and figures are provided to visualize the identification results. Finally, the high-quality and biological insight of the identification results are demonstrated by two case studies. We believe that YHMI is a valuable tool for yeast biologists to do epigenetics research.
Figure 1. YHMI includes the ChIP-chip/ChIP-seq datasets of 32 histone marks and 83 histone/chromatin regulators
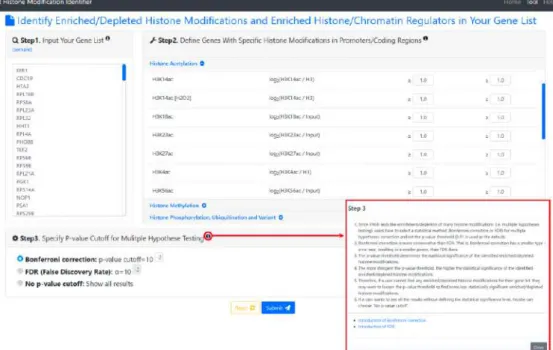
Figure 2. The input page. To use YHMI, users have to go through a three-step process
Figure 3. The result page (first part). The first part of the result page contains the information of the user’s settings. Uniquely, users can download all the sets of genes containing specific histone modifications defined by the users for further investigation.
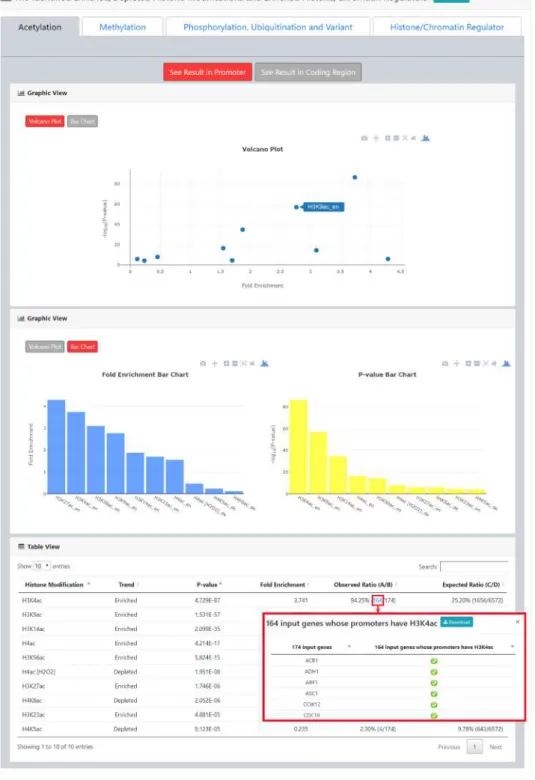
Figure 4. The result page (second part). The second part of the result page provides tables and figures to show the identified enriched/depleted histone modifications (acetylation, methylation, phosphorylation, ubiquitination and histone variant) in the promoters/coding regions of the input gene list. The table contains the name of the histone modification, trend (enriched/depleted), P-value, fold enrichment, observed ratio and expected ratio. Moreover, two kinds of figures (a volcano plot and two-bar charts) are also provided for visualization.
Figure 5. The result page (third part). The third part of the result page provides tables and figures to show the identified
enriched histone/chromatin regulators in the promoters of the input gene list. The table contains the name of the histone/chromatin regulator, temperature, P-value, fold enrichment, observed ratio and expected ratio. Moreover, two kinds of figures (a volcano plot and two-bar charts) are also provided for visualization.
Figure 6. The identification results for the Esa1-targeting promoters. (a) YHMI identified four enriched
acetylations (H3K4ac, H3K14ac, H3K9ac and H4ac). (b) YHMI identified two enriched methylations (H3K4me3 and H3K36me3) and one depleted methylation (H3K79me2). (c) YHMI identified one enriched ubiquitination (H2BK123ub).
Realization and direct observation of five normal and parametric modes in silicon nanowire resonators by in situ transmission electron microscopy.
Zhou, Masanori Mitome, Yoshio Bando, Torbjörn E. M. Nordling, and Dmitri Golberg. Nanoscale Advances, feb 2019. ISSN 2516- 0230. doi: 10.1039/C8NA00373D.
Mechanical resonators have wide applications in sensing bio-chemical substances, and provide an accurate method to measure the intrinsic elastic properties of oscillating materials. A high resonance order with high response frequency and a small resonator mass are critical for enhancing the sensitivity and precision. Here, we report on the realization and direct observation of high-order and high-frequency silicon nanowire (Si NW) resonators. By using an oscillating electric-field for inducing a mechanical resonance of singlecrystalline Si NWs inside a transmission electron microscope (TEM), we observed resonance up to the 5th order, for both normal and parametric modes at 100 MHz frequencies. The precision of the resonant frequency was enhanced, as the deviation reduced from 3.14% at the 1st order to 0.25% at the 5th order, correlating with the increase of energy dissipation. The elastic modulus of Si NWs was measured to be 169 GPa in the [110] direction, and size scaling effects were found to be absent down to the 20 nm level.
Fig. 1 TEM characterization of a Si NW. (a) The Si NW’s length (L) was measured under careful calibration of the tilt angle and TEM magni- fication. (b) The high magnification TEM image shows a thin silicon oxide (SiO2) layer on the surface. (c) The high-resolution TEM (HRTEM) image demonstrates a single crystalline structure revealing clearly resolved Si (101) lattice fringes. (d) The fast Fourier transform (FFT) pattern can be indexed as the [1 1 1] zone axis, and the growth direction is along the [101] orientation.
Fig. 2 Experimental setup for in situ TEM resonance observation. (a) A photograph of the JEOL-3100F TEM operated at 300 kV. (b) An arbi- trary function generator (AFG3152C) provides a sinusoidal signal v(t) 1⁄4 Vp sin(2pfdt), where Vp is the amplitude of the peak voltage and fd is the driving frequency. A piezo-controlled tungsten (W) probe is located on the right side. On the left side, individual Si NWs are attached to a flattened palladium (Pd) edge. (c) A photograph of the STM-TEM holder with a fixed Pd electrode and a piezo-controlled W probe as marked with red circles. (d) An example of a Si NW oscillating at the 3rd order.
Fig 3 Normal and parametric resonances of a Si NW observed by in situ TEM. (a) Normal mode (n 1⁄4 2) resonant motions from the 1st order to the 5th order at $2.2 MHz, $14.9 MHz, $41.8 MHz, $82.5 MHz and $137.5 MHz. Node positions are marked by red solid circles. (b) Parametric resonance (n 1⁄4 4) from the 1st order to the 5th order at $1.1 MHz, $7.2 MHz, $20.4 MHz, $41.0 MHz and $68.6 MHz. (c) Simulated resonant shapes from the 1st order to the 5th order. (d) Plot of resonant frequencies of normal and parametric resonances (n 1⁄4 2 and 4) from the 1st order to the 5th order.
Fig 4 Input energy and measured vibration amplitude at different resonant mode orders. (a) Input energy for five Si NW samples. Higher input energy and more strict resonant conditions are required for higher mode orders. (b) The measured vibration amplitudes decrease with the mode order, indicating higher energy dissipation and more strict resonant conditions for higher orders.
Fig. 5 Elastic moduli predicted from the core–shell model and experimentally measured results. Circles are calculated by considering the normal mode (n 1⁄4 2), and crosses are derived using the parametric mode (n 1⁄4 4). The inset presents the full range modelling from pure Sih110i to pure SiO2 of the core–shell NW. Blue dashed and green dotted lines represent the moduli of bulk Sih110i and SiO2, respectively.
Fig. 6 Comparison of the resonant frequency and the mode order of Si resonators. The square and circle marks represent the results from the bottom-up and top-down approaches, respectively. Si NW reso- nators in the current work (red stars) demonstrate the high-order and high frequency working regime.
A Generalized Framework for Controlling FDR in Gene Regulatory Network Inference
Authors: Daniel Morgan, Andreas Tjärnberg, Torbjörn E. M. Nordling, and Erik L.L. Sonnhammer
Bioinformatics, 35(6):1026–1032, mar 2019. (IF: 5.481, Math. & Comp. Biol. Rank: 3/59)
Motivation: Inference of gene regulatory networks (GRNs) from perturbation data can give detailed mechanistic insights of a biological system. Many inference methods exist, but the resulting GRN is generally sensitive to the choice of method-specific parameters. Even though the inferred GRN is optimal given the parameters, many links may be wrong or missing if the data is not informative. To make GRN inference reliable, a method is needed to estimate the support of each predicted link as the method parameters are varied.
Results: To achieve this we have developed a method called nested bootstrapping, which applies a bootstrapping protocol to GRN inference, and by repeated bootstrap runs assesses the stability of the estimated support values. To translate bootstrap support values to false discovery rates we run the same pipeline with shuffled data as input. This provides a general method to control the false discovery rate of GRN inference that can be applied to any setting of inference parameters, noise level, or data properties. We evaluated nested bootstrapping on a simulated dataset spanning a range of such properties, using the LASSO, Least Squares, and RNI inference methods. An improved inference accuracy was observed in almost all situations. Nested bootstrapping was incorporated into the GeneSPIDER package, which was also used for generating the simulated networks and data, as well as running and analyzing the inferences.
Fig. 2. Bootstrap support by overlap and frequency. Illustration for user- defined FDR cutoff (here 5%) for link inclusion. The blue line depicts link fre- quency as a function of bootstrap support when using measured data, and the red line when using shuffled data. The black vertical bar defines a boot- strap cutoff above which the measured data links are in the blue area and the shuffled data links are in the red area. In this illustration we set the FDR level for inferred links by finding the cutoff that makes the red area 5% of the total area under the measured data. The overlap is the intersection of links in the bootstrap runs divided by their union. This indicates what level of overlap is expected by chance, and what level is observed in the measured data (Color version of this figure is available at Bioinformatics online.)
Fig. 1. FDR estimation via NestBoot algorithm for a given sparsity. Data is sampled at each bootstrap iteration and a bootstrap network is inferred. After Q iterations, bootstrap support for each link is saved as the frequency at which it was inferred, keeping direction and sign of the link as separate events. This process is repeated for R runs, which are later used to evaluate stability. The distribution of bootstrap support for all runs is compared with the distribution for shuffled expression data, and this is used to locate the bootstrap support cutoff at the desired FDR level. Links are then extracted which are present in each run above this cutoff
Fig. 3: GRNaccuracies under native and NestBoot-enhanced inference on 10-gene synthetic data. The distribution of scores across all datasets is presented in grey where native inference configuration is used and in blue where NestBoot-enhanced inference is enabled for methods LASSO, LSCO and RNICO. The accuracy was measured as median MCC across a range of sparsities for each of the 200 datasets of 10 genes.
Fig. 4: GRNaccuracies under native and NestBoot-enhanced inference on 45-gene synthetic data. The distribution of scores across all datasets is presented in grey where native inference configuration is used and in blue where NestBoot-enhanced inference is enabled for methods LASSO, LSCO, and RNICO. The accuracy was measured as median MCC across a range of sparsities for each of the 200 datasets of 45 genes.
Fig. 5: Experimental NestBoot performance at 5% FDR cutoff Comparison of native methods to those enhanced with NestBoot on three biological datasets. The measured SNR levels of the three datasets are shown below.
Fig. 6: Comparison of inference methods utilizing bootstrapping on 10-gene networks. Methods enhanced with NestBoot for LASSO, LSCO and RNICO, and native bootstrap usages for Genie3 are compared.
Modelling of the GAL1 Genetic Circuit in Yeast Using Three Equations.
Authors: Chi-Ching Hsu, Yu-Heng Wu, Filippo Menolascina, and Torbjörn E M Nordling.
In 10th IFAC Symposium on Advanced Control of Chemical Processes (ADCHEM2018), Shenyang, China, july 2018. International Federation of Automatic Control (IFAC)
Synthetic gene circuits can be used to modify and control existing biological processes and thus e.g. increase drug yields. Currently their use is hampered by the, largely, trial and error approach used to design them. Lack of reliable quantitative dynamical models of genetic circuits e.g. prevents the use of well established control design methods. We aim toward creation of a pipeline for automated closed-loop identification of dynamic models of synthetically engineered genetic circuits in microorganisms. As a step towards this aim, we here study modelling of the input-output behaviour of the yGIL337 strain of S. cerevisiae. In this strain expression of the fluorescent reporter can be turned on by growing the yeast in galactose and off by glucose. We perform parameter estimation on a system of three ordinary differential equations of Michaelis-Menten type based on in vivo data from a microfluidic experiment by Fiore et al. (2013) after redoing the data preprocessing. The parameter estimation is done using AMIGO2–a state of the art Matlab toolbox for iterative identification of dynamical models. We show that the goodness-of-fit of our model is comparable to the five models proposed by Fiore et al. and we hypothesise that the system is an adaptive feedback system.
Fig. 1. GAL1 promoter construct: GAL1 and GFP, the code of Gal1 and Gfp, are integrated downstream of the GAL1 promoter (Fiore et al., 2013)
.
Fig. 2. Data and predictions: The input (red x), output (green x), and smoothed standard deviation of the fluorescence of the cell population (green lines). The predicted output of all the six models in Scenario B
stays within one standard deviation of the output except at the final two time points. In practice all these models can explain the data.
Towards Universal Systems Awareness
Authors: Paola Di Maio
In 9th IEEE International Conference on Awareness Science and Technology (iCAST 2018). Fukuoka, Japan, sept. 2018. IEEE.
Sensing and cognitive engineering are delivering increasing numbers of technical capabilities. This paper presents a definition of `system awareness' and provides an overview of system development and engineering practices based on the principles of Eightfold Noble Path.
Fig 2 Mindful Technology
FFANEprot: Predicting Protein Functions using a Weight-sharing Multitask Neural Network Optimized by a Firefly Algorithm with Natural Enemy Strategy
Authors: Yi-Fan Liou, Po-Jung Tsai, Zi-Yu Huang, Po-Chin Chiou, Hsiao-Wei Chu, Li-Ping Ciou and Torbjörn E. M. Nordling
In 17th International Conference on Bioinformatics (INCoB-2018), New Delhi, India, sep 2018. Asia Pacific Bioinformatics Network (APBioNet).
Prediction of multiple functions of several proteins at once from the protein sequence alone is essential but difficult. To solve this problem, we composed a dataset of 81,267 proteins and 1,169 GO terms of molecular function from Swiss-Prot and used weight-sharing and multi-task learning to create FFANEprot. The architecture of the convolutional neural network (CNN) of FFANEprot was optimised by a Firefly algorithm with natural enemy strategy, which can reduce the probability of being trapped in local optima during the evolutionary process. The training and test accuracies are 98.84% and 98.67%, which is better than all the conventional CNN architectures investigated. When analysing the networks trained by FFANEnet, we found many inhibitory neurons which typically have a small kernel size and occupy approximately 30% of the CNNs. The FFANEnet source code is available at http://ffanenet.nordlinglab.org .
Keywords: Deep learning; Convolutional neural network; Evolutionary algorithm; Firefly algorithm; Natural enemy strategy; Inhibitory neurons
Fig. 2. Data. The Swiss-Prot data was directly downloaded from the UniProt database. Redundant sequences and sequences having a length of less than 30 residues were removed. Finally, the PF81729 dataset was created, and then split into a training set, named PF81729_tr, and a test set, named PF81729_ts.
Fig. 3. Encoding of the particles (fireflies). Each particle is represented as a vector containing 1,920 elements for the convolutional layers followed by 15 elements for the fully connected layers.
Fig. 4. CNN architecture and decoding of the particles in FFANEnet. In the convolutional layer, each kernel is paired with a specific instance of the scaled exponential linear unit (SELU) activation function. All nodes in a fully connected layer uses the same SELU activation function. The number of nodes and parameters of the activation functions are decided by FFANE.
Case Study: Taiwan’s pathway into a circular future for buildings
Authors: Bart J A van Bueren, Mark A A M Leenders, and Torbjörn E M Nordling. In IOP Conference Series: Earth and Environmental Science, volume 225, page 012060, Brussels, Belgium, feb 2019. IOP Publishing.
The aim of this paper is to explore successful paths and potential obstacles for introducing circular buildings to a region new to the strategy of Circular Economy (CE). For this, the process of circular buildings development in Taiwan is analysed. In 2016, the government of Taiwan passed an act that put a focus on CE. Taiwan entered this field with nearly no prior experience. This paper analyses three cases: The Holland Pavilion for the World Flora Expo Taichung; the TaiSugar Circular Village Tainan; and the CE Social Housing Taipei. Interestingly, Taiwan choose the Netherlands as a country for guidance on best practices and the path to implementation. Our analysis focuses on barriers and opportunities found in the initiation, commissioning, and the ongoing development process of these projects. Data is collected through interviews with 30 stakeholders, from government, industries and academia who are involved in the projects. International collaboration is shown to have speeded up the CE building innovation process in Taiwan.
Perturbation-based gene regulatory network inference to unravel oncogenic
Authors:Morgan, D., Studham, M., Tjärnberg, A., Weishaupt, H., Swartling, F. J., Nordling, T. E. M. and Sonnhammer, E. L. L. (2019).
Submitted to Scientific Reports, Oct 2019.
The gene regulatory network (GRN) of human cells encodes mechanisms to ensure proper functioning. However, if this GRN is dysregulated, the cell may enter into a disease state such as cancer. Understanding the GRN as a system can therefore help identify novel mechanisms underlying disease, which can lead to new therapies. Reliable inference of GRNs is however still a major challenge in systems biology.
To deduce regulatory interactions relevant to cancer, we applied a recent computational inference framework to data from perturbation experiments in squamous carcinoma cell line A431. GRNs were inferred using several methods, and the false discovery rate was controlled by the NestBoot framework. We developed a novel approach to assess the predictiveness of inferred GRNs against validation data, despite the lack of a gold standard. The best GRN was significantly more predictive than the null model, both in crossvalidated benchmarks and for an independent dataset of the same genes under a different perturbation design. It agrees with many known links, in addition to predicting a large number of novel interactions from which a subset was experimentally validated. The inferred GRN captures regulatory interactions central to cancer-relevant processes and thus provides mechanistic insights that are useful for future cancer research.
Data available at GSE125958.
Inferred GRNs and inference statistics available at https://dcolin.shinyapps.io/CancerGRN/
Fig. 2. Validation of inferred GRNs’ topologies. Each x-axis tick mark shows the prediction performance in terms of the wRSS error of each inferred GRN topology (circles) fit to training data under crossvalidation, compared to its shuffled topologies. The box displays the median and interquartile range, and whiskers bound points maximally extending 1.5 times this range. Beyond this, outlier points are shown.
Fig. 1. Workflow of project. siRNA perturbation experiments were carried out systematically per gene, resulting in a change in mRNA level which elicits a regulatory response over time before reaching steady state when gene expression was measured.
GRN inference: Nested bootstrapping was applied to three inference methods, producing GRNs with an FDR set to 5%.
GRN Selection: Estimate goodness of fit under crossvalidation and error balancing, and compare to shuffled topologies (Algorithm 1).
Independent Validation: Each inferred GRNs’ ability to predict an independent dataset was evaluated in comparison to a distribution of shuffled topologies. Finally, the overall most predictive GRN was selected. Two novel links were experimentally validated.
Fig. 3. Validation of the inferred GRNs’ fit to the measured data. Each x-axis tick mark shows the prediction
performance in terms of the wRSS of an inferred GRN topology fit to training data under crossvalidation, compared to its ability to fit shuffled data. X marks represent the inferred GRNs. The filled color box displays the median and interquartile range, and whiskers bound points maximally extending 1.5 times this range. Beyond this, outlier points are shown.
Fig. 4. The overall best performing GRN. Each of the 125 links has at least 97.5% bootstrap support, and the sparsity is 3.2 links/gene among its 39 genes. The 39 self links are not shown. The genes involved in the external validation experiment, BDR4, CCNB1, and MYC, are highlighted pink. Blue links reflect up regulation while red reflect negative down regulation. The visualization was made by the provided shiny app.
No Feature Selection Algorithm Rules Supreme, but Some Yield Better Classifiers
Authors: Kniberg, A., Nokto, D. and Nordling, T. E. M. Manuscript in preparation, Oct 2019.
Feature selection is the process of selecting a subset of features based on data. There are many feature selection algorithms available and the appropriate choice can be difficult. The aim of this paper was to benchmark algorithms in order to provide guidance for this choice. First, we assessed which algorithms are most commonly used in the scientific community by performing a literature study in two large reference databases: Scopus and Web of Science. Second, we constructed a benchmark pipeline to compare the performance of 31 algorithms on 50 datasets. The feature subset was reduced to 50 \% of the original size in all cases. Exploration of dataset characteristics and their effects on the experiment was beyond the scope of this study. The algorithm performance was measured based on classification and computational time. No algorithm was superior in every case. The overall best-performing algorithm was Decision Tree as an embedded feature selection method. Lasso also showed good predictive performance and speed. Embedded versions of Random Forest and AdaBoost yielded the best average predictive performance, but were significantly slower.
ProtFunAI—Artificial intelligence as a service for prediction of protein function
Authors: Lin, C.-M., Tsai, P.-J., Ashyani, A. and Nordling, T. E. M. Manuscript in preparation, Oct 2019.
Knowledge about the function of a protein is essential for understanding its role in both normal healthy and pathological conditions. Various computational methods have been applied to the challenging problem of predicting protein functions from protein sequence alone and a handful of these are currently available as web services.
Recently, we created FFANEprot—a deep convolutional neural network trained on a dataset of 81,267 proteins and 1,169 Gene Ontology (GO) terms of molecular function (MF) from the Swiss-Prot database. This AI model for prediction of protein function from sequence alone achieved training and test Matthews correlation coefficients (accuracies) of 0.52 (98.84%) and 0.49 (98.67%), respectively.
Here we present the ProtFunAI web service (protfunai.nordlinglab.org) consisting of a database of MF predictions of 20,405 reviewed human proteins and a prediction service that can predict the MF of any supplied protein sequence within roughly a minute. All predictions are made by FFANEprot. Our database interface also shows the MF of each protein from Uniprot (www.uniprot.org) with convenient linkage to look up additional information through a single click.
ProtFunAI provide convenient lookup of high accuracy prediction of GO MF terms from sequence alone.
Fig.2. The Graphical user interface of ProtFunAI. ProtFunAI provides a searchable database of 20,405 human proteins. Both GO MF terms predicted by FFANEprot and listed in UniProt are shown. The table shows the protein name, gene name, organism, protein sequence, and gene ontology. The icon in the red box enable: (A) prediction of the functions of any protein sequence by FFANEprot, (B) sharing of the result, (C) viewing of the Nordling Lab website, (D) switching of the predictor version, and (E) searching of the database with suggestions. Explanation of the colour coding of GO terms (F).
Generative adversarial learning for enhanced attention transfer during model compression of convolutional neural networks
Authors: Tsai, P.-J., Ashyani, A. and Nordling, T. E. M. Manuscript in preparation, Oct 2019.
The computational cost of deep neural networks has created an interest in model compression to find small and good approximations that works on mobile and edge devices. The teacher-student strategy, where a deep network (teacher) is used to train a small network (student), has shown promise. To improve the student network, methods for transferring information from the output and hidden layers have been investigated and are now known as knowledge distillation and attention transfer.
We aim to improve the student network's performance by optimizing the comparison of the attention maps through adversarial learning. Generative adversarial networks (GANs) have been used successfully for transfer of image style, among other things.
We use adversarial learning to obtain a discriminator network to evaluate the quality of the attention maps. Simultaneously, the student network is trained to generate attention maps that are indistinguishable by the discriminator from the teacher’s maps, and thus achieve attention transfer by mimicking the attention of the teacher. We call this method mimicking generative adversarial network for attention transfer (MiGAN-AT).
We evaluate our method on the CIFAR10 dataset by comparing it to previously published methods for attention transfer and knowledge distillation. We found that MiGAN-AT outperforms the other methods when applied to weak student networks and perform similarly on strong student networks. Our results show that good performance can be maintained while compressing models using the teacher-student strategy by using a discriminator network to compare the attention maps of the student and teacher. We found that MiGAN-AT outperforms the other methods when applied to weak student networks and perform similarly on strong student networks.
Good performance can be maintained while compressing models using the teacher-student strategy by using a discriminator network to compare the attention maps of the student and teacher.
The source code is available at http://migan.nordlinglab.org.
Analysis of data preprocessing and systematic errors for hit selection in protein microarrays
Authors:Wu, Y.-H., Ashyani, A., Chen, C.-S. and Nordling, T. E. M. Manuscript in preparation, Oct 2019.
Protein microarrays allow rapid testing of molecular binding of thousands of proteins on a single chip. However, in practice, the microarray chip contains artefacts due to inevitable experiment errors making hit selection challenging.
We aim to develop an automatic pipeline for hit selection optimized for protein microarrays, including data preprocessing. Here, we focus on image preprocessing to detect, quantify, and exclude artefacts of protein microarrays as a first step.
In order to remove systematic errors, we implement center finding, spot segmentation, background surface fitting, smear surface fitting, and robust regression to separate signal from artefacts. We use the strictly standardized mean difference (SSMD) for hit selection. We optimize the identification of protein spots, background intensities, and smear intensities in the protein microarray image compared to standard methods implemented in existing analysis software. This enable us to in a dilution series with known concentration detect even the weakest hit, contrary to standard methods.
Our automated hit selection pipeline can extract spot intensities in a robust and reliable way. By reducing the uncertainty of spot intensities our algorithm leads to higher accuracy of hit selection.
A Python package for all aspects of network inference
Authors: Lin, C.-M., Tjärnberg, A., Ashyani, A. and Nordling, T. E. M. Manuscript in preparation, Oct 2019.
Network inference (NI) is used to identify relationships between variables based on observations of changes following perturbations of the system. Many fundamentally different NI methods have been developed and applied for inference of gene regulatory networks. It remains unclear when to use which method and what result to expect. To address this problem, Tjärnberg and colleagues (2017) created the Matlab package GeneSPIDER for tuning, running, and evaluating inference algorithms on observed and synthetic data. GeneSPIDER also contains methods for generating synthetic networks and data with desired properties that enable benchmarking of inference algorithms. We aim to make methods related to network inference available to a broader group of researchers by developing a Python package, called JATNIpy.
JATNIpy, like GeneSPIDER, assumes that the system can be described as a linear mapping by the network from perturbations to responses, resulting in an errors-in-variables problem. Here, we present the reimplemented core functionality of GeneSPIDER and a demonstration reproducing the result of examples previously used to demonstrate GeneSPIDER. The algorithms are implemented using common Python formalism for familiarity of Scikit-learn users. However, currently only four NI algorithms are implemented in JATNIpy.
JATNIpy enables convenient benchmarking of NI methods for Python users, which we believe will help bring clarity to the question of which method to use for a particular system.
The source code is available at jatnipy.nordlinglab.org and the package has been added to PyPI.
3. Publication list
We here list the already published journal and conference articles with links to make it convenient for interested readers to learn more in them.
Journal publications
1. Umberto Celano, Feng-Chun Hsia, Danielle Vanhaeren, Kristof Paredis, Torbjörn E. M. Nordling, Josephus G. Buijnsters, Thomas Hantschel, and Wilfried Vandervorst. Mesoscopic physical removal of material using sliding nano-diamond contacts. Scientific Reports, 8(1):2994, feb 2018. doi:10.1093/bioinformatics/bty764 URL:
https://academic.oup.com/bioinformatics/article/35/6/1026/5086392 (IF: 4.259, Multidisciplinary Sci. Rank: 10/64)
2. Wei-Sheng Wu, Yu-Xuan Jiang, Jer-Wei Chang, Yu-Han Chu, Hao Chiu, Yi-Hong Tsao, Torbjörn E M Nordling, Yan-Yuan Tseng, and Joseph T Tseng. HRPDviewer: human ribosome profiling data viewer. Database, jul 2018. doi:10.1093/database/bay074 URL:
https://academic.oup.com/database/article/doi/10.1093/database/bay074/5052387 (IF: 3.978, Math. & Comp. Biol. Rank: 4/59)
3. Slim Fourati, Aarthi Talla, Mehrad Mahmoudian, Joshua G Burkhart, Riku Klen, Ricardo Henao, Zafer Aydin, Ka Yee Yeung, Mehmet Eren Ahsen, Reem Almugbel, Samad Jahandideh, Xiao Liang, Torbjörn E.M. Nordling, et al. A crowdsourced analysis to identify ab initio molecular signatures predictive of susceptibility to viral infection. Nature Communications, 9(1):4418, oct 2018. doi:10.1038/s41467-018-06735-8 URL:https://www.nature.com/articles/s41467-018-06735-8#citeas (IF: 12.353, Multidisciplinary Sci. Rank: 3/64)
4. Wei-Sheng Wu, Hao-Ping Tu, Yu-Han Chu, Torbjörn E M Nordling, Yan-Yuan Tseng, and Hung-Jiun Liaw. YHMI: a web tool to identify histone modifications and histone/chromatin regulators from a gene list in yeast. Database, oct 2018. doi: 10.1093/database/bay116 URL:
https://academic.oup.com/database/article/doi/10.1093/database/bay116/5145122
(IF: 3.978, Math. & Comp. Biol. Rank: 4/59)
5. Feng-Chun Hsia, Dai-Ming Tang, Wipakorn Jevasuwan, Naoki Fukata, Xin Zhou, Masanori Mitome, Yoshio Bando, Torbjörn E. M. Nordling, and Dmitri Golberg. Realization and direct observation of five normal and parametric modes in silicon nanowire resonators by in situ transmission electron microscopy. Nanoscale Advances, feb 2019. doi:10.1039/c8na00373d URL:
https://pubs.rsc.org/en/content/articlehtml/2019/na/c8na00373d
6. Daniel Morgan, Andreas Tjärnberg, Torbjörn E M Nordling, and Erik L L Sonnhammer. A generalized framework for controlling FDR in gene regulatory network inference. Bioinformatics, 35(6):1026–1032, mar 2019.
https://academic.oup.com/bioinformatics/article/35/6/1026/5086392 (IF: 5.481, Math. & Comp. Biol. Rank: 3/59)
7. Morgan, D., Studham, M., Tjärnberg, A., Weishaupt, H., Swartling, F. J., Nordling, T. E. M. and Sonnhammer, E. L. L. (2019) Perturbation-based gene regulatory network inference to unravel oncogenic mechanisms. Submitted to Scientific Reports, Oct 2019.doi:10.1101/735514 URL:
https://www.biorxiv.org/content/10.1101/735514v2
Conference publications
1. Chi-Ching Hsu, Yu-Heng Wu, Filippo Menolascina, and Torbjörn E M Nordling. Modelling of the GAL1 Genetic Circuit in Yeast Using Three Equations. In 10th IFAC Symposium on Advanced Control of Chemical Processes (ADCHEM2018), Shenyang, China, jul 2018. International Federation of Automatic Control (IFAC) 2. Paola Di Maio. Towards Universal Systems Awareness. In 9th IEEE International
Conference on Awareness Science and Technology (iCAST 2018). Fukuoka, Japan, sept. 2018. IEEE.
3. Yi-Fan Liou, Po-Jung Tsai, Zi-Yu Huang, Po-Chin Chiou, Hsiao-Wei Chu, Li-Ping Ciou, and Torbjörn E M Nordling. FFANEprot: Predicting Protein Functions using a Weight- sharing Multitask Neural Network Optimized by a Firefly Algorithm with Natural Enemy Strategy. In 17th International Conference on Bioinformatics (INCoB-2018), New Delhi, India, sep 2018. Asia Pacific Bioinformatics Network (APBioNet).
4. Bart J A van Bueren, Mark A A M Leenders, and Torbjörn E M Nordling. Case Study: Taiwan’s pathway into a circular future for buildings. In IOP Conference Series: Earth and Environmental Science, volume 225, page 012060, Brussels, Belgium, feb 2019. IOP Publishing.
Data, Databases, Toys, Tools, Software, and Services
Databases
1. HRPDviewer (Human Ribosome Profiling Data viewer)—contains 610 published human ribo-seq datasets from Gene Expression Omnibus aligned to the transcriptome and provides visualisation selected mRNA transcripts (http://cosbi4.ee.ncku.edu.tw/HRPDviewer/) by Prof. Wei-Sheng Wu’s lab.
2. ProtFunAI (Protein Function AI)—a database of GO molecular function predictions and a service for automatic prediction of protein function based on protein sequence
(http://protfunai.nordlinglab.org/).
3. FFANEprot—a convolutional neural network for prediction of multiple GO molecular functions of multiple proteins based on their sequence trained on a dataset of 81,267 proteins and 1,169 GO terms from Swiss-Prot.
4. YHMI—a web tool to identify modifications and histone/chromatin regulators from a gene list in yeast (http:// cosbi6.ee.ncku.edu.tw/YHMI/) by Prof. Wei-Sheng Wu’s lab.
Software
5. FFANEnet—a Firefly algorithm with natural enemy strategy for optimisation of the architecture of convolutional neural networks (http://ffanenet.nordlinglab.org).
6. NestBoot—Nested bootstrapping for inference of gene regulatory networks, an addition to the GeneSPIDER package
(https://bitbucket.org/sonnhammergrni/genespider/src/NB/%2BMethods/NestBoot.m) by Prof. Erik Sonnhammer’s lab.
7. JATNIpy—a Python package for all things related to network inference (http://jatnipy.nordlinglab.org).