Chapter 2 Background
2.1 Visualization 1
An area of computer science that is often confused with visualization is that of visual programming. These are two distinct areas. The use of a visual programming language/tool is to aid the programmer in the creation of user interfaces (and in some situations, software). Essentially the visual objects are symbols that represent some item of code that would otherwise have had to be written by hand. Visualization in the other hand is something that uses existing (possibly complex) data sets and tries to make them more understandable.
It could be said that visual programming is just one small area of visualization.
The use of graphics and imagery is as an aid to the programmer albeit in creation
rather than understanding the system. But what is being made more accessible
through the images is the programming language. Despite this link visual
programming and program visualization is not the same thing and the terms are not
interchangeable.
used in other disciplines. Because part of computer science research is concerned with how to implement visual systems and how to create the hardware to make virtual reality useful, it does not prevent the field from using its own tools.
2.1.1 What is Visualization 2
Visualization has been defined in several ways. One definition is:
“Visualization is the use of computer-generated media based on data in the
service of human insight/learning.”
comp.viz.faq – comp.visualization newsgroup FAQ
There are grounds for dispute in this definition. Human beings are visualizing things all the time in thought and action. The term visualization should not be restricted to those images or displays that a computer can present.
Another definition from the same source follows the same line of thought but it is included because of the other part of the definition.
“Visualization: the use of computer imagery to gain insight into complex
phenomena”
The last part of this definition is something that is very true. Many hold the view that one of the great uses of visualization is to provide help for humans when dealing
2
Content of this section extracted from 錯誤! 找不到參照來源。
with complex ideas and concepts.
A better definition from the FAQ file is:
“The purpose of visualization is insight, not virtual realities or pictures.”
Eugene N. Miya, President, Bay Area ACM/SIGGRAPH
But this does not go far enough. Friedhoff and Benzon [6], write:
“… Is that much is to be gained by recognizing that visualization, because of the
computer, is emerging as a distinctive new discipline.”
This brings in again the reliance on computers but it does not rule out other forms of visualization. The point is that the technological advances have brought visualization to the forefront. Having done this and providing such a rich vein of opportunity for exploring visualization, computers do not have to be the only form of visualization. In a later paragraph the authors write:
“If this new discipline of visualization is to realize its full potential, however, it
will also have to borrow from those areas traditionally concerned with imagery such
as art history and perceptual and cognitive psychology. The field of visualization
should not be so absorbed by the miracles that are its technical basis that it ignores a
larger interest in the way in which images can be used to enhance the power of our
One such definition could be:
“Visualization is a discipline that makes use of various forms of imagery to
provide insight and understanding and to reduce complexity of the phenomena under
consideration.”
This is a general definition that covers all aspects of visualization as a discipline rather than concentrating on any specific area. In situations where more clarification is needed then qualifying statements can be added to the definition.
2.1.2 Software Visualization
Information visualization appeared in the 90’s with the objective of visualizing any kind of data in order to find patterns in a short time. Before that, visualization in computer science had a long history starting with the development of “Flow Charts”
in the 60’s with the work of Donald Knuth. In the 70’s, “Pretty-Printing” was another major step followed by “Algorithm Animation” in the 80’s. The 90’s symbolize the revolution area with the introduction of CASE (Computer-aided software engineering) tools (e.g., Visual Studio, Rational Rose). In the last several years, the focus is on
“Dynamic Data and Software Processes”.[7]
With the huge progress in computer graphics over the last decade, lots of
visualization tools have been introduced in the computer world. In nowadays,
high-level GPU (Graphic Processing Unit) has become as complicated as CPU. The
price of 3D graphics video card has dramatically reduced. This hardware progress has made PC more powerful than graphic workstations several years ago. This trend of computer graphics combined with the pressing needs in software comprehension and maintenance led to the birth of software visualization as an independent field.[7]
Since software is an abstract element without spatial representation like a car or a computer, it’s somehow difficult to project software into some forms our mind can easily understood. That is why software visualization is often referred to as the process of “making the invisible visible”.[9]
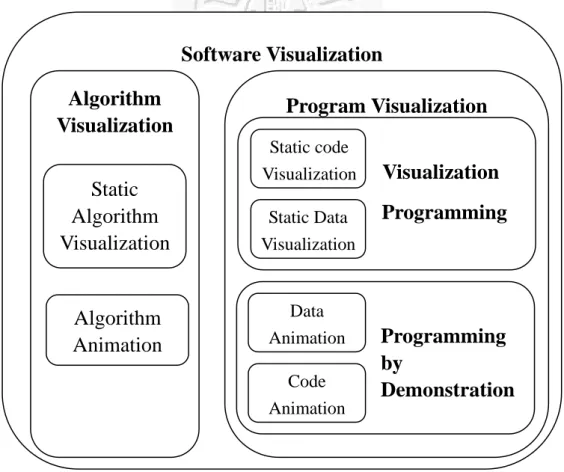
In recent years, software visualization has two broad categories: algorithm visualization and program visualization. Algorithm visualization emphasizes the visualization of high-level abstractions that describes the behavior of the software.
Flow charts and UML diagrams can be thought of typical examples of the static
algorithm visualization. The most interesting part of algorithm visualization is to
show how the algorithm operates. Program visualization, on the other hand, often
focuses on low-level program code. Figure 2-1 is the classification of software
visualization introduced by J. Stasko et al. [8] and shows the related fields of software
visualization.
Software Visualization Algorithm
Visualization
Program Visualization Visualization Programming
Static code Visualization Static
Algorithm Visualization
Static Data Visualization
Figure 2-1 The domain of software visualization.
Within the classification, VP (Visual Programming) and PbD (Programming by Demonstration/examples) in program visualization have different objectives in contrast to that of software visualization. The goal of VP and PbD is making the programmer to develop the software more easily and efficiently with visualization techniques, whereas software visualization makes an algorithm or a program be understood more clearly.
The main challenges of software visualization listed by Young [12] are:
z Metaphor (representation): how to represent entities of software.
z Abstraction: what to present and in how much detail.
z Navigation: how to move through the sets of visual objects that represent
Programming by
Demonstration Data
Animation Algorithm
Animation
Code
Animation
the system.
z Correlation: how to link visual abstractions to source code and
documentation.
As Koike [13] pointed out, “information has no shape and color.” This disadvantage makes people hard to comprehend information. So, people use suitable virtual shapes to resolve this difficulty. By using the most popular and simple 2D visualization techniques, programmers can trace source code in a tool environment, where it is pretty-printed with indented lines, colored key words, and etc. But when programs become larger and more complex, the assistance from these visualization techniques is no longer sufficient [9].
In order to overcome this problem, some approaches have been developed and
applied to analyze software artifacts and visualization tools are then used to display
the relationship between visual objects. These approaches [9] include impact analysis,
program slicing, dependency analysis, and etc. Visualization techniques combined
with these approaches have been adopted by algorithm animations, debuggers, and
testing tools.
2.1.3 Why 3D (3D versus 2D) 3
3D visualization employs a lot of advanced techniques and conforms to human cognitive and perceptual nature. 3D world is chosen one of the best forms of information visualization because of the reasons and benefits summarized as follows
compared to 2D visualization:
z 3D has one extra dimension that can be used to encode some knowledge.
3D graphics have more flexibility to represent and organize the information.
z In 3D environment, you have much greater working volume than in 2D
views. Hence it can handle much larger systems.
z Compared to 2D navigation (on the ground), 3D environments usually
provide Useful and effective navigation (in the air). It is much like the human’s real world experience. Human experience in interacting and
exploring within 3D environments is exploited.
z 2D systems usually work in read-only mode. 3D environments provide
useful interactions for users.[10]
z 2D representation is usually static while 3D provides not only static
information but also dynamic information.
3
Content of this section extracted from 錯誤! 找不到參照來源。
z Overview and context. Being able to display a large amount of information
in one view and thus provide an overview.
2.2 Rendering Engine
"Rendering Engine" generically applies to the part of the graphics engine that draws 3D primitives, usually triangles or other simple polygons. In most implementations, the rendering engine is responsible for interpolation of edges and
"filling in" the triangle.[17]
2.2.1 Game Engine
A game engine is the core software component of a computer or video game or other interactive application with real-time graphics. It provides the underlying technologies, simplifies development, and often enables the game to run on multiple platforms such as game consoles and Microsoft Windows. The core functionality typically provided by a game engine includes a rendering engine (“render”) for 2D or 3D graphics, a physics engine or collision detection, sound, scripting, animation, artificial intelligence, networking, and a scene graph.[16]
Some game engines only provide real-time 3D rendering capabilities instead of
middleware components. This type of engine is generally referred to as a "graphics engine," "rendering engine," or "3D engine" instead of the more encompassing term
"game engine." However, this terminology is inconsistently used as many full-featured 3D game engines are referred to simply as "3D engines." A few examples of graphics engines are: Axiom, Ogre, Power Render, Crystal Space, and Genesis3D. Modern game or graphics engines generally provide a scene graph, which is an object-oriented representation of the 3D game world which often simplifies game design and can be used for more efficient rendering of vast virtual worlds. [16]
2.2.2 OGRE – Object-oriented Graphics Rendering Engine
OGRE (Object-Oriented Graphics Rendering Engine) is a scene-oriented, flexible 3D engine written in C++ designed to make it easier and more intuitive for developers to produce applications utilizing hardware-accelerated 3D graphics. The class library abstracts all the details of using the underlying system libraries like Direct3D and OpenGL and provides an interface based on world objects and other intuitive classes.[14]
With the following features, we choose OGRE as our 3D rendering system:
z Simple and easy to use object-oriented interface designed to minimize the
effort required to render 3D scenes
z Some common requirements like render state management, hierarchical
culling, and dealing with transparency are done automatically to save the
development time.
z Support cross-platform input and both Direct3D and OpenGL APIs.
z Support skeletal animation, progressive meshes (Level of detail, LOD),
particle systems, bill-boarding, and transparent objects.
z Available under the GNU Lesser General Public License (LGPL), thorough
tutorials, API documents, and complete discussion forum.
For more features designed in OGRE, refer to the introduction about OGRE.[14]
Although OGRE is nothing but a rendering engine which is deliberately designed to provide a general graphics solution, it has been used in some commercial games as described in [15] with its high flexibility to be incorporated into other libraries, such as sound, networking, collision, physics, and etc. With these features given above, we believe that OGRE is an adequate engine for our visualization.
2.3 Scene Graph 4
A scene-graph is a general data structure commonly used by vector-based
graphics editing applications and modern computer games. Examples of such
The scene-graph is an object-oriented structure that arranges the logical and often (but not necessarily) spatial representation of a graphical scene. The definition of a scene-graph is fuzzy, due to the fact that programmers who implement scene-graphs in applications and in particular the games industry take the basic principles and adapt these to suit a particular application. This means there is no hard and fast rule what a scene-graph should be or shouldn't be.
Scene-graphs are a collection of nodes in a graph or tree structure. This means that a node may have many children but often only a single parent, the effect of a parent is apparent to all its child nodes - An operation applied to a group automatically propagates its effect to all of its members. In many programs, associating a geometrical transformation matrix at each group level and concatenating such matrices together is an efficient and natural way to process such operations. A common feature, for instance, is the ability to group related shapes/objects into a compound object which can then be moved, transformed, selected, etc. as easily as a single object.
Scene graphs are ideal for modern games using 3D graphics and increasingly large worlds or levels. In such applications, nodes in a scene-graph (generally) represent entities or objects in the scene.
For instance, a game might define a logical relationship between a knight and a
horse so that the knight is considered an extension to the horse. The scene graph would have a 'horse' node with a 'knight' node attached to it.
As well as describing the logical relationship, the scene-graph may also describe the spatial relationship of the various entities: the knight moves through 3D space as the horse moves.
In these large applications, memory requirements are major considerations when designing a scene-graph. For this reason many large scene-graph systems use instancing to reduce memory costs and increase speed. In our example above, each knight is a separate scene node, but the graphical representation of the knight (made up of a 3D mesh, textures, materials and shades) is instanced. This means that only a single copy of the data is kept, which is then referenced by any 'knight' nodes in the scene-graph. This allows a reduced memory budget and increased speed, since when a new knight node is created, the appearance data does not need to be duplicated.
2.4 Manipulation of 3D Environment 5
Manipulation is one the most popular operation with objects in 3D interaction.
“The goal of manipulation interface design is the development of new interaction
user-manipulation performance and comfort while diminishing the impact from inherited human and hardware limitations [18].” In general, manipulation usually refers to handling physical objects with one or two hands. But, we narrowly define our manipulation task to spatial rigid object manipulation that preserves the shape of
objects. In [18], three canonical manipulation tasks are listed as follows:
z Selection, or target acquisition, is the task to acquiring or identifying a
particular object from the entire set of objects available. In real world,
selection task is picking an object with a hand.
z Positioning is the task of changing the 3D position of an object. In real
world, position task is moving an object from a staring location to a target
location.
z Rotation is the task of changing the orientation of an object. In real world,
rotation task is rotating an object form a staring orientation to a target orientation.
Besides the canonical tasks, there are some application-specific manipulation tasks.
The choice of devices often restricts which manipulation techniques can be used.
Two key characteristics of input devices in manipulation tasks are the number of
control dimensions (how many DOF the device can control) and the integration of
control dimensions (how many DOF can be controlled simultaneously with a single movement). For example, trackers allow simultaneously control of both 3D position and orientation. Multiple DOF devices with integrated control of all input dimensions are usually best for 3D manipulation [18].
Pointing techniques is one of the most fundamental classes of 3D manipulation
techniques. The motivation behind the technique is allow the user to select and manipulate objects easily by simply pointing at them. The pointing-based techniques include ray casting [24], two-handed pointing [22], flashlight technique, aperture technique [25], image-plane technique [26], and fishing-reel techniques [21]. Pointing is a powerful selection technique, but is generally a poor positioning technique: object manipulation can be efficiently accomplished only in radial movements around the user (perpendicular to the pointing direction), and when the task does not require changing the distance between the user and objects [18].
Another fundamental class of 3D manipulation technique is virtual hand technique (see Figure 2-2) by which the user can select and directly manipulate virtual
objects with her or his hand. These techniques include go-go techniques [19] and
simple virtual hand technique. Typically, a cursor is used to visualize the current locus
are mapped onto the position and orientation of the virtual hand. These symbols can be some feedback by which users are aware whether the interactions are finished successfully or not.
The techniques mentioned above have the common restriction about the length of user’s arm and can not efficiently select objects located outside of the users’ reach.
An alternative to extend the length of the user’s arm is Word-in-Miniature technique [20], which scales the entire world and brings it within the user’s reach [18]. Figure 2-3 shows an example of a room model’s WIM.
Figure 2-2 Virtual Hand[19] Figure 2-3 WIM technique[20]
It is difficult to design a single best 3D manipulation technique that fits all interaction scenarios. Thus, combining some manipulation techniques has been an active research direction that attempts to bring the good properties of different interaction techniques together. Two approaches can be applied to combine techniques, aggregation of techniques which provide user an explicit mechanism, i.e., 3D menu
system, for choosing the desired manipulation technique from a limited set of possible
options, and integration of techniques, in which the interface switches transparently between interaction techniques depending on the current task context. Some of these combining techniques have been developed, such as HOMER [21], scaled-world grab [22], voodoo dolls [23], and etc.
2.5 3D Navigation (Travel) 6
Navigation is movement in and around an environment – a fundamental human task in our physical environment.
Navigation often supports another task rather than being an end unto itself.
Consider most 3Dgames: travel is used to reach locations where the user can pick up treasure, fight with enemies, or obtain critical information. Surprisingly, the secondary nature of the travel task in these instances actually increases the need for usability of navigation techniques. That is, if the user has to think about how to turn left or move forward, than he has been distracted from his primary task. Therefore, travel techniques must be intuitive – capable of becoming “second nature” to user.
There are many different reasons why a user might need to perform a 3D navigation task. Below are the tasks [18] have identified:
z Exploration: the user has no explicit goal for his movement. Rather, he is
browsing the environment; obtain information about the objects and
locations within the world, and building up knowledge of the space.
z Search: involve navigate to a specific goal or target location within the
environment.
z Maneuvering: take place in a local area and involve small, precise
movements. The most common use of maneuvering is to position the viewpoint more precisely within a limited local area to perform a specific task.
2.6 Metaphor 7
A metaphor, according to I. A. Richards in The Philosophy of Rhetoric (1936), consists of two parts: the tenor and vehicle. The tenor is the subject to which attributes are ascribed. The vehicle is the subject from which the attributes are borrowed.
All the world's a stage,
And all the men and women merely players
They have their exits and their entrances;
— (William Shakespeare, As You Like It, 2/7)
This well known quote is a good example of a metaphor. In this example, "the
7
![Figure 2-2 Virtual Hand[19] Figure 2-3 WIM technique[20]](https://thumb-ap.123doks.com/thumbv2/9libinfo/7174754.49858/16.892.140.745.551.771/figure-virtual-hand-figure-wim-technique.webp)
