國立臺灣大學生命科學院生態學與演化生物學研究所 碩士論文
Institute of Ecology and Evolutionary Biology College of Life Science
National Taiwan University Master Thesis
暖化與海拔梯度下雌雄體型二型性之變化 Body size allometry for sexual size dimorphism across altitudinal gradients and over decades of climate warming
葉子賢 Tzu-Hsien Yeh
指導教授:何傳愷 博士、吳書平 博士
Advisor: Chuan-Kai Ho, Ph.D. & Shu-Ping Wu, Ph.D.
中華民國 109 年 6 月
June 2020
ii
謝誌
至完成此篇論文,我經歷了許多階段的試誤,並有賴於過程中多位師長與 同儕在研究和研究生活等方面的協助與建議。謹以此篇謝誌傳達我的感謝之情。
首先要感謝我的指導老師何傳愷博士對我研究想法的支持,除了在研究方法、報 告呈現和論文撰寫的協助之外,他的鼓勵、建議和對於研究想法的開放態度幫助 我得以在碩士班期間學習不同角度的思辨、各種試誤和經驗累積,並且可以在摸 索學習的過程中認識許多其他師長。從他們身上我也獲得很多研究上的建議和研 究經驗分享,甚至於在面對研究與職涯方面的心理層面的開導與建言。我非常感 謝共同指導老師吳書平博士在研究實務上提供了很多建議和實質上的技術支援,
並與我分享學術研究的邏輯和探究學問的哲學。我也要感謝劉力瑜博士提供統計 概念的指導和資料分析上的建議,以及在過程中鼓勵我幫助我建立信心,並且願 意擔任我的口試委員進一步給予論文修改的建議,協助我完成這份論文。另外這 項研究的尺蛾生物相資料仰賴陳一菁博士、英國倫敦自然史博物館 Dr. Jeremy D.
Holloway 的調查採集和吳忠慧學長的標本整理與量測,除了感謝他們大方提供資 料與資源之外,我很榮幸陳一菁老師願意擔任我的口試委員,由資料採集者的角 色給予我建議。我也非常感謝就學期間研究室的夥伴們,他們不僅給了我研究想 法、方法上的建議,也關照我的生活和身心狀態。這篇研究論文得以成型也要特 別感謝歐家昂同學與我多次交流對生態學研究的想法並給予我統計分析的技術協 助。我很慶幸在能夠在碩班生涯中與你們相識,並且十分珍視與你們分享生活和 相伴的時光。
摘要
種內變異是物種因應環境變化產生演化反應的先決條件,而種內變異的分 布也會受演化進程影響。雌雄體型二型性呈現種內的體型變異,由於雌雄體型差 異會影響生殖策略,雌雄體型差異的變化可能造成生殖演化上的改變。本研究根 據雌雄體型二型性形成原因的假說進行推論,探討不同平均體型之尺蛾群聚間雌 雄體型二型性的變異。解釋雌雄二型性變化的假說包括:雌雄對同一擇汰壓力有 不同反應的演化限制假說,以及強調雌雄承受不同擇汰壓力的繁殖力擇汰假說和 性擇假說。演化限制假說認為性別差異 (如累加遺傳變異度) 會影響個體在相似 擇汰壓力下的體型反應,造成體型二型性,本研究據此檢驗雌雄體型二型性之群 聚其雌雄二性的體型變異度是否反應潛在的累加遺傳變異度。繁殖力擇汰假說和 性擇假說強調特定性別承受較大的擇汰壓力,而性別間有高度但又不完全相等的 遺傳關聯性。繁殖力擇汰假說解釋雌性較大的情況,背後機制為體型較大個體有 較高的繁殖力,所以當族群主要受到雌性繁殖力擇汰時,雌性體型變異較大,而 雄性體型會因遺傳關聯產生較雌性小的反應。性擇假說可解釋雄性較大的情況,
如體型大的雄性在競爭配偶時有優勢,當族群主要受到雄性性擇壓力時,雄性體 型變異較大,而雌性體型因遺傳關聯產生較小的反應。本研究利用氣候暖化和海 拔提供的平均體型梯度來探討不同平均體型之尺蛾雌雄體型二型性的變異,分析 在 1965 年和 2007 年於馬來西亞神山 (此期間估計升溫攝氏 0.7 度) 跨海拔調查 收集來的尺蛾體型資料,並檢驗上述假說。演化限制假說預期尺蛾在暖化下體型 變小的 2007 年,面臨相同的的環境篩選 (暖化) 壓力下,雌性較大的群聚會呈現 較小的雌性體型變異度,而雄性較大的群聚雄性會有較小的體型變異度。而繁殖 力擇汰假說認為雌性較大的群聚平均體型主要會隨著雌性體型所變動,而雄性的
iv
變動會小於雌性的變動,因此預期這些群聚在平均體型較小時 (如暖化後與低海 拔族群),雌雄體型二型性的差異程度會減小。同樣的,性擇假說認為雄性較大 的群聚平均體型主要會隨著雄性體型所變動,而雌性變動會小於雄性的變動,因 此預期在平均體型較小時 (如暖化後與低海拔族群),雌雄體型二型性的差異程度 會減小。結果顯示,兩性的體型變異度並未隨暖化或海拔有顯著差異,不支持演 化限制假說。雄性較大群聚的雌雄體型二型性也未受暖化 (年份) 和海拔影響,
不支持性擇假說。但是在雌性較大的群聚中,雌雄體型二型性隨暖化而變小,支 持繁殖力擇汰假說,並且根據主成分分析結果,雌雄體型二型性的變化主要是雌 性體型變化所造成。此結果顯示這些尺蛾群聚體型結構對環境的反應主要來自於 雌性的變化,以及物種性狀的改變可能只是部分個體的反應,而其他個體因為遺 傳的關聯性連帶產生反應,這樣的結果也暗示著種內變異對演化進程的影響。
關鍵字:種內變異、雌雄體型二型性、體型異速增長、海拔、氣候暖化
Abstract
Intraspecific variation is a determinant of species evolutionary response to environmental change. As a source of intraspecific variation, sexual size dimorphism (SSD), associated with reproductive strategy, may reveal the evolutionary process in play.
In this study, I investigated the body size allometry for SSD for geometrid moth assemblages of different average body sizes based on three hypotheses for SSD: (i) evolutionary constraints, (ii) fecundity selection, and (iii) sexual selection. The evolutionary constraint hypothesis suggests sex-specific responses to similar selection pressures as a cause of SSD. On the other hand, the fecundity selection and sexual selection hypotheses suggest the contribution of sex-specific selections to SSD. The fecundity selection hypothesis suggests that in female-biased SSD (FBSSD), males show an evolutionary response that is correlated with but weaker than female response to fecundity selection, hence a more variable female body size. In contrast, the sexual selection hypothesis suggests that in male-biased SSD (MBSSD), sexual selection on males produces a weaker evolutionary change in females, hence a more variable male body size. The well-documented observations of body size response to climate warming and geographic gradients provide a natural variation for examining the body size allometry for SSD. In this study, geometrid moth body size data retrieved from altitudinal surveys on Mount Kinabalu in 1965 and 2007 (0.7°C warming during this period) were analyzed to test the hypotheses for SSD allometry. Given that the decades of warming generally reduced moth body size, the evolutionary constraints hypothesis would predict that the male in FBSSD and the female in MBSSD in 2007 should have a greater body size variation over the other sex. The sex-specific selection hypotheses predict a less pronounced SSD in both FBSSD and MBSSD for assemblages with smaller average body size, which were found at lower altitudes and after decades of warming. The results show
vi
no difference in the sex difference in body size variation or SSD in MBSSD across altitudes and decades of warming. However, the less pronounced FBSSD after decades of climate warming supports the prediction based on the natural selection hypothesis.
Moreover, the SSD variation is mainly caused by female size change according to the result of principal component analysis. The results imply that the response of body size structure to environmental changes can be driven primarily by female responses to selection pressures. Overall, this study reveals that trait changes in a species could be attributed to the evolutionary response of some individuals (e.g., females) along with genetically-correlated others (e.g., males), which implicates the potential influences of intraspecific variation on evolutionary processes.
Keywords: Intraspecific variation; Sexual size dimorphism; Body size allometry;
Altitude; Climate warming
Contents
謝誌 ... ii
摘要 ... iii
Abstract ... v
Introduction ... 1
Intraspecific and intersexual variation ... 1
Sexual size dimorphism and body size allomery for SSD ... 2
Body size change along geographic gradients and over climate change ... 4
Hypotheses and predictions ... 5
Methods ... 7
Overview ... 7
Study system ... 7
Transect for specimen collection (Chen et al., 2009; Holloway, 1970; Wu et al., 2019) ... 9
Specimen measurement (Wu et al., 2019) ... 9
SSD calculation and data filtration ... 10
Statistics ... 11
Results ... 12
SSD descriptions ... 12
Coefficient of variation ... 13
Sex-specific selections ... 13
viii
Correlations between response variables ... 14
Discussion ... 15
References ... 19
Appendix ... 51
Contents of Tables
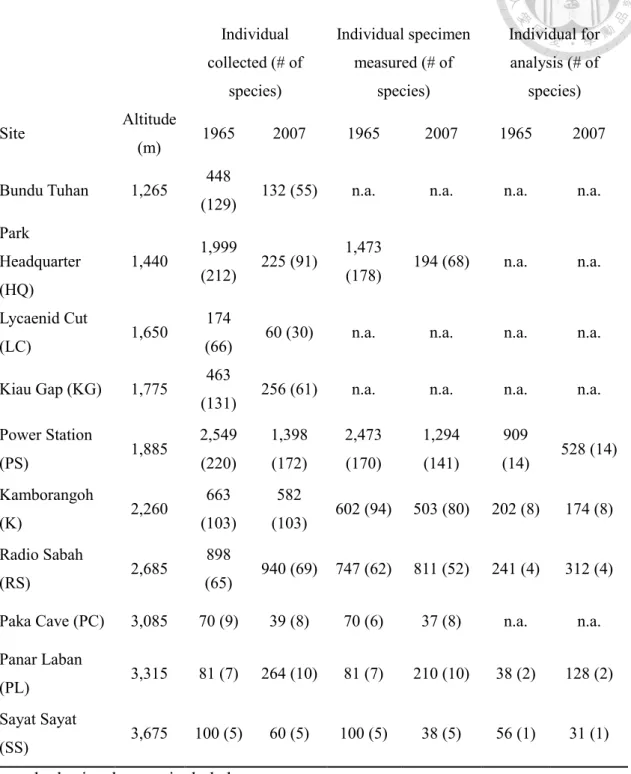
Table 1. Number of collected, measured, and analyzed geometrid moth samples along altitudinal
gradients for the year 1965 and 2007 (modified from Wu et al., 2019). ... 29
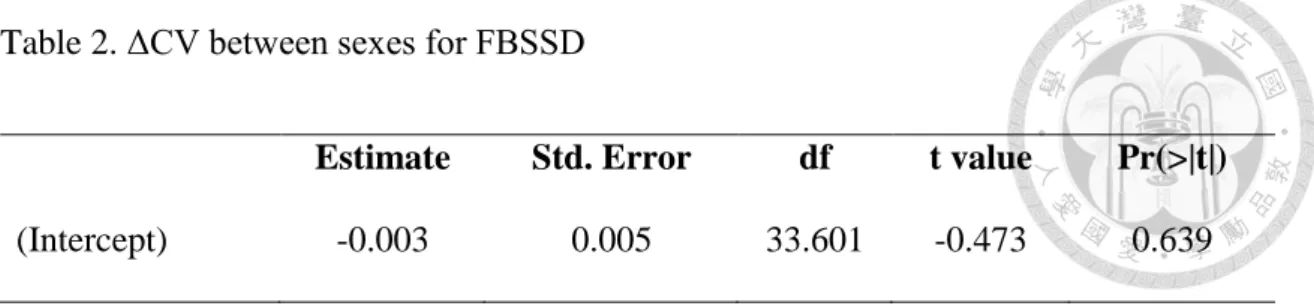
Table 2. ΔCV between sexes for FBSSD ... 30
Table 3. ΔCV between sexes for MBSSD ... 31
Table 4. Results of linear mixed model testing the effects of year and altitude on SSDi for FBSSD assemblages. ... 32
Table 5. Results of linear mixed model testing the effects of year and altitude on SSDi for MBSSD assemblages. ... 33
Table 6. Correlation table for FBSSD ... 34
Table 7. Correlation table for MBSSD ... 35
Table 8. Correlation table for all classes of SSD ... 36
x Contents of Figures
Figure 1. A conceptual diagram showing how sex difference in genetic variation of body size leads to FBSSD. ... 37 Figure 2. A conceptual diagram showing how sex difference in genetic variation of body size leads to MBSSD. ... 38 Figure 3. A conceptual diagram showing different responses of females and males toward a smaller body size according to fecundity selection hypothesis. ... 39 Figure 4. A conceptual diagram showing different responses of females and males toward a smaller body size according to sexual selection hypothesis. ... 40 Figure 5. The percentages of each SSD classes in the year 1965 and 2007 with the number of assemblages indicated by the Y-axis. The N/As indicate the presences of assemblages with only one females or males... 41 Figure 6. The percentages of each SSD classes (FBSSD, MBSSD, NSSSD, and N/A) at different
altitudinal sites for both the year 1965 and 2007 with the number of assemblages indicated by the Y-axis.
The N/As indicate the assemblages with only one female or male. ... 42 Figure 7. The change of SSDi for each population across years with line colors showing the direction and the magnitude of the SSDi change. The darker purple color indicates a larger increase in SSDi across years, while the darker red color indicates a larger decrease in SSDi across years. The two dotted
horizontal lines mark the threshold, 2% sexual size difference, for classification of SSD. ... 43 Figure 8. The sex difference in CV (ΔCV) for FBSSD assemblages in 2007. The red dot with standard errors represents sex difference in CV estimated by linear mixed model. The grey points indicate the ΔCV of assemblages in raw data. ... 44 Figure 9. The sex difference in CV (ΔCV) for MBSSD in 2007. The red dot with standard errors
represents sex difference in CV estimated by linear mixed model. The grey points indicate the ΔCV of assemblages in raw data. ... 45 Figure 10. The SSDi for FBSSD assemblages across altitudes and over decades. The lines represent the SSDi along altitudes in two years predicted by linear mixed model, while the points are the SSDi of assemblages in raw data. The data and the predictions in 1965 and 2007 are colored orange and purple, respectively. ... 46
Figure 11. The SSDi for MBSSD assemblages across altitudes and over decades. The lines represent the SSDi along altitudes in two years predicted by linear mixed model, while the points are the SSDi of assemblages in raw data. The data and the predictions in 1965 and 2007 are colored orange and purple,
respectively. ... 47
Figure 12. PCA for FBSSD assemblages. ... 48
Figure 13. PCA for MBSSD assemblages. ... 49
Figure 14. PCA for all classes of SSD assemblages. The colors indicate the SSD class... 50
1
Introduction
Intraspecific and intersexual variation
Determining and determined by evolutionary process of a species, intraspecific variation is central to evolutionary biology and ecology. Intraspecific variations are determinant to the evolutionary response of a species to environmental change (Arnold, 1992; J. M. Smith et al., 1985). The variations represent the potential trait pools,
affecting the immediate response to selection. Conversely, the intraspecific variations of a species are shaped by genetic ecological process and environmental plasticity. These processes show the inherent nature of circular causality in the evolutionary process.
What complicates the situation is the correlations among traits (Phillips & Arnold, 1989; O’Neil & Schmitt, 1993; Mitchell‐Olds, 1996; Conner et al., 2011) or
associations between traits and other factors. For example, the traits of different sexes can be different (i.e., intersexual variation) due to sex-specific selection or sex-specific response to similar selection. Sex difference in body size is termed sexual size
dimorphism (SSD). If females and males show differential body size change in response to environmental factors, the degree of SSD will change accordingly. The change of SSD may induce evolutionary change, such as the degree of sexual conflicts and reproductive strategies (Cabana et al., 1982; Andersson, 1994; Gowaty & Buschhaus, 1998; Ding & Blanckenhorn, 2002; W. U. Blanckenhorn, 2005).
Sexual size dimorphism and body size allomery for SSD
Sexual size dimorphism (SSD) describes the sex difference in body size.
Female-biased SSD (FBSSD) means that females are larger than males, which is commonly found in insects (Tammaru et al., 1996; Stillwell et al., 2010). Male-biased SSD (MBSSD) means that the male is the larger sex, which is usually found in primates (Clutton-Brock et al., 1977; Gaulin & Sailer, 1984; Mitani et al., 1996; Dunham et al., 2013). The hypotheses for SSD can be categorized into (i) evolutionary constraints and (ii) natural selection. The evolutionary constraint hypothesis suggests that sex-specific responses to similar selection pressures as a cause of SSD; for example, if one of the sexes has a more addictive genetic variation, that sex may express a stronger response in traits under the same selection pressure (Leutenegger & Cheverud, 1982; Leutenegger
& Larson, 1985; Dale et al., 2007). The natural selection hypotheses includes resource partitioning between sexes due to intersexual resource competition (Selander, 1972), fecundity selection on females (Honěk, 1993; Head, 1995; D. J. Fairbairn, 1997), and sexual selection typically on males (Clutton-Brock et al., 1977; Gaulin & Sailer, 1984;
Payne, 1984; Webster, 1992; D. J. Fairbairn, 1997; Kraushaar & Blanckenhorn, 2002).
Resource competition between sexes may lead to SSD via disruptive selection on body sizes, but the outcome is constrained by the strong positive genetic correlation between females and males. A more intense intraspecific than interspecific competition in species-poor communities may allow the disruptive selection between sexes rather than between species to dominate and reach sexual niche partitioning (Slatkin, 1984; Shine, 1989; Berns, 2013). Fecundity selection hypothesis could explain the occurrence of FBSSD (Darwin, 1874). Fecundity selection selects for females with large body sizes as they provide greater body spaces to contain more offspring (Williams, 1966) and higher
3
energy storage to invest into reproduction (Calder, 1984). In contrast to fecundity selection on females, sexual selection typically acts on males, producing MBSSD.
Mechanistic basis for sexual selection includes female choice (lepidoptera: LaMunyon
& Eisner, 1993; Wedell, 2005) and same-sex competition (e.g., lepidoptera:
(Matsumoto & Suzuki, 1992).
SSD have been found to vary with average body size within a species, a clade, or a taxon (Rensch, 1959; Abouheif & Fairbairn, 1997; D. J. Fairbairn, 1997; W.
Blanckenhorn et al., 2006; Dale et al., 2007; Piross et al., 2019; Webb & Freckleton, 2007). The body size allometry for SSD is termed Rensch’s rule when male is the more variable sex among species or populations; contrarily, it is called conversed Rensch’s rule. Rensch’s rule is valid mostly in taxa presenting MBSSD, while in taxa presenting FBSSD the pattern seems not to be consistent with Rensch’s rule (Webb & Freckleton, 2007). Sex-specific selection hypotheses for SSD, such as fecundity selection and sexual selection, may explain the distinct patterns between the SSD allometry in taxa of MBSSD and that of FBSSD(Dale et al., 2007; Daphne J. Fairbairn, 2005). Sex-specific selection on one sex would induce an evolutionary response in the other sex due to high genetic correlation between sexes, yet genes between sexes is not totally corresponding.
Body size change could mainly depend on the body size response of selected sex, while the body size of the other sex co-varies at a lesser degree (Payne, 1984; Webster, 1992;
Abouheif & Fairbairn, 1997; D. J. Fairbairn, 1997; Dale et al., 2007). Accordingly, fecundity selection on females in FBSSD taxa would cause female body sizes to be more variable among species or populations; sexual selection on males in MBSSD would cause male body sizes to be more variable among species or populations.
Body size change along geographic gradients and over climate change
Systematic body size variations among closely related species and among populations have been observed for centuries. One of the earliest descriptions of body size clines, Bergmann’s rule (Bergmann, 1848 translated in James, 1970), suggests that species of larger body size are found in colder climates, while those of smaller body size are found in warmer environment. The explanation for this body size phenomenon is that larger organisms under colder climates have lowered heat loss because of their smaller body surface area to volume ratio. While the explanation is applicable only to endotherms, many ectotherms also show the body size patterns (Timofeev, 2001;
Olalla‐Tárraga et al., 2006). Another well-established theory proposed specifically for the ectotherms is the temperature-size rule (Atkinson, 1994), which suggests the phenotypic plasticity of body size in response to the environmental temperature. At a lower temperature, ectotherms grow slower with a longer growth period, resulting in larger body sizes, vice versa. Thus, corresponding body size variations can be observed along the temperature clines over geographic gradients or climate change periods (altitude: Stalker & Carson, 1948; Janzen et al., 1976; Hawkins & deVries, 1996;
latitude: Arnett & Gotelli, 1999; Timofeev, 2001; Olalla‐Tárraga et al., 2006; climate warming: Gardner et al., 2011; Sheridan & Bickford, 2011; Ohlberger, 2013).
The body size variations formed from the natural adaptation could provide a source for studying body size allometry. Presumptions for the body size allometry could be derived based on the adaptation to environment. For example, SSD allometry along
5
latitude could be explained by some environmental factors varying systematically along geographic gradients (W. Blanckenhorn et al., 2006; Stillwell et al., 2007). While environmental clines with the associated body size clines along latitudes have been used to assess SSD allometry, little is known about the SSD allometry pattern along altitudes.
In addition to geographic gradients, climate warming has altered the environmental conditions and subsequently reduced body size in many organisms (Gardner et al., 2011; Sheridan & Bickford, 2011; Ohlberger, 2013). This body size change along time axis could not only provide sources for assessing SSD allometry, but it could implicit the potential for evolution to occur over generations.
Hypotheses and predictions
In this study, I aimed to investigate the body size allometry for SSD for
geometrid moth assemblages of different average body sizes based on three hypotheses for SSD: (i) evolutionary constraints, (ii) fecundity selection, and (iii) sexual selection.
The hypotheses and related predictions are listed below:
1) Evolutionary constraints: Sexes respond differently to the same selection pressures because one of the sexes has more additive genetic variation for body size (Leutenegger & Cheverud, 1982; Leutenegger & Larson, 1985;
Dale et al., 2007). Thus, when climate warming potentially selects for smaller body size, populations would consequently present FBSSD if males are the sex with more genetic variation to react quickly (Figure 1) and present MBSSD if females are the sex with more genetic variation (Figure 2). Therefore, over climate warming period, smaller sex is expected to
demonstrate higher variation in body size, which may, to some extent, reflect genetic variation. Additionally, the magnitude of SSD would positively correlated with the body size variation of smaller sex.
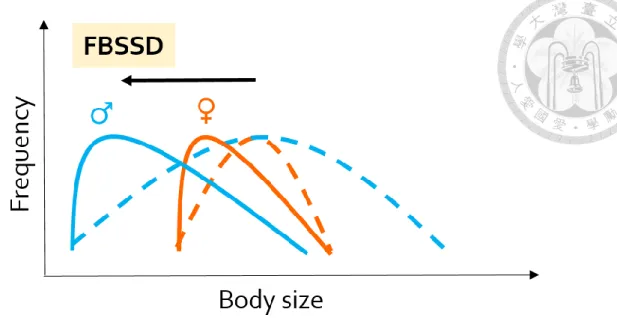
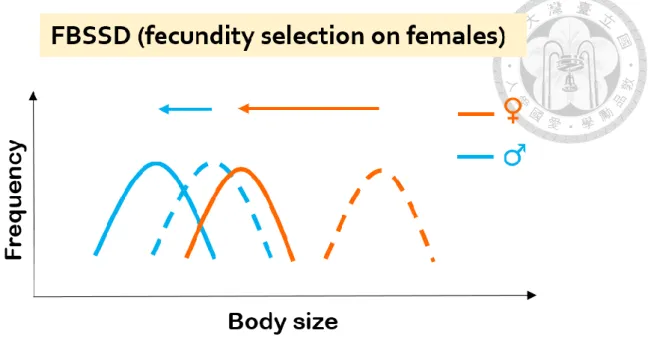
2) Fecundity selection (sex-specific selection): Fecundity selection on female body size is predominant in FBSSD (Tilley, 1968). In this case, female body size would be sensitive to environment changes, while males show a weaker evolutionary response in size because they genetically correlates with females. Thus, I predict that FBSSD would become less pronounced after climate warming and at lower altitudes, where the body size becomes smaller (Figure 3), and that female mean body size is the main contribution to the change of the magnitude of SSD in FBSSD.
3) Sexual selection (sex-specific selection): A potential cause of MBSSD is the sexual selection on males (Clutton-Brock et al., 1977; Gaulin & Sailer, 1984, p. 198; Payne, 1984; Webster, 1992; Abouheif & Fairbairn, 1997; Kraushaar
& Blanckenhorn, 2002). Male body size would be more variable when environment changes, while female body size would co-vary with male body size because of genetic correlation, yet has a weaker response. Thus, I
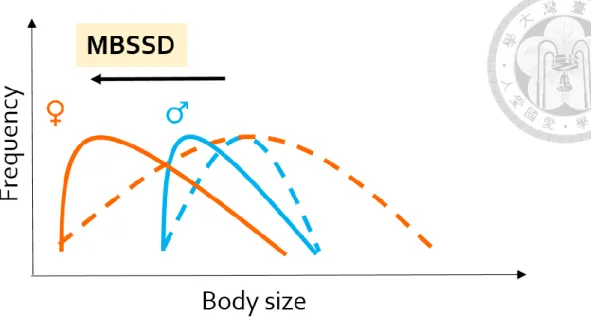
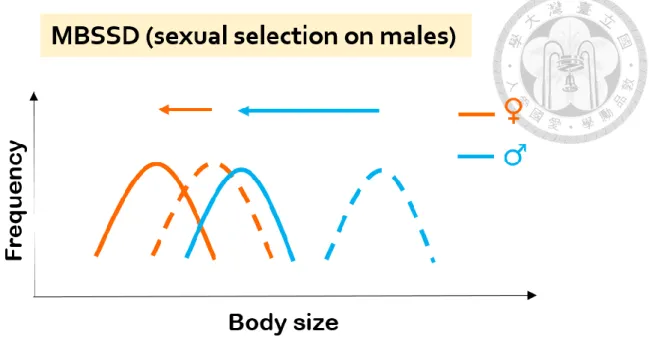
predict that MBSSD would become less pronounced after climate warming and at lower altitudes, where the body size becomes smaller (Figure 4), and that male mean body size is the main contribution to the change of the magnitude of SSD in MBSSD.
7
Methods
Overview
The process for assessing the body size allometry for sexual size dimorphism in geometrid moths includes: moth collection, specimen measurement, data compilation, and data analysis. Geometrid moths were collected from the altitudinal survey in Kinabalu National Park, Malaysia in 1965, while a resurvey was conducted in 2007, following the same protocol as in 1965. The measurement of body size index and the identification of sexes were from Wu et al. (2019). I calculated the SSD index (SSDi) using the body size data of female and male geometrid moths for each population in 1965 and 2007. The moth populations were then classified by SSDi values into three classes of SSD: FBSSD, NSSSD, and MBSSD. Only populations with at least 3 females and 3 males were used in analyzing the change of SSDi and the sex difference in CV across altitudes and over decades. Linear mixed-effect models were utilized to examine if SSDi changes across altitudes and decades of climate warming meet the predictons of the sex-specific selection hypotheses. The hypotheses were further tested using
principal component analysis (PCA), which would reveal whether the body size change of one sex contributes more to the SSDi changes.
Study system
Body size data in this study were retrieved from the geometrid moths (family Geometridae) on Mt. Kinabalu across 10 sites at different altitudes (from 1,265 m to
3,675 m) in both 1965 and 2007. Located within the Kinabalu National Park, the sampling sites on Mountain Kinabalu, Sabah, Malaysia (6°4’N, 116°33’E) have been well protected since 1964. Mt. Kinabalu had a mean annual temperature of 27.5 °C at sea level and an estimated lapse rate of 0.0055 °C m-1 (Kitayama, 1992). This region experienced an increase of 0.7°C in mean annual temperature from 1965 to 2007, which was estimated from the data of the 5° cell containing Mt. Kinabalu from Global
Historical Climatology Network
(www.ncdc.noaa.gov/oa/climate/research/ghcn/ghcngrid.html#top). This study used this estimation due to the lack of local weather records. While the mean annual temperature increased over decades, the vegetation changed little from 1965 to 2007 (Chen et al., 2009), which may explain away the potential effect of habitat type change on body size.
Therefore, the changes in moth body size, if they exist, are more likely caused by a change in temperature instead of habitat types.
Arthropod body sizes are sensitive to environmental conditions (Schulte, 2015).
Thus, they are appropriate materials to examine the effect of climate warming and environmental gradients on species. In this study system, the body sizes of geometrid moths in Mt. Kinabalu were found to be smaller after decades of climate warming and at lower altitudes (Appendix). In addition, in lepidoptera, 73% FBSSD, 21% NSSSD, and 6% MBSSD were reported ((Stillwell et al., 2010). The different classes of SSD allows the comparison of size allometry in different SSD classes.
9
Transect for specimen collection (Chen et al., 2009; Holloway, 1970; Wu et al., 2019)
Geometrid moth specimens of Mt. Kinabalu were collected in 1965 from 10 sites at different altitudes (from 1265m to 3675m a.s.l.); after 42 years, Chen et al.
(2009) repeated the altitudinal transect survey in 2007 with the same protocols, techniques, and comparable catch size. Sampling was executed in August and
September of the year 1965 and 2007, at similar moon phases, and at similar stage of the El Niño-Southern Oscillation (ENSO) cycle. Moths were collected by Tilley lamps or mercury vapor traps along with hand collection for those perched on vegetation by traps. The trap type for each site along the altitudinal transect was the same as in 1965.
The sampling took place after sunset, mainly from 18:00 to 23:00, while mercury vapor traps worked overnight with moths collected at dawn (more details in Chen et al., 2009, 2011b). Geometrid moth specimens were sorted to species level with ambiguous ones dissected and identified by genitalia (ca. 10% of the geometrids caught). In total, 3,956 geometrid moth individuals from 271 species were recorded in 2007, compared to 7,445 individuals from 335 species in 1965 (Table 1).
Specimen measurement (Wu et al., 2019)
Highly correlated with body length (Loder et al., 1998) and affected little by specimen condition, the right forewing length was used as the index of moth body size.
Specifically, the forewing length was measured from the wing-thorax junction to the wing tip. All measurements were performed by one person under a dissecting
microscope with a 0.01 mm precision digital caliper, excluding specimens with
damaged or lost forewings. In total, the forewing length data comprises 5,546 individual specimens from 285 species in the year 1965 and 3,087 specimens from 222 species in the year 2007, respectively (Table 1).
SSD calculation and data filtration
Sexual size dimorphism index (SSDi) was calculated for each population (i.e., a species at a site in a given year) by taking the natural logarithm of mean size of females divided by that of males (Equation 1; R. J. Smith, 1999).
Equation 1.
SSDi = ln (𝑓𝑒𝑚𝑎𝑙𝑒 𝑚𝑒𝑎𝑛 𝑠𝑖𝑧𝑒
𝑚𝑎𝑙𝑒 𝑚𝑒𝑎𝑛 𝑠𝑖𝑧𝑒 ) = ln (𝑓𝑒𝑚𝑎𝑙𝑒 𝑚𝑒𝑎𝑛 𝑠𝑖𝑧𝑒) − ln (𝑚𝑎𝑙𝑒 𝑚𝑒𝑎𝑛 𝑠𝑖𝑧𝑒)
For representativeness, only populations with 3 or more females and males were included in the analysis of CV and SSDi change. After filtering out the data below the threshold, the body size data of 4079 and 2051 individual specimens from 83 and 48 species in 1965 and 2007, respectively, were used in the analysis (Table 1). Determined by 2% sex difference in mean body size, sexual size dimorphism for each population was assigned FBSSD (female-biased SSD), MBSSD (male-biased SSD), or NSSSD (non-significant SSD). In the following analysis, data of FBSSD and MBSSD
11
populations were separated for testing the fecundity selection and sexual selection hypotheses respectively.
Statistics
A species at a site in a year was defined as a population in this study. Filtered data for analysis comprises 129 FBSSD populations and 38 MBSSD populations.
FBSSD and MBSSD data were analyzed separately because of the respective hypotheses and predictions for different SSD classes (Webb & Freckleton, 2007).
Linear mixed-effect models were used in the analyses, including taxonomy effect as a random effect to control the large variation in body size across taxa. All analysis was performed in R.
Sex difference in body size variation was analyzed using linear mixed-effect model to test the evolutionary constraint hypothesis. The model included the difference in the coefficient of variation (CV) between females and males (ΔCV; female CV deducted male CV) in 2007 as the response variable with taxonomy set as the random effect (Equation 2; R package: lme4). The CVs of female and male body sizes were used to represent their genetic variations (Leutenegger & Larson, 1985), and the CV of the forewing length, a proxy of body size, was calculated for each sex in each
population.
Equation 2.
∆CV~1 + (1|Species)
Fecundity selection hypothesis for FBSSD and sexual selection hypothesis for MBSSD predict a greater body size change in females and males, respectively, along body size clines; hence a less pronounced FBSSD and MBSSD for populations with smaller average body sizes (at lower altitudes and over decades of climate warming). I used linear mixed-effect model to test whether SSDi changes along body size clines, setting SSDi as response variable and altitude (fixed effect), year (fixed effect), and taxonomy (random intercept effect) as explanatory variables (Equation 3; R package:
lme4). Likelihood-ratio tests suggest that models with interaction terms do not have a significantly better fitting. To determine whether the SSDi change is caused primarily by female or male body size change, I used principal component analysis (PCA) to reveal the correlations among SSDi, the mean body sizes, and the CVs of the two sexes (R package: vegan).
Equation 3.
SSDi~Year + Altitude + (1|Species)
Results
SSD descriptions
The geometrid moth specimen data indicates the presence of 413 assemblages in 1965 and 297 assemblages in 2007 across altitudinal sites in Mt. Kinabalu. An overview of SSD description for the geometrid moth specimen data suggests 25.91 % FBSSD,
13
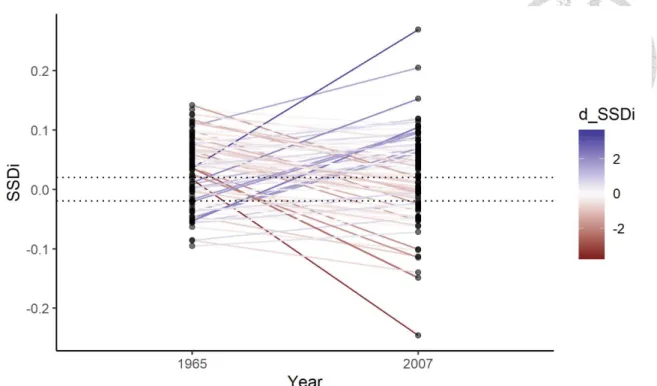
11.86 % NSSSD, and 9.93 % MBSSD in 1965 and 21.21 % FBSSD, 10.44 % NSSSD, and 9.76 % MBSSD in 2007 (Figure 5). The altitude-specific percentages for SSD classes in 1965 and 2007 are summarized in Figure 6, with the number of assemblages in the Y-axis. assemblages with only one of the sexes collected at a site contribute to the unknown SSD (noted as N/A) to indicate their presences. For species that appeared at a site in both years and were available for SSDi calculation, 104 populations decreased and 94 of populations increased in SSDi over years (Figure 7).
Coefficient of variation
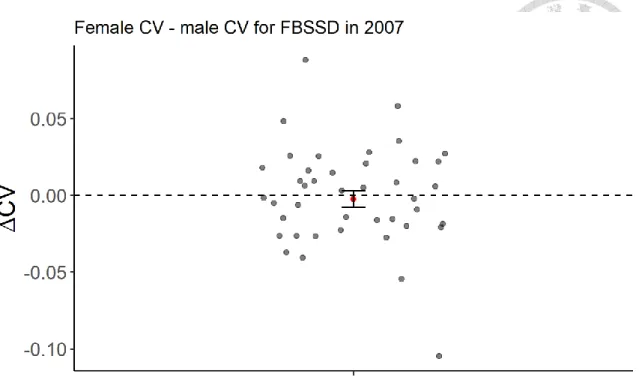
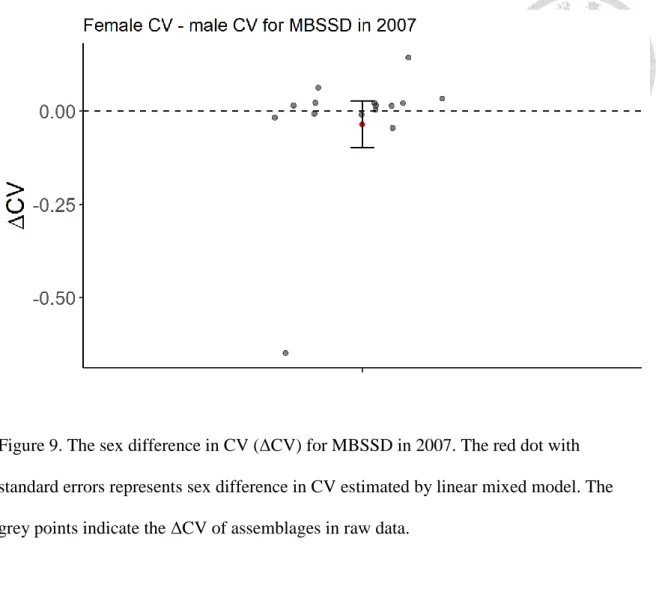
Neither in the FBSSD nor the MBSSD subset does the estimate of sex difference in the CV of body size, calculated by the CV of female body size minus the CV of male body size, significantly differ from zero (Table 2& Table 3). The results suggest little sex difference in the CV of body size in the year 2007 (Figure 8 for FBSSD & Figure 9 for MBSSD).
Sex-specific selections
The analysis for assemblages of FBSSD shows a significant effect of year, but not altitude, on SSDi. Specifically, SSDi decreased over decades, suggesting that FBSSD became less pronounced over decades (Figure 10 & Table 4). As for
assemblages of MBSSD, SSDi was not affected by either year or altitude (Figure 11 &
Table 5).
Correlations between response variables
PCA results indicate that female and male mean body size were highly
correlated but not totally corresponded in all SSD classes (Figure 12, Figure 13, Figure 14, Table 6, Table 7, & Table 8). Variances of FBSSD, MBSSD, and all SSD
assemblages were 67.6%, 77.9%, and 67.2%, respectively, explained by the first two principal components (PCs). SSDi had a greater correlation with female mean body size than with male mean body size in assemblages of all classes of SSD (0.304 vs. 0.0.212 in FBSSD; 0.095 vs. -0.019 in MBSSD; and 0.218 vs. 0.04 in all SSD). As the SSDi was determined by the mean body size of females and males, the higher correlations with females indicate that the SSDi change is more dependent on female mean body size than on male mean body size (Figure 12, Figure 13, Figure 14, Table 6, Table 7, &
Table 8). As for the correlation of SSDi and the CV, SSDi had a higher positive correlation with the CV of females than with that of males in FBSSD (Figure 12 &
Table 6). This suggests that a more pronounced FBSSD is correlated with larger female CV. Moreover, SSDi had a higher negative correlation with the CV of males (-0.86) than the slightly positive correlation with that of females (0.03) in MBSSD (Figure 13
& Table 7). This means a more pronounced MBSSD is correlated with larger male CV, given that the more pronounced MBSSD has a more negative value in SSDi. Thus, the correlations of SSDi and the CVs point to the conclusion that the more pronounced SSD is positively correlated with the CV of the larger sex in both FBSSD and MBSSD.
15
Discussion
This study assessed the body size allometry for SSD along altitudinal gradients and climate warming, using geometrid moths, a taxon presenting different SSD classes.
Three hypotheses were tested based on the hypotheses proposed for the formation of SSD in different scenarios: (i) evolutionary constraints, (ii) fecundity selection, and (iii) sexual selection hypotheses. The evolutionary constraint hypothesis suggests sex- specific response to the same selection pressure, which is the climate warming selecting for smaller body size in this study. However, this hypothesis is not supported by this study as the sex difference in the CV of body size of geometrid moth assemblages in 2007 were not significant in neither FBSSD nor MBSSD assemblages. In addition, the SSD magnitude was more positively correlated with the body size CV of the larger sex rather than that of the smaller sex. Fecundity selection hypothesis suggests that the sex- specific selection on females, as the main cause of FBSSD, determines the body size shifts, while the males show a weaker response. Sexual selection hypothesis suggests that the sex-specific selection on males, as the main cause of MBSSD, determines the body size shifts, while the females show a weaker response. The results of linear models met the prediction for FBSSD over years, but not altitudinal gradients, nor the
predictions by sexual selection hypothesis for MBSSD. Moreover, PCA results suggest that the SSD magnitude was more dependent on the female body size in either FBSSD or MBSSD. These together support the fecundity selection hypothesis and suggest that female body size responded more to the environmental change, thereby altering the SSD magnitude.
Despite the non-significant results in the sex difference in the CV of body size in geometric moths, the PCA results imply that evolutionary constraint hypothesis is potentially valid in the opposite way to my prediction: sex-specific response to the same selection toward larger body size rather than toward smaller body size. The sex
differences in body size variation in 2007 fail to meet the predictions deduced from the evolutionary constraint hypothesis. Although the non-significant result in the sex difference in the CV may be confounded by the phenotypic plasticity to the
environment, the PCA results may still provide some implications. The PCA results suggest that the magnitude of SSD is more pronounced with the body size variation of the larger sex (with the smaller sex less correlated). The results are in accordance with primate studies, where the larger sex showed a greater variability than the smaller sex (Leutenegger & Larson, 1985; Wood, 1976). This pattern echoes the evolutionary constraint hypothesis with an assumption opposite to my prediction: the FBSSD and MBSSD assemblages are shaped by sex-specific response to the similar selection pressure selecting for larger body size. If the evolutionary constraint hypothesis assumed to be the mechanism forming SSD in geometrid moths, the results imply that SSD is formed from the advantage of larger size rather than that of the smaller sex despite the body size shrinkage under climate warming.
A comparison between this study and others using different taxa suggests that a change in SSD might depend on the main selection pressures in different taxa (Webb &
Freckleton, 2007), influencing the subsequent evolutionary process accordingly. This study found that the magnitude of SSD in geometrid moth assemblages of FBSSD had decreased over decades of climate warming and that the variation of the magnitude of SSD was driven primarily by the response of female body size, both of which are
17
consistent with the predictions of fecundity selection. While the result of MBSSD assemblages indicates no significant differences across altitudes and years, the change of SSD magnitude was more dependent on the response of female body size, both of which are inconsistent with the predictions of sexual selection hypothesis. These results of SSD allometry is opposite to Rensch’s rule in which males were found to be the more variable sex within a taxon (Rensch, 1959; Clutton-Brock et al., 1977; Ralls, 1977;
Leutenegger & Cheverud, 1982; Abouheif & Fairbairn, 1997; D. J. Fairbairn, 1997; W.
Blanckenhorn et al., 2006). However, consistent with studies in taxa where fecundity selection is predominant (e.g., insects: (Teder & Tammaru, 2005; Piross et al., 2019), FBSSD in this study was less pronounced in assemblages of smaller body size, and the SSD magnitude change was more dependent on female body size . The aforementioned results along with previous studies indicate that body size allometry for SSD is not universal but may depend on the main cause of SSD in the taxon. In addition, the result that female body size is more variable among assemblages implies that the change of a trait may be resulted from the evolutionary response of some individuals with others co- varying due to genetic correlations in the trait. The change of intraspecific variations in traits then can influence the subsequent evolutionary process, which may generate important ecological and evolutionary consequences. For instance, in this particular case of SSD, the reduction in sexual size difference may alter the intraspecific and
interspecific resource competition intensities, sexual conflicts, and reproductive strategies; hence evolutionary trajectory.
Although the results reveal insights for SSD allometry and intraspecific variations in body size response to environmental change, this study has some
limitations and gaps remained to be filled. First, I indirectly tested the mechanisms for
SSD by assessing body size variations in sexes and SSD allometry predicted by the focal hypotheses. Better and direct examinations of these mechanisms would require the estimation of additive genetic variations in two sexes for evolutionary constraint
hypothesis and the quantification of the fecundity and sexual selections for sex-specific selection hypotheses. To specify the underlying mechanisms of SSD allometry,
researchers need to have a full understanding of the life history and reproductive
ecology of the target taxa to quantify the selection pressures. For example, reproductive strategies, mating systems, or the sex ratio can be used to define and quantify the strength of sexual selection (Dale et al., 2007; Leutenegger & Cheverud, 1982), yet these approaches are hindered by the data limitation and the lack of comprehensive knowledge of reproductive ecology in geometrid moth species in this study. Second, the SSD allometry assessment over climate warming periods reveals potential influences of climate warming on intraspecific variations, yet the validity and the comprehensiveness may be undermined without a complete time series of data. As the geometrid moth data were collected in only two time points across 42 years, the data may provide limited information about the changing process of assemblages in the 42-year period. Regular surveys over years can provide higher-resolution information about SSD allometry over time and may reveal the effect of climate warming on reproduction-related traits and population traits in different time scales. Furthermore, the cooperation of laboratory experiment with field survey may help clarify the genetic ecological process and phenotypic plasticity.
In conclusion, this study assesses the body size allometry for SSD and the sex difference in body size variations in geometrid moths, disentangling intraspecific differences in response to environmental change. Overall, the body size allometry for
19
SSD in geometrid moth assemblages supports the predictions of fecundity selection hypothesis but not the sexual selection hypothesis. The more pronounced SSD correlated with a more body size variation in the larger sex implies the SSD of the geometrid moths were resulted from an advantage of a larger body size in a sex
according to evolutionary constraint hypothesis. By examing the SSD allometry across geographic gradients and over climate warming periods, this study also provides insights into the climate change ecology: the intraspecific difference in response to environmental change. As a source of intraspecific variation, SSD along with the general body size shrinkage has changed over the period of climate warming.
Associated with reproductive strategy, sexual conflict, and other evolutionary processes, SSD change under climate change may reveal the eco-evolutionary processes in play.
Collectively, considering SSD as a structured way of viewing the degree of intraspecific variation in body size, this study infers that the intraspecific variations could respond to environmental changes and have profound influences on the interspecific and
intraspecific interactions; hence evolutionary processes.
References
Abouheif, E., & Fairbairn, D. J. (1997). A Comparative Analysis of Allometry for Sexual Size Dimorphism: Assessing Rensch’s Rule. The American Naturalist, 149(3), 540–562. JSTOR.
Andersson, M. (1994). Sexual Selection. Princeton University Press.
Arnett, A. E., & Gotelli, N. J. (1999). Bergmann’s rule in the ant lion Myrmeleon immaculatus DeGeer (Neuroptera: Myrmeleontidae): geographic variation in body size and heterozygosity. Journal of Biogeography, 26(2), 275–283.
https://doi.org/10.1046/j.1365-2699.1999.00271.x
Arnold, S. J. (1992). Constraints on Phenotypic Evolution. The American Naturalist, 140, S85–S107. https://doi.org/10.1086/285398
Atkinson, D. F. (1994). Temperature and organism size-A biological law for ectotherms? Advances in Ecological Research 25: 1.
https://doi.org/10.1016/S0065-2504(08)60212-3
Bergmann, C. (1848). Ü ber die Verhältnisse der Wärmeökonomie der Thiere zu ihrer Größe.
Berns, C. M. (2013). The Evolution of Sexual Dimorphism: Understanding Mechanisms of Sexual Shape Differences. Sexual Dimorphism. https://doi.org/10.5772/55154 Blanckenhorn, W., Stillwell, R., Young, K., Fox, C., & Ashton, K. (2006). When
Rensch meets Bergmann: Does sexual size dimorphism change systematically with latitude? Evolution; International Journal of Organic Evolution, 60, 2004–
2011. https://doi.org/10.1111/j.0014-3820.2006.tb01838.x
Blanckenhorn, W. U. (2005). Behavioral Causes and Consequences of Sexual Size Dimorphism. Ethology, 111(11), 977–1016. https://doi.org/10.1111/j.1439- 0310.2005.01147.x
Cabana, G., Frewin, A., Peters, R. H., & Randall, L. (1982). The Effect of Sexual Size Dimorphism on Variations in Reproductive Effort of Birds and Mammals. The American Naturalist, 120(1), 17–25. https://doi.org/10.1086/283966
Chen, I.-C., Hill, J. K., Shiu, H.-J., Holloway, J. D., Benedick, S., Chey, V. K., Barlow, H. S., & Thomas, C. D. (2011). Asymmetric boundary shifts of tropical montane
21
Lepidoptera over four decades of climate warming. Global Ecology and
Biogeography, 20(1), 34–45. https://doi.org/10.1111/j.1466-8238.2010.00594.x
Chen, I.-C., Shiu, H.-J., Benedick, S., Holloway, J. D., Chey, V. K., Barlow, H. S., Hill, J. K., & Thomas, C. D. (2009). Elevation increases in moth assemblages over 42 years on a tropical mountain. Proceedings of the National Academy of Sciences, 106(5), 1479–1483. https://doi.org/10.1073/pnas.0809320106
Clutton-Brock, T. H., Harvey, P. H., & Rudder, B. (1977). Sexual dimorphism,
socionomic sex ratio and body weight in primates. Nature, 269(5631), 797–800.
https://doi.org/10.1038/269797a0
Conner, J. K., Karoly, K., Stewart, C., Koelling, V. A., Sahli, H. F., & Shaw, F. H.
(2011). Rapid Independent Trait Evolution despite a Strong Pleiotropic Genetic Correlation. The American Naturalist, 178(4), 429–441.
https://doi.org/10.1086/661907
Dale, J., Dunn, P. O., Figuerola, J., Lislevand, T., Székely, T., & Whittingham, L. A.
(2007). Sexual selection explains Rensch’s rule of allometry for sexual size dimorphism. Proceedings of the Royal Society B: Biological Sciences, 274(1628), 2971–2979. https://doi.org/10.1098/rspb.2007.1043
Ding, A., & Blanckenhorn, W. U. (2002). The effect of sexual size dimorphism on mating behaviour in two dung flies with contrasting dimorphism. Evolutionary Ecology Research, 4, 259–273. https://doi.org/info:doi/10.5167/uzh-172721
Dunham, A. E., Maitner, B. S., Razafindratsima, O. H., Simmons, M. C., & Roy, C. L.
(2013). Body size and sexual size dimorphism in primates: Influence of climate and net primary productivity. Journal of Evolutionary Biology, 26(11), 2312–
2320. https://doi.org/10.1111/jeb.12239
Fairbairn, D. J. (1997). Allometry for Sexual Size Dimorphism: Pattern and Process in the Coevolution of Body Size in Males and Females. Annual Review of Ecology and Systematics, 28(1), 659–687.
https://doi.org/10.1146/annurev.ecolsys.28.1.659
Fairbairn, Daphne J. (2005). Allometry for Sexual Size Dimorphism: Testing Two Hypotheses for Rensch’s Rule in the Water Strider Aquarius remigis. The American Naturalist, 166(S4), S69–S84. https://doi.org/10.1086/444600
Gardner, J. L., Peters, A., Kearney, M. R., Joseph, L., & Heinsohn, R. (2011). Declining body size: A third universal response to warming? Trends in Ecology &
Evolution, 26(6), 285–291. https://doi.org/10.1016/j.tree.2011.03.005
Gaulin, S. J. C., & Sailer, L. D. (1984). Sexual dimorphism in weight among the primates: The relative impact of allometry and sexual selection. International Journal of Primatology, 5(6), 515–535. https://doi.org/10.1007/BF02692284
Gowaty, P. A., & Buschhaus, N. (1998). Ultimate Causation of Aggressive and Forced Copulation in Birds: Female Resistance, the CODE Hypothesis, and Social Monogamy. Integrative and Comparative Biology, 38(1), 207–225.
https://doi.org/10.1093/icb/38.1.207
Hawkins, B., & deVries, P. (1996). Altitudinal gradients in the body sizes of Costa Rican butterflies.
https://www.academia.edu/28988947/Altitudinal_gradients_in_the_body_sizes_
of_Costa_Rican_butterflies
Head, G. (1995). Selection on Fecundity and Variation in the Degree of Sexual Size Dimorphism Among Spider Species (Class Araneae). Evolution, 49(4), 776–
781. JSTOR. https://doi.org/10.2307/2410330
23
Holloway, J. D. (1970). The biogeographical analysis of a transect sample of the moth fauna of Mt. Kinabalu, Sabah, using numerical methods. Biological Journal of the Linnean Society, 2(4), 259–286. https://doi.org/10.1111/j.1095-
8312.1970.tb01689.x
Honěk, A. (1993). Intraspecific Variation in Body Size and Fecundity in Insects: A General Relationship. Oikos, 66(3), 483–492. JSTOR.
https://doi.org/10.2307/3544943
James, F. C. (1970). Geographic Size Variation in Birds and Its Relationship to Climate.
Ecology, 51(3), 365–390. JSTOR. https://doi.org/10.2307/1935374
Janzen, D. H., Ataroff, M., Fariñas, M., Reyes, S., Rincon, N., Soler, A., Soriano, P., &
Vera, M. (1976). Changes in the Arthropod Community along an Elevational Transect in the Venezuelan Andes. Biotropica, 8(3), 193–203. JSTOR.
https://doi.org/10.2307/2989685
Kraushaar, U., & Blanckenhorn, W. U. (2002). Population variation in sexual selection and its effect on size allometry in two dung fly species with contrasting sexual size dimorphism. Evolution, 56(2), 307–321. https://doi.org/10.1111/j.0014- 3820.2002.tb01341.x
LaMunyon, C. W., & Eisner, T. (1993). Postcopulatory sexual selection in an arctiid moth (Utetheisa ornatrix). Proceedings of the National Academy of Sciences, 90(10), 4689–4692. https://doi.org/10.1073/pnas.90.10.4689
Leutenegger, W., & Cheverud, J. (1982). Correlates of sexual dimorphism in primates:
Ecological and size variables. International Journal of Primatology, 3(4), 387.
https://doi.org/10.1007/BF02693740
Leutenegger, W., & Larson, S. (1985). Sexual Dimorphism in the Postcranial Skeleton of New World Primates. Folia Primatologica, 44(2), 82–95.
https://doi.org/10.1159/000156199
Loder, N., Gaston, K. J., Warren, P. H., & Arnold, H. R. (1998). Body size and feeding specificity: Macrolepidoptera in Britain. Biological Journal of the Linnean Society, 63(1), 121–139. https://doi.org/10.1111/j.1095-8312.1998.tb01642.x
Matsumoto, K., & Suzuki, N. (1992). Effectiveness of the mating plug in Atrophaneura alcinous (Lepidoptera: Papilionidae). Behavioral Ecology and Sociobiology, 30(3), 157–163. https://doi.org/10.1007/BF00166698
Mitani, J. C., Gros-Louis, J., & Richards, A. F. (1996). Sexual Dimorphism, the Operational Sex Ratio, and the Intensity of Male Competition in Polygynous Primates. The American Naturalist, 147(6), 966–980.
https://doi.org/10.1086/285888
Mitchell‐Olds, T. (1996). Genetic Constraints on Life-History Evolution: Quantitative- Trait Loci Influencing Growth and Flowering in Arabidopsis Thaliana.
Evolution, 50(1), 140–145. https://doi.org/10.1111/j.1558-5646.1996.tb04480.x
Ohlberger, J. (2013). Climate warming and ectotherm body size – from individual physiology to community ecology. Functional Ecology, 27(4), 991–1001.
https://doi.org/10.1111/1365-2435.12098
Olalla‐Tárraga, M. Á., Rodríguez, M. Á., & Hawkins, B. A. (2006). Broad-scale
patterns of body size in squamate reptiles of Europe and North America. Journal of Biogeography, 33(5), 781–793. https://doi.org/10.1111/j.1365-
2699.2006.01435.x
O’Neil, P., & Schmitt, J. (1993). Genetic Constraints on the Independent Evolution of Male and Female Reproductive Characters in the Tristylous Plant Lythrum
25
Salicaria. Evolution, 47(5), 1457–1471. https://doi.org/10.1111/j.1558- 5646.1993.tb02168.x
Payne, R. B. (1984). Sexual Selection, Lek and Arena Behavior, and Sexual Size Dimorphism in Birds. Ornithological Monographs, 33, iii–52. JSTOR.
https://doi.org/10.2307/40166729
Phillips, P. C., & Arnold, S. J. (1989). Visualizing Multivariate Selection. Evolution, 43(6), 1209–1222. https://doi.org/10.1111/j.1558-5646.1989.tb02569.x
Piross, I. S., Harnos, A., & Rózsa, L. (2019). Rensch’s rule in avian lice: Contradictory allometric trends for sexual size dimorphism. Scientific Reports, 9(1), 1–9.
https://doi.org/10.1038/s41598-019-44370-5
Ralls, K. (1977). Sexual Dimorphism in Mammals: Avian Models and Unanswered Questions. The American Naturalist, 111(981), 917–938.
https://doi.org/10.1086/283223
Rensch, B. (1959). Evolution above the species level. http://agris.fao.org/agris- search/search.do?recordID=US201300282894
Schulte, P. M. (2015). The effects of temperature on aerobic metabolism: Towards a mechanistic understanding of the responses of ectotherms to a changing environment. Journal of Experimental Biology, 218(12), 1856–1866.
https://doi.org/10.1242/jeb.118851
Selander, R. K. (1972). Sexual selection and sexual dimorphism in birds. Sexual Selection of Descent of Man, 1871-1971. https://ci.nii.ac.jp/naid/10016064300/
Sheridan, J. A., & Bickford, D. (2011). Shrinking body size as an ecological response to climate change. Nature Climate Change, 1(8), 401–406.
https://doi.org/10.1038/nclimate1259
Shine, R. (1989). Ecological Causes for the Evolution of Sexual Dimorphism: A Review of the Evidence. The Quarterly Review of Biology, 64(4), 419–461.
https://doi.org/10.1086/416458
Slatkin, M. (1984). Ecological Causes of Sexual Dimorphism. Evolution, 38(3), 622–
630. JSTOR. https://doi.org/10.2307/2408711
Smith, J. M., Burian, R., Kauffman, S., Alberch, P., Campbell, J., Goodwin, B., Lande, R., Raup, D., & Wolpert, L. (1985). Developmental Constraints and Evolution:
A Perspective from the Mountain Lake Conference on Development and Evolution. The Quarterly Review of Biology, 60(3), 265–287.
https://doi.org/10.1086/414425
Smith, R. J. (1999). Statistics of sexual size dimorphism. Journal of Human Evolution, 36(4), 423–458. https://doi.org/10.1006/jhev.1998.0281
Stalker, H. D., & Carson, H. L. (1948). An Altitudinal Transect of Drosophila robusta Sturtevant. Evolution, 2(4), 295–305. JSTOR. https://doi.org/10.2307/2405520 Stillwell, R. C., Blanckenhorn, W. U., Teder, T., Davidowitz, G., & Fox, C. W. (2010).
Sex Differences in Phenotypic Plasticity Affect Variation in Sexual Size Dimorphism in Insects: From Physiology to Evolution. Annual Review of Entomology, 55(1), 227–245. https://doi.org/10.1146/annurev-ento-112408-
085500
Stillwell, R. C., Morse, G. E., Fox, C. W., Gilchrist, A. E. G. W., & Whitlock, E. M. C.
(2007). Geographic Variation in Body Size and Sexual Size Dimorphism of a Seed‐Feeding Beetle. The American Naturalist, 170(3), 358–369.
https://doi.org/10.1086/520118
Tammaru, T., Ruohomäki, K., & Saikkonen, K. (1996). Components of male fitness in relation to body size in Epirrita autumnata (Lepidoptera, Geometridae).
27
Ecological Entomology, 21(2), 185–192. https://doi.org/10.1111/j.1365-
2311.1996.tb01186.x
Teder, T., & Tammaru, T. (2005). Sexual size dimorphism within species increases with body size in insects. Oikos, 108(2), 321–334. https://doi.org/10.1111/j.0030- 1299.2005.13609.x
Tilley, S. G. (1968). Size-Fecundity Relationships and Their Evolutionary Implications in Five Desmognathine Salamanders. Evolution, 22(4), 806–816. JSTOR.
https://doi.org/10.2307/2406905
Timofeev, S. F. (2001). Bergmann’s Principle and Deep-Water Gigantism in Marine Crustaceans. Biology Bulletin of the Russian Academy of Sciences, 28(6), 646–
650. https://doi.org/10.1023/A:1012336823275
Webb, T. J., & Freckleton, R. P. (2007). Only Half Right: Species with Female-Biased Sexual Size Dimorphism Consistently Break Rensch’s Rule. PLOS ONE, 2(9), e897. https://doi.org/10.1371/journal.pone.0000897
Webster, M. S. (1992). SEXUAL DIMORPHISM, MATING SYSTEM AND BODY SIZE IN NEW WORLD BLACKBIRDS (ICTERINAE). Evolution;
International Journal of Organic Evolution, 46(6), 1621–1641.
https://doi.org/10.1111/j.1558-5646.1992.tb01158.x
Wedell, N. (2005). Female receptivity in butterflies and moths. Journal of Experimental Biology, 208(18), 3433–3440. https://doi.org/10.1242/jeb.01774
Wood, B. A. (1976). The nature and basis of sexual dimorphism in the primate skeleton.
Journal of Zoology, 180(1), 15–34. https://doi.org/10.1111/j.1469-
7998.1976.tb04660.x
Wu, C.-H., Holloway, J. D., Hill, J. K., Thomas, C. D., Chen, I.-C., & Ho, C.-K. (2019).
Reduced body sizes in climate-impacted Borneo moth assemblages are primarily
explained by range shifts. Nature Communications, 10(1), 1–7.
https://doi.org/10.1038/s41467-019-12655-y
29
Table 1. Number of collected, measured, and analyzed geometrid moth samples along altitudinal gradients for the year 1965 and 2007 (modified from Wu et al., 2019).
Individual collected (# of
species)
Individual specimen measured (# of
species)
Individual for analysis (# of
species)
Site Altitude
(m) 1965 2007 1965 2007 1965 2007
Bundu Tuhan 1,265 448
(129) 132 (55) n.a. n.a. n.a. n.a.
Park
Headquarter (HQ)
1,440 1,999
(212) 225 (91) 1,473
(178) 194 (68) n.a. n.a.
Lycaenid Cut
(LC) 1,650 174
(66) 60 (30) n.a. n.a. n.a. n.a.
Kiau Gap (KG) 1,775 463
(131) 256 (61) n.a. n.a. n.a. n.a.
Power Station
(PS) 1,885 2,549
(220)
1,398 (172)
2,473 (170)
1,294 (141)
909
(14) 528 (14) Kamborangoh
(K) 2,260 663
(103)
582
(103) 602 (94) 503 (80) 202 (8) 174 (8) Radio Sabah
(RS) 2,685 898
(65) 940 (69) 747 (62) 811 (52) 241 (4) 312 (4) Paka Cave (PC) 3,085 70 (9) 39 (8) 70 (6) 37 (8) n.a. n.a.
Panar Laban
(PL) 3,315 81 (7) 264 (10) 81 (7) 210 (10) 38 (2) 128 (2) Sayat Sayat
(SS) 3,675 100 (5) 60 (5) 100 (5) 38 (5) 56 (1) 31 (1) n.a.: body size data not included.
Table 2. ΔCV between sexes for FBSSD
Estimate Std. Error df t value Pr(>|t|)
(Intercept) -0.003 0.005 33.601 -0.473 0.639
31 Table 3. ΔCV between sexes for MBSSD
Estimate Std. Error df t value Pr(>|t|)
(Intercept) -0.036 0.063 9.96 -0.57 0.581
Table 4. Results of linear mixed model testing the effects of year and altitude on SSDi for FBSSD assemblages.
Estimate Std. Error df t value Pr(>|t|) (Intercept) 0.054 0.012 123.946 4.405 < 0.001
Year2007 -0.01 0.004 80.733 -2.284 0.025
Altitude < 0.001 < 0.001 125.094 0.971 0.333
33
Table 5. Results of linear mixed model testing the effects of year and altitude on SSDi for MBSSD assemblages.
Estimate Std. Error df t value Pr(>|t|)
(Intercept) -0.046 0.031 23.9 -1.501 0.147
Year2007 -0.008 0.009 19.435 -0.915 0.372
Altitude < 0.001 < 0.001 19.074 -0.178 0.86
Table 6. Correlation table for FBSSD
SSDi
mean_
f
mean_
m CV_f
CV_
m
ln (mean_f)
ln (mean_m)
SSDi 1 0.304 0.212 0.054
-
0.142 0.302 0.213
mean_f 0.304 1 0.995
- 0.188
-
0.219 0.978 0.973
mean_m 0.212 0.995 1
- 0.199
-
0.214 0.976 0.98
CV_f 0.054 -0.188 -0.199 1 0.23 -0.2 -0.21
CV_m
-
0.142 -0.219 -0.214 0.23 1 -0.23 -0.222 ln (mean_f) 0.302 0.978 0.976 -0.2 -0.23 1 0.996 ln
(mean_m) 0.213 0.973 0.98 -0.21 -
0.222 0.996 1
35 Table 7. Correlation table for MBSSD
SSDi
mean_
f
mean_
m CV_f
CV_
m
ln (mean_f)
ln (mean_m)
SSDi 1 0.095 -0.019 0.03
-
0.855 0.077 -0.055
mean_f 0.095 1 0.993
- 0.132
-
0.164 0.982 0.971
mean_m
-
0.019 0.993 1
- 0.135
-
0.072 0.978 0.982
CV_f 0.03 -0.132 -0.135 1 0.015 -0.12 -0.124
CV_m
-
0.855 -0.164 -0.072 0.015 1 -0.167 -0.054
ln (mean_f) 0.077 0.982 0.978 -0.12 -
0.167 1 0.991
ln
(mean_m)
-
0.055 0.971 0.982 - 0.124
-
0.054 0.991 1
Table 8. Correlation table for all classes of SSD
SSDi
mean_
f
mean_
m CV_f
CV_
m
ln (mean_f)
ln (mean_m)
SSDi 1 0.218 0.04
- 0.046
-
0.299 0.2 0.024
mean_f 0.218 1 0.982
- 0.182
-
0.144 0.979 0.96
mean_m 0.04 0.982 1
- 0.178
-
0.103 0.967 0.98
CV_f
-
0.046 -0.182 -0.178 1 0.097 -0.187 -0.182
CV_m
-
0.299 -0.144 -0.103 0.097 1 -0.148 -0.097
ln (mean_f) 0.2 0.979 0.967 - 0.187
-
0.148 1 0.984
ln
(mean_m) 0.024 0.96 0.98
- 0.182
-
0.097 0.984 1
37
Figure 1. A conceptual diagram showing how sex difference in genetic variation of body size leads to FBSSD. The orange and blue lines indicate the body size frequency patterns of females and males, respectively. The black arrow towards the smaller body size shows the selection pressure selecting towards smaller body size. The dashed lines represent the presumed body size frequency patterns before the selection towards smaller body size, while the solid lines represent the predicted body size frequency patterns after the selection towards smaller body size acted on both sexes. The illustrated process demonstrates the sex difference in response to the same selection pressure, leading to FBSSD.
Figure 2. A conceptual diagram showing how sex difference in genetic variation of body size leads to MBSSD. The orange and blue lines indicate the body size frequency patterns of females and males, respectively. The black arrow towards the smaller body size shows the selection pressure selecting towards smaller body size. The dashed lines represent the presumed body size frequency patterns before the selection towards smaller body size, while the solid lines represent the predicted body size frequency patterns after the selection towards smaller body size acted on both sexes. The illustrated process demonstrates the sex difference in response to the same selection pressure, leading to MBSSD.
39
Figure 3. A conceptual diagram showing different responses of females and males toward a smaller body size according to fecundity selection hypothesis. The orange and blue lines indicate the body size frequency patterns of females and males, respectively.
The orange and blue arrows show the shift of body size towards smaller body size. The dashed lines represent the presumed body size frequency patterns before the shift towards smaller body size, while the solid lines represent the predicted body size frequency patterns afterwards. This illustrated process demonstrates the sex difference in response to the selection pressure selecting towards smaller body size with fecundity selection on females, leading to a less pronounced FBSSD.
Figure 4. A conceptual diagram showing different responses of females and males toward a smaller body size according to sexual selection hypothesis. The orange and blue lines indicate the body size frequency patterns of females and males, respectively.
The orange and blue arrows show the shift of body size towards smaller body size. The dashed lines represent the presumed body size frequency patterns before the shift towards smaller body size, while the solid lines represent the predicted body size frequency patterns afterwards. This illustrated process demonstrates the sex difference in response to the selection pressure selecting towards smaller body size with sexual selection on males, leading to a less pronounced MBSSD.
41
Figure 5. The percentages of each SSD classes in the year 1965 and 2007 with the number of assemblages indicated by the Y-axis. The N/As indicate the presences of assemblages with only one females or males.
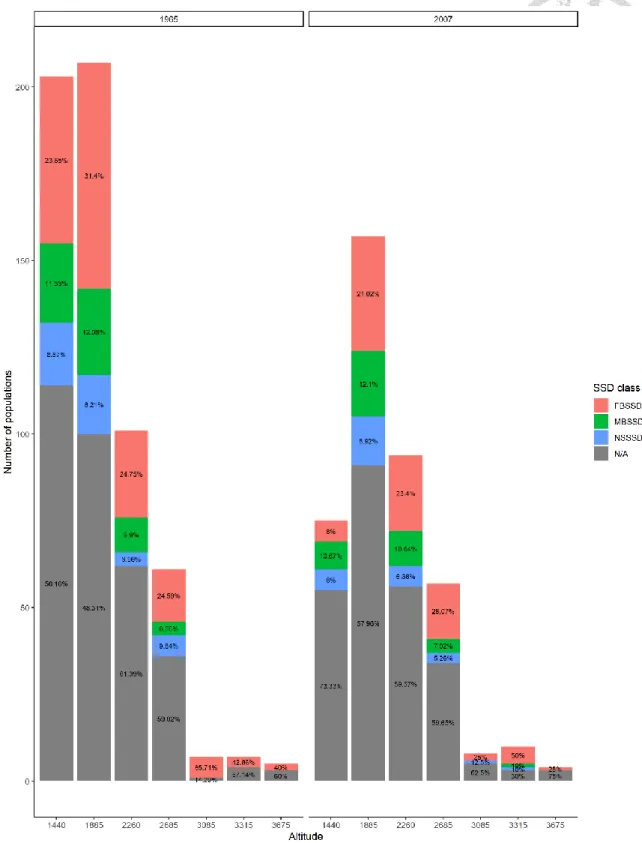
Figure 6. The percentages of each SSD classes (FBSSD, MBSSD, NSSSD, and N/A) at different altitudinal sites for both the year 1965 and 2007 with the number of
assemblages indicated by the Y-axis. The N/As indicate the assemblages with only one female or male.
43
Figure 7. The change of SSDi for each population across years with line colors showing the direction and the magnitude of the SSDi change. The darker purple color indicates a larger increase in SSDi across years, while the darker red color indicates a larger
decrease in SSDi across years. The two dotted horizontal lines mark the threshold, 2%
sexual size difference, for classification of SSD.
Figure 8. The sex difference in CV (ΔCV) for FBSSD assemblages in 2007. The red dot with standard errors represents sex difference in CV estimated by linear mixed model.
The grey points indicate the ΔCV of assemblages in raw data.
45
Figure 9. The sex difference in CV (ΔCV) for MBSSD in 2007. The red dot with standard errors represents sex difference in CV estimated by linear mixed model. The grey points indicate the ΔCV of assemblages in raw data.
![[2015-Fall] WNFA lab1 - CamCom](data:image/gif;base64,R0lGODlhAQABAIAAAP///wAAACH5BAEAAAAALAAAAAABAAEAAAICRAEAOw==)