薪資與生產力統計年報
YEARBOOK OF
EARNINGS AND PRODUCTIVITY STATISTICS REPUBLIC OF CHINA, 2019
資 料 時 期 : 中 華 民 國 108 年
˙ 統計標準:本報告參照「中華民國行業標準分類第 10 次 修訂版」及「 105 年工業及服務業普查統計結 果」校正歷年時間數列資料,相關指數資料改 以 105 年為基期。
˙網 址: https://www.stat.gov.tw >主計總處統計專區
行 政 院 主 計 總 處 中華民國 109 年 5 月編印
DIRECTORATE-GENERAL OF BUDGET, ACCOUNTING AND STATISTICS, EXECUTIVE YUAN, REPUBLIC OF CHINA, MAY 2020
>薪資及生產力統計
刊期頻率:年 報 出版機關:行 政 院 主 計 總 處
地址:臺 北 市 中 正 區 廣 州 街 2 號 電話:( 0 2 ) 2 3 8 0 - 3 6 2 5 0 8 0 0 0 0 7 5 8 9 - 1 5 網址:h t t p s : / / w w w . d g b a s . g o v . t w 印 刷 者: 肯 定 實 業 股 份 有 限 公 司
地址:新北市中和區連城路 160 號後棟 電話:( 0 2 ) 8 2 4 5 - 7 3 5 5 編 者:行 政 院 主 計 總 處 出版年月:中 華 民 國 1 0 9 年 5 月 創刊年月:中 華 民 國 7 7 年 5 月 定 價:新 臺 幣 2 9 0 元 展 售 處:中 國 統 計 學 社
地址:臺 北 市 中 正 區 廣 州 街 2 號 電話:( 0 2 ) 2 3 8 0 - 3 6 5 6 郵 政 劃 撥 帳 號 0 0 0 4 1 3 0 - 8 五 南 文 化 廣 場
地址:臺 中 市 中 區 中 山 路 6 號 電話:( 0 4 ) 2 2 2 6 - 0 3 3 0 五南網路書店:
http://www.wunanbooks.com.tw
國 家 書 店 松 江 門 市地址:臺北市中山區松江路 209 號 1 樓 電話:( 0 2 ) 2 5 1 8 - 0 2 0 7 國家網路書店:
http://www.govbooks.com.tw
本著作採創用CC「姓名標示-非商業性」授權條款臺灣 2.5 版釋出,限 於標示著作人姓名及非營利性目的之條件下,得利用本著作。
GPN: 2007700004
ISSN: 1018-1695
I
目 次
前 言
...(1)
提要分析
...(3)
各業受僱員工薪資調查統計表
薪資與生產力統計重要指數 ... 2
I、受僱員工人數
1. 歷年各業受僱員工人數... 6
2. 歷年製造業受僱員工人數... 14
3. 工業及服務業受僱員工人數-按部門別分... 26
4. 礦業及土石採取業受僱員工人數-按中業別分... 26
5. 製造業受僱員工人數-按中業別分... 27
6. 電力及燃氣供應業受僱員工人數-按中業別分... 30
7. 用水供應及污染整治業受僱員工人數-按中業別分... 30
8. 營建工程業受僱員工人數-按中業別分... 31
9. 批發及零售業受僱員工人數-按中業別分... 31
10. 運輸及倉儲業受僱員工人數-按中業別分... 32
11. 住宿及餐飲業受僱員工人數-按中業別分... 33
12. 出版、影音製作、傳播及資通訊服務業受僱員工人數-按中業別分... 33
13. 金融及保險業、不動產業受僱員工人數-按中業別分... 34
14. 專業、科學及技術服務業受僱員工人數-按中業別分... 35
15. 支援服務業、教育業受僱員工人數-按中業別分... 36
16. 醫療保健業、藝術娛樂及休閒服務業受僱員工人數-按中業別分... 37
17. 其他服務業受僱員工人數-按中業別分... 37
II、薪資
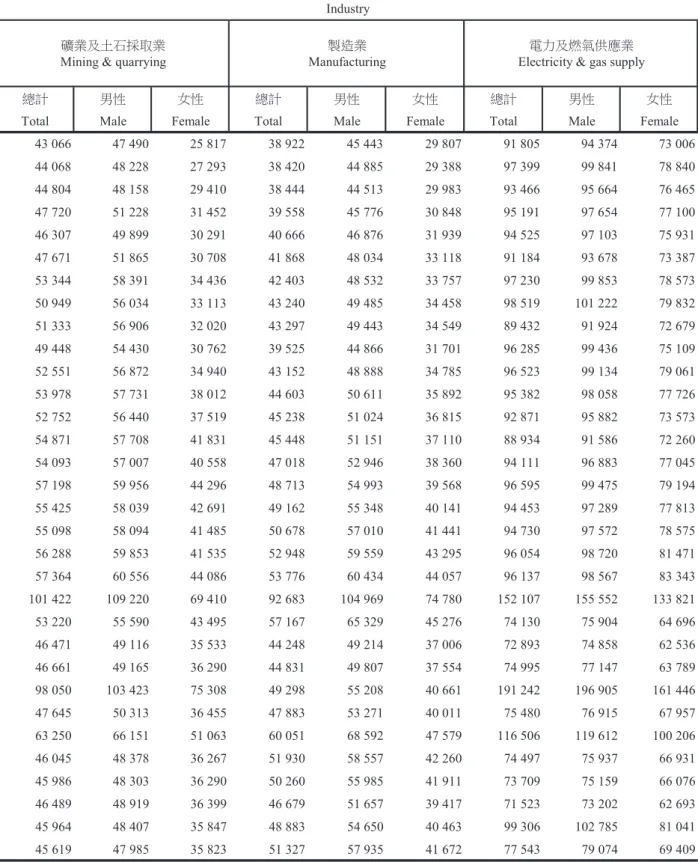
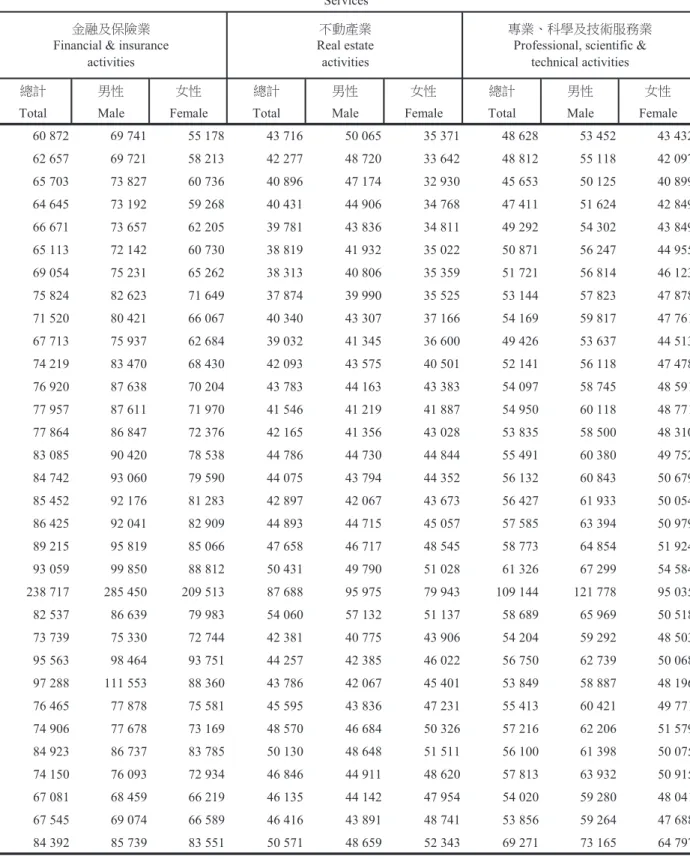
18. 歷年各業受僱員工每人每月總薪資... 38
19. 歷年各業受僱員工每人每月經常性薪資... 46
20. 歷年製造業受僱員工每人每月總薪資... 54
21. 工業及服務業受僱員工每人每月薪資-按部門別分... 66
22. 礦業及土石採取業受僱員工每人每月薪資-按中業別分... 66
23. 製造業受僱員工每人每月薪資-按中業別分... 67
24. 電力及燃氣供應業受僱員工每人每月薪資-按中業別分... 70
II
25. 用水供應及污染整治業受僱員工每人每月薪資-按中業別分... 70
26. 營建工程業受僱員工每人每月薪資-按中業別分... 71
27. 批發及零售業受僱員工每人每月薪資-按中業別分... 71
28. 運輸及倉儲業受僱員工每人每月薪資-按中業別分... 72
29. 住宿及餐飲業受僱員工每人每月薪資-按中業別分... 73
30. 出版、影音製作、傳播及資通訊服務業受僱員工每人每月薪資-按中業別分... 73
31. 金融及保險業、不動產業受僱員工每人每月薪資-按中業別分... 74
32. 專業、科學及技術服務業受僱員工每人每月薪資-按中業別分... 75
33. 支援服務業、教育業受僱員工每人每月薪資-按中業別分... 76
34. 醫療保健業、藝術娛樂及休閒服務業受僱員工每人每月薪資-按中業別分... 77
35. 其他服務業受僱員工每人每月薪資-按中業別分... 77
III、工時
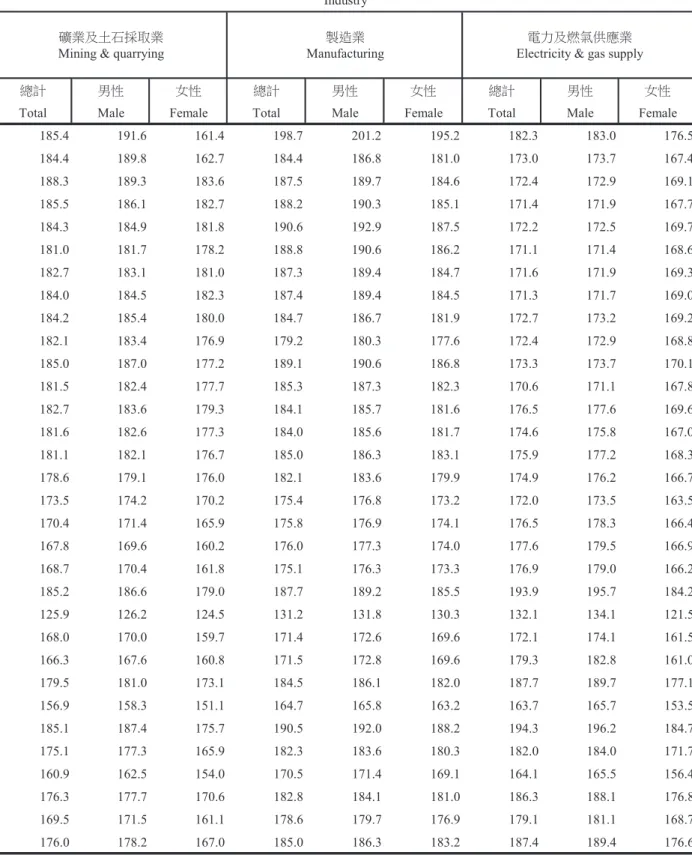
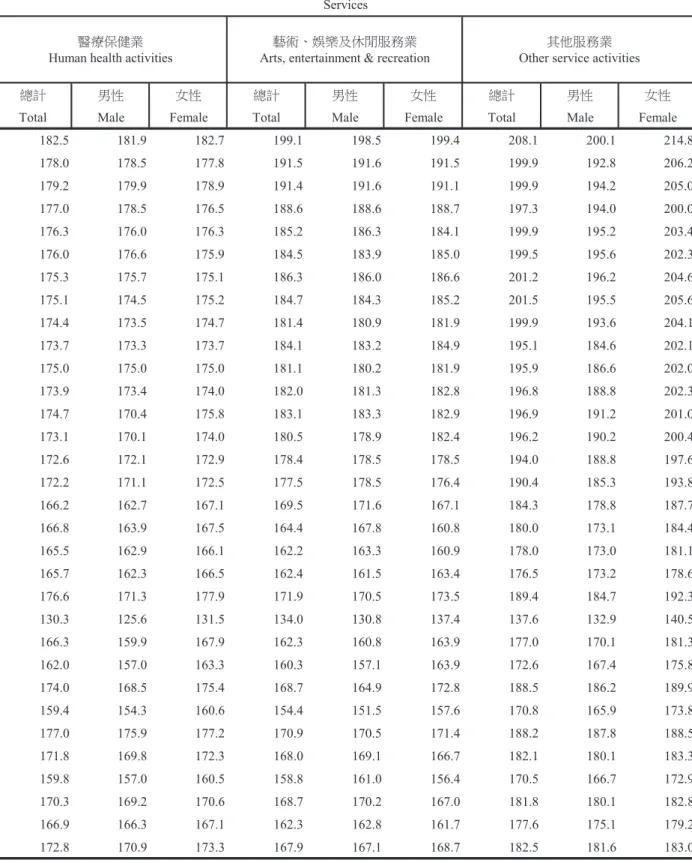
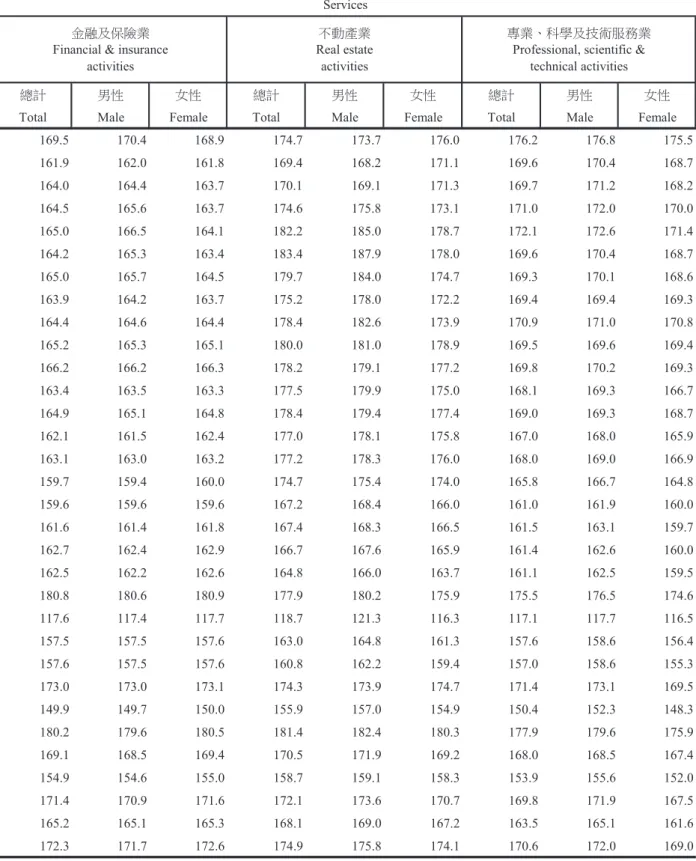
36. 歷年各業受僱員工每人每月工作時數-總工時 ... 78
36. 歷年各業受僱員工每人每月工作時數-正常工時... 86
36. 歷年各業受僱員工每人每月工作時數-加班工時... 94
37. 歷年製造業受僱員工每人每月工作時數-總工時... 102
37. 歷年製造業受僱員工每人每月工作時數-正常工時... 114
37. 歷年製造業受僱員工每人每月工作時數-加班工時... 126
38. 工業及服務業受僱員工每人每月工作時數-按部門別分... 138
39. 礦業及土石採取業受僱員工每人每月工作時數-按中業別分... 138
40. 製造業受僱員工每人每月工作時數-按中業別分... 139
41. 電力及燃氣供應業受僱員工每人每月工作時數-按中業別分... 142
42. 用水供應及污染整治業受僱員工每人每月工作時數-按中業別分... 142
43. 營建工程業受僱員工每人每月工作時數-按中業別分... 143
44. 批發及零售業受僱員工每人每月工作時數-按中業別分... 143
45. 運輸及倉儲業受僱員工每人每月工作時數-按中業別分... 144
46. 住宿及餐飲業受僱員工每人每月工作時數-按中業別分... 145
47. 出版、影音製作、傳播及資通訊服務業受僱員工每人每月工作時數-按中業別分.... 145
48. 金融及保險業、不動產業受僱員工每人每月工作時數-按中業別分... 146
49. 專業、科學及技術服務業受僱員工每人每月工作時數-按中業別分... 147
50. 支援服務業、教育業受僱員工每人每月工作時數-按中業別分... 148
51. 醫療保健業、藝術娛樂及休閒服務業受僱員工每人每月工作時數-按中業別分... 149
52. 其他服務業受僱員工每人每月工作時數-按中業別分... 149
III
IV、員工進退
53. 歷年各業受僱員工進退率及流動率... 150
54. 歷年製造業受僱員工進退率及流動率... 156
55. 各業受僱員工進退率-按中業別分... 168
V、勞動生產力
56. 歷年工業部門受僱者勞動生產力指數... 176
57. 歷年工業部門受僱者單位產出勞動成本指數... 177
58. 歷年製造業受僱者勞動生產力指數... 178
59. 歷年製造業受僱者單位產出勞動成本指數... 184
VI、季節調整資料
60. 歷年各業受僱員工人數季節調整結果... 190
61. 歷年各業受僱員工每人每月總薪資季節調整結果... 194
62. 歷年各業受僱員工每人每月總工時季節調整結果... 198
63. 歷年各業受僱員工進退率季節調整結果... 202
VII、國際統計
64. 主要國家工業及服務業每月、時薪... 208
65. 主要國家製造業受僱指數... 209
66. 主要國家製造業每週工作時數... 210
67. 主要國家製造業薪資... 212
68. 主要國家製造業勞動生產力指數... 214
性別統計分析
... 216
附錄
... 230
IV
CONTENTS
Preface
……… (2)Summary Analysis
... (9)Statistical Tables
Indexes of Earnings and Productivity Statistics... 2
I. Employees
1. Employees on Payrolls of Establishments by Industry ……... 6 2. Employees on Payrolls of Manufacturing Establishments ... 14 3. Employees on Payrolls of Industry & Services Establishments by Sector
Industry... 26 4. Employees on Payrolls of Mining & Quarrying Establishments by Division
Industry... 26 5. Employees on Payrolls of Manufacturing Establishments by Division Industry... 27 6. Employees on Payrolls of Electricity & Gas Supply Establishments by Division
Industry... 30 7. Employees on Payrolls of Water Supply & Remediation Activities Establishments
by Division Industry... 30 8. Employees on Payrolls of Construction Establishments by Division Industry... 31 9. Employees on Payrolls of Wholesale & Retail Trade Establishments by Division
Industry... 31 10. Employees on Payrolls of Transportation & Storage Establishments by Division
Industry... 32 11. Employees on Payrolls of Accommodation & Food Service Activities Establishments
by Division Industry... 33 12. Employees on Payrolls of Information & Communication Establishments by
Division Industry... 33 13. Employees on Payrolls of Financial & Insurance Activities, Real Estate Activities
Establishments by Division Industry... 34 14. Employees on Payrolls of Professional, Scientific & Technical Activities
Establishments by Division Industry... 35 15. Employees on Payrolls of Support Service Activities, Education Establishments by
Division Industry... 36
V
16. Employees on Payrolls of Human Health Activities, Arts, Entertainment &
Recreation Establishments by Division Industry... 37 17. Employees on Payrolls of Other Service Activities Establishments by Division
Industry... 37
II. Earnings
18. Average Monthly Total Earnings per Employee on Payrolls of Establishments by Industry ... 38 19. Average Monthly Regular Earnings per Employee on Payrolls of Establishments
by Industry... 46 20. Average Monthly Total Earnings per Employee on Payrolls of Manufacturing
Establishments by Industry... 54 21. Average Monthly Earnings per Employee on Payrolls of Industry & Services
Establishments by Sector Industry...66 22. Average Monthly Earnings per Employee on Payrolls of Mining & Quarrying
Establishments by Division Industry... 66 23. Average Monthly Earnings per Employee on Payrolls of Manufacturing
Establishments by Division Industry... 67 24. Average Monthly Earnings per Employee on Payrolls of Electricity & Gas
Supply Establishments by Division Industry... 70 25. Average Monthly Earnings per Employee on Payrolls of Water Supply &
Remediation Activities Establishments by Division Industry... 70 26. Average Monthly Earnings per Employee on Payrolls of Construction
Establishments by Division Industry... 71 27. Average Monthly Earnings per Employee on Payrolls of Wholesale & Retail Trade
Establishments by Division Industry... 71 28. Average Monthly Earnings per Employee on Payrolls of Transportation & Storage
Establishments by Division Industry...72 29. Average Monthly Earnings per Employee on Payrolls of Accommodation & Food
Service Activities Establishments by Division Industry... 73 30. Average Monthly Earnings per Employee on Payrolls of Information &
Communication Establishments by Division Industry... 73 31. Average Monthly Earnings per Employee on Payrolls of Financial & Insurance
Activities, Real Estate Activities Establishments by Division Industry... 74
VI
32. Average Monthly Earnings per Employee on Payrolls of Professional, Scientific &
Technical Activities Establishments by Division Industry... 75 33. Average Monthly Earnings per Employee on Payrolls of Support Service Activities,
Education Establishments by Division Industry... 76 34. Average Monthly Earnings per Employee on Payrolls of Human Health Activities,
Arts, Entertainment & Recreation Establishments by Division Industry... 77 35. Average Monthly Earnings per Employee on Payrolls of Other Service Activities
Establishments by Division Industry... 77
III. Working Hours
36. Average Monthly Working Hours per Employee on Payrolls of Establishments by Industry - Total Working Hours... 78 36. Average Monthly Working Hours per Employee on Payrolls of Establishments by
Industry - Regular Working Hours... 86 36. Average Monthly Working Hours per Employee on Payrolls of Establishments by
Industry - Overtime... 94 37. Average Monthly Working Hours per Employee on Payrolls of Manufacturing
Establishments by Industry - Total Working Hours... 102 37. Average Monthly Working Hours per Employee on Payrolls of Manufacturing
Establishments by Industry - Regular Working Hours... 114 37. Average Monthly Working Hours per Employee on Payrolls of Manufacturing
Establishments by Industry - Overtime... 126 38. Average Monthly Working Hours per Employee on Payrolls of Industry & Services
Establishments by Sector Industry...138 39. Average Monthly Working Hours per Employee on Payrolls of Mining &
Quarrying Establishments by Division Industry... 138 40. Average Monthly Working Hours per Employee on Payrolls of Manufacturing
Establishments by Division Industry ... 139 41. Average Monthly Working Hours per Employee on Payrolls of Electricity & Gas
Supply Establishments by Division Industry... 142 42. Average Monthly Working Hours per Employee on Payrolls of Water Supply &
Remediation Activities Establishments by Division Industry... 142 43. Average Monthly Working Hours per Employee on Payrolls of Construction
Establishments by Division Industry... 143
VII
44. Average Monthly Working Hours per Employee on Payrolls of Wholesale & Retail
Trade Establishments by Division Industry... 143
45. Average Monthly Working Hours per Employee on Payrolls of Transportation & Storage Establishments by Division Industry... 144
46. Average Monthly Working Hours per Employee on Payrolls of Accommodation & Food Service Activities Establishments by Division Industry... 145
47. Average Monthly Working Hours per Employee on Payrolls of Information & Communication Establishments by Division Industry... 145
48. Average Monthly Working Hours per Employee on Payrolls of Financial & Insurance Activities, Real Estate Activities Establishments by Division Industry... 146
49. Average Monthly Working Hours per Employee on Payrolls of Professional, Scientific & Technical Activities Establishments by Division Industry... 147
50. Average Monthly Working Hours per Employee on Payrolls of Support Service Activities, Education Establishments by Division Industry... 148
51. Average Monthly Working Hours per Employee on Payrolls of Human Health Activities, Arts, Entertainment & Recreation Establishments by Division Industry.... 149
52. Average Monthly Working Hours per Employee on Payrolls of Other Service Activities Establishments by Division Industry...149
IV. Labor Turnover
53. Labor Turnover Rates of Employees on Payrolls of Establishments by Industry... 15054. Labor Turnover Rates of Employees on Payrolls of Manufacturing Establishments by Industry... 156
55. Labor Turnover Rates of Employees on Payrolls of Establishments by Division Industry... 168
V. Labor Productivity
56. Indexes of Labor Productivity of Employees of Industry Establishments... 17657. Indexes of Unit Labor Costs of Employees of Industry Establishments... 177
58. Indexes of Labor Productivity of Employees of Manufacturing Establishments... 178
59. Indexes of Unit Labor Costs of Employees of Manufacturing Establishments... 184
VIII
VI. Seasonally Adjusted Series
60. Seasonally Adjusted Series of Employees on Payrolls of Establishments by
Industry... 190
61. Seasonally Adjusted Series of Average Monthly Total Earnings per Employee on Payrolls of Establishments by Industry... 194
62. Seasonally Adjusted Series of Average Monthly Total Working Hours per Employee on Payrolls of Establishments by Industry... 198
63. Seasonally Adjusted Series of Labor Turnover Rates of Employees on Payrolls of Establishments by Industry... 202
VII. International Statistics
64. Earnings per Hour (H) or per Month (M) in Industry and Services in Major Countries... 20865. Fixed Indexes of Employment in Manufacturing in Major Countries... 209
66. Working Hours per Week in Manufacturing in Major Countries... 210
67. Earnings in Manufacturing in Major Countries...212
68. Indexes of Labor Productivity in Manufacturing in Major Countries... 214
Gender Statistics
and Analysis... 222Appendix
... 241前 言
一、年報資料來源:係由本總處按月蒐集工業及服務業場所僱用員工人數、薪資水 準、工作時數及員工進退等變動狀況,並綜合編製生產力變動情形,以及廠商 勞動成本之增減情況。
二、年報編印目的:根據上項資料,加以編製與分析,以供下列之用途。
(一)各行業人力需求情況:藉供政府規劃人力資源,估測經濟發展,釐訂人力政 策之需要。
(二)員工薪資水準變動情勢:研究調節人力供需市場,改善員工待遇及員工生活 之參據。
(三)生產力消長趨勢:供為衡量產業對外競爭能力,改變產業結構與提升營運效 率之依據。
三、年報統計範圍:包含礦業及土石採取業、製造業、電力及燃氣供應業、用水供 應及污染整治業、營建工程業、批發及零售業、運輸及倉儲業、住宿及餐飲 業、出版影音製作傳播及資通訊服務業、金融及保險業、不動產業、專業科學 及技術服務業、支援服務業、教育業(僅含教育輔助及其他教育業)、醫療保 健業、藝術娛樂及休閒服務業、其他服務業等 17 大行業。其原始資料,係分 由各有關主管機關負責查報,再由本總處綜合加以審核、複查、電子處理、彙 編製表、研究分析等過程,編印成本年報。
四、年報名稱修訂:自中華民國 77 年起,比照月報名稱,將原編「中華民國勞工 統計年報」依其內容分別編印為「薪資與生產力統計年報」及「人力資源調查 統計年報」兩種,並改以資料主體年份為上述兩種年報之年別名稱。
五、資料編排體例:
(一)本年報資料以中華民國 108 年為主,為便於時間數列之連續,數字盡量保留 至中華民國 89 年,其中新編統計項目亦盡可能依據有關資料設法銜接追溯 估列。
(二)統計表之排列,先依主要受僱員工統計項目分類為 I、II、III 等,各類中以 同一統計、調查產生之資料集結排列為原則。
(三)提要分析說明置於卷首,各項統計或調查說明,按統計項目次序集中輯印,
編製方法說明附於卷末。
(四)統計表所用符號意義如下:
0 表示數值不及半單位 ... 表示數值尚未發布 - 表示無數值或數值無統計
Preface
1. The source data of the Yearbook: From researching the changes in employees, earnings level, working hours and labor turnover of employees hired by Industry & Services. Combined with productivity statistics series and fluctuations in labor cost of firms.
2. The purpose of the Yearbook:
(1) Industrial manpower demand: Statistics in the Yearbook are important reference for the government in its planning manpower policies.
(2) Earnings level of employees: Statistics on earnings of employees are essential reference data in studying and adjusting manpower market demand and supply, raising earnings of employees, and improving their living conditions.
(3) Fluctuations of productivity: Productivity is a base to measure industrial competitive strength against trading rivals, change industrial structure, and upgrade operational efficiency.
3. The coverage of the Yearbook: The statistics cover 17 major industries: Mining & quarrying, Manufacturing, Electricity & gas supply, Water supply & remediation activities, Construction, Wholesale & retail trade, Transportation & storage, Accommodation & food service activities, Information & communication, Financial & insurance activities, Real estate activities, Professional, scientific & technical activities, Support service activities, Education (only Educational support activities and other education included), Human health activities, Arts, entertainment & recreation and Other service activities. The primary survey of industries is managed by various statistic organizations, and finally compiled by the Directorate-General of Budget, Accounting and Statistics (DGBAS), Executive Yuan. All the data are put through a tight procedure of close review, recheck, and electronic computer data processing and are turned into statistical tables for research and analysis. Results are prepared into this Yearbook to be published.
4. The revised name of the Yearbook: Following the Monthly Bulletin from 1988, the YEARBOOK OF
LABOR STATISTICS is separated into YEARBOOK OF EARNINGS AND PRODUCTIVITY STATISTICS and YEARBOOK OF MANPOWER SURVEY STATISTICS in accordance with theircontents. The year of the main part of data is the year title of these two Yearbooks.
5. The compilation of the Yearbook:
(1) The data mainly contain the statistics in 2019 and for the continuation of time series the figures can be traced as far as back to 2000 while the data of the new items are being revealed precisely in accordance with the estimated past data.
(2) The statistical tables, based on the employees statistics items, are classified into I, II, III, and so on, and in which they are arranged by the principle that the data derive from the same statistics or from the same survey as a group.
(3) The summary analysis is arranged above the order of each item. The directions of statistics or surveys are arranged under the order of each item, which are listed at the end of this Yearbook.
(4) The following symbols are used for tables:
0 less than a half unit ... not yet published
- zero or not available
提 要 分 析
一、受僱員工人數
▲工業及服務業受僱員工人數較上年增加9萬人或1.14%。
108年受景氣溫和成長,員工需求持續增加,工業及服務業受僱員工人數平
均為796萬7千人,較上(107)年增加9萬人或1.14%;就行業結構觀察,工業部門
受僱人數占42.60%,服務業部門占57.40%。
工業部門全年受僱員工人數為339萬4千人,較上年增加1萬8千人或0.52%,
其中以製造業增加1萬人最多;服務業部門亦較上年增加7萬3千人或1.61%,達 457萬3千人,其中以批發及零售業增加1萬6千人、醫療保健業增加1萬3千人、住
宿及餐飲業增加1萬1千人較多。
製造業受僱員工人數平均為285萬5千人,較上年增加1萬人或0.34%,其中以
電腦、電子產品及光學製品製造業增加5千人居首,食品及飼品製造業增加4千人
次之,金屬製品製造業增加2千人居第三;另電子零組件製造業、紡織業則各減
少4千人較為顯著。
表
1 各行業受僱員工人數
單位:千人 104年 105年 106年 107年 108年 較上年
增減(%)
總計 7 532 7 637 7 769 7 877 7 967 1.14
工業 3 279 3 294 3 337 3 376 3 394 0.52
礦業及土石採取業
4 4 4 3 3 -0.83
製造業
2 753 2 768 2 810 2 845 2 855 0.34
電力及燃氣供應業
30 31 31 32 32 1.92
用水供應及污染整治業30 31 32 33 34 1.46
營建工程業461 461 461 463 470 1.51
服務業 4 253 4 343 4 432 4 500 4 573 1.61
批發及零售業
1 630 1 642 1 666 1 689 1 705 0.96
運輸及倉儲業290 296 299 301 303 0.61
住宿及餐飲業431 458 481 492 503 2.30
出版、影音製作、傳播及資通訊服務業211 219 224 228 233 2.07
金融及保險業378 381 386 387 390 0.63
不動產業114 114 114 115 119 3.84
專業、科學及技術服務業257 263 266 271 277 2.22
支援服務業370 379 388 394 404 2.50
教育業(不含各級公私立學校等,註)70 69 70 71 72 1.86
醫療保健業336 345 357 368 381 3.59
藝術、娛樂及休閒服務業63 67 69 70 71 0.54
其他服務業104 110 114 113 114 0.70
註:教育業不含各級公私立學校等,僅涵蓋「教育輔助及其他教育業」,如各類補習班、才藝班、汽車駕駛訓練班及代辦 留(遊)學服務等。
▲工業及服務業全體受僱員工每人每月總薪資較上年增加2.39%。
108年工業及服務業全體受僱員工每人每月總薪資平均為53,657元,較上年 增加2.39%,其中每月經常性薪資41,883元,年增2.01%,非經常性薪資11,774 元,年增2.85%;本國籍全時受僱員工每人每月總薪資平均為56,640元,較上年增 加2.58%。
工業部門每人每月總薪資平均為52,865元,較上年增加1.65%,各行業均較
上年增加,其中以營建工程業增加2.72%最多,礦業及土石採取業增加1.91%次
之,製造業增加1.56%再次。
服務業部門每人每月總薪資平均為54,245元,較上年增加2.92%,各行業較
上年亦均呈增加,其中以不動產業增加5.82%最多,專業、科學及技術服務業增
加4.34%次之,金融及保險業增加4.31%再次。
表
2 各行業受僱員工每人每月總薪資
單位:新臺幣元 104年 105年 106年 107年 108年 較上年
增減(%)
本國籍全時受僱員工
- - - 55 215 56 640 2. 58總計
(全體受僱員工) 49 024 49 266 50 480 52 407 53 657 2. 39工業
48 373 48 654 49 907 52 005 52 865 1. 65礦業及土石採取業 57 198 55 425 55 098 56 288 57 364 1. 91
製造業 48 713 49 162 50 678 52 948 53 776 1. 56
電力及燃氣供應業 96 595 94 453 94 730 96 054 96 137 0. 09 用水供應及污染整治業 44 357 43 216 44 286 45 319 45 830 1. 13 營建工程業 43 346 42 839 42 506 43 645 44 833 2. 72
服務業
49 526 49 730 50 912 52 708 54 245 2. 92批發及零售業 45 422 45 345 47 260 49 798 51 328 3. 07 運輸及倉儲業 51 579 52 540 53 314 54 994 55 588 1. 08 住宿及餐飲業 32 508 32 498 33 406 34 077 34 686 1. 79 出版、影音製作、傳播及資通訊服務業 66 595 67 749 69 196 69 909 72 144 3. 20 金融及保險業 84 742 85 452 86 425 89 215 93 059 4. 31 不動產業 44 075 42 897 44 893 47 658 50 431 5. 82 專業、科學及技術服務業 56 132 56 427 57 585 58 773 61 326 4. 34 支援服務業 35 451 35 855 36 178 37 133 37 616 1. 30 教育業(不含各級公私立學校等,註) 24 304 24 876 25 288 26 033 26 972 3. 61 醫療保健業 64 100 65 236 65 681 67 014 68 517 2. 24 藝術、娛樂及休閒服務業 36 184 36 821 37 535 38 742 39 520 2. 01 其他服務業 33 901 33 497 33 860 34 966 35 594 1. 80 註:同表1。
▲受僱員工每人每月總工時平均較上年減少0.4小時。
108年工業及服務業受僱員工每人每月總工時平均為169.0小時,較上年減少 0.4小時。工業部門總工時平均較上年減少0.6小時,為173.9小時,其中以製造業
減少0.9小時最多;服務業部門與上年持平,為165.5小時,其中以教育業、其他
服務業各減少1.5小時最多,不動產業減少1.4小時次之。
就各中行業觀察,總工時平均較長之前10名行業,依序為保全及偵探業
(219.9小時)、公共汽車客運業(199.4小時)、美髮及美容美體業(183.6小時)、
紡織業(182.0小時)、橡膠製品製造業(181.6小時)、電子零組件製造業(180.9
小時)、電力供應業(178.8小時)、木竹製品製造業(178.6小時)、基本金屬製
造業(178.3小時)、飲料及菸草製造業(178.0小時)。
若就僱用型態觀察,108年全時受僱員工每人每月總工時為172.3小時,以支 援服務業之186.3小時最高,其他服務業177.9小時次之,教育業152.9小時為最 低;部分工時受僱員工每人每月總工時為103.0小時,人數較多之批發及零售業、
住宿及餐飲業分別為119.8小時及115.4小時。
表
3 各行業受僱員工每人每月總工時
單位:小時
104年 105年 106年 107年 108年 較上年增減 (小時)
按受僱型態分 全時 員工
部分 工時 員工
總計
175.3 169.6 169.6 169.4 169.0 -0.4 172.3 103.0工業
180.6 173.9 174.2 174.5 173.9 -0.6 175.5 82.2礦業及土石採取業 178.6 173.5 170.4 167.8 168.7 0.9 169.5 73.4
製造業 182.1 175.4 175.8 176.0 175.1 -0.9 176.8 81.5
電力及燃氣供應業 174.9 172.0 176.5 177.6 176.9 -0.7 176.9 106.7 用水供應及污染整治業 176.1 169.0 167.8 167.6 167.8 0.2 169.1 79.8 營建工程業 172.2 166.3 165.3 166.0 166.6 0.6 168.0 86.6
服務業
171.3 166.3 166.1 165.5 165.5 0.0 169.8 107.1批發及零售業 170.9 164.6 164.7 164.3 164.1 -0.2 167.3 119.8 運輸及倉儲業 178.1 172.4 172.1 173.4 173.3 -0.1 175.6 105.9 住宿及餐飲業 167.2 163.6 160.4 158.3 158.6 0.3 169.3 115.4 出版、影音製作、傳播及資通訊服務業 165.1 161.1 162.7 161.7 161.4 -0.3 164.1 80.3 金融及保險業 162.3 162.8 164.6 166.0 165.8 -0.2 166.4 77.2 不動產業 177.2 168.7 169.1 169.1 167.7 -1.4 169.2 80.3 專業、科學及技術服務業 170.4 165.3 165.2 165.3 165.4 0.1 167.4 84.9 支援服務業 185.0 179.8 179.2 178.6 178.4 -0.2 186.3 94.5 教育業(不含各級公私立學校等,註) 132.8 132.7 132.0 131.4 129.9 -1.5 152.9 55.9
醫療保健業
172.2 166.2 166.8 165.5 165.7 0.2 168.6 82.4藝術、娛樂及休閒服務業 177.5 169.5 164.4 162.2 162.4 0.2 169.3 85.6 其他服務業 190.4 184.3 180.0 178.0 176.5 -1.5 177.9 85.8 註:同表1。
▲受僱員工進入率平均為2.34%,高於退出率2.25%。
108年工業及服務業受僱員工進入率平均為2.34%,退出率平均為2.25%,淨 進入率(進入率減退出率)平均為0.09%。全年受僱員工流動率[(進入率+退出
率)/2]平均為2.30%,較上年之2.32%減少0.02個百分點。
工業部門淨進入率為0.02%,其中以電力及燃氣供應業之0.24%較高,用水
供應及污染整治業之0.21%居次;服務業部門淨進入率為0.15%,各大行業皆呈淨
進入,其中以不動產業之0.38%最高,醫療保健業0.34%次之。
就各行業觀察,進入率以支援服務業之4.72%居首,住宿及餐飲業之4.25%
次之,藝術、娛樂及休閒服務業之3.51%居第三,並以電力及燃氣供應業之0.85%
居末;退出率亦以支援服務業之4.60%居首,住宿及餐飲業之4.04%次之,藝術、
娛樂及休閒服務業之3.42%居第三,仍以電力及燃氣供應業之0.61%最低。
表
4 各行業受僱員工進退率
單位:%
104年 105年 106年 107年 108年
進入
率 退出率 進入率 退出率 進入率 退出率 進入率 退出率 進入率 退出率 淨 進入率
總計
2.36 2.22 2.29 2.17 2.35 2.20 2.37 2.26 2.34 2.25 0.09工業
2.06 2.01 2.01 1.93 2.05 1.93 2.03 1.95 1.96 1.94 0.02礦業及土石採取業 0.98 1.15 1.07 1.21 1.44 1.79 1.33 1.33 1.24 1.35 -0.11 製造業 1.99 1.94 1.96 1.87 2.01 1.87 1.98 1.89 1.91 1.91 0.00 電力及燃氣供應業 0.86 0.51 0.72 0.52 0.55 0.56 0.65 0.52 0.85 0.61 0.24 用水供應及污染整治業 1.74 1.48 1.56 1.26 1.61 1.58 1.84 1.55 1.72 1.51 0.21 營建工程業 2.61 2.58 2.43 2.47 2.44 2.41 2.45 2.42 2.38 2.23 0.15
服務業
2.59 2.38 2.50 2.34 2.58 2.40 2.62 2.50 2.62 2.47 0.15 批發及零售業 2.39 2.29 2.38 2.32 2.47 2.31 2.48 2.39 2.41 2.34 0.07 運輸及倉儲業 2.10 1.88 1.83 1.73 1.76 1.66 1.64 1.56 1.55 1.52 0.03 住宿及餐飲業 4.60 4.04 4.24 3.79 4.28 3.92 4.29 4.20 4.25 4.04 0.21 出版、影音製作、傳播及資通訊服務業 2.20 1.75 1.95 1.64 1.91 1.77 1.92 1.83 2.17 1.90 0.27 金融及保險業 1.45 1.32 1.41 1.35 1.44 1.35 1.35 1.33 1.30 1.19 0.11 不動產業 2.97 2.99 2.24 2.27 2.13 2.02 2.40 2.30 2.53 2.15 0.38 專業、科學及技術服務業 1.99 1.80 1.95 1.74 2.00 1.90 2.32 2.14 2.41 2.22 0.19 支援服務業 4.22 3.99 4.18 4.03 4.57 4.40 4.68 4.47 4.72 4.60 0.12 教育業(不含各級公私立學校等,註) 2.21 2.23 2.25 2.35 2.85 2.67 3.18 3.05 3.11 2.91 0.20 醫療保健業 1.51 1.30 1.58 1.34 1.63 1.35 1.65 1.38 1.79 1.45 0.34 藝術、娛樂及休閒服務業 3.87 3.39 3.54 3.11 3.31 3.16 3.44 3.30 3.51 3.42 0.09 其他服務業 2.00 1.57 1.99 1.46 1.57 1.48 1.78 1.77 1.76 1.69 0.07 註:同表1。▲工業(不含營建工程業、污染整治業)勞動生產力指數較上年下降0.06%。
108年工業部門(不含營建工程業、污染整治業)勞動生產力指數為105.31
(105年=100),因工業生產(不含營建工程業、污染整治業)指數較上年減少
0.34%,而總投入工時較上年減少0.29%,致勞動生產力指數較上年下降0.06%,
其中以礦業及土石採取業下降4.74%最為顯著,製造業亦下降0.15%次之,另用水
供應業、電力及燃氣供應業則分別上升0.76%、0.40%。
108年工業生產因中美貿易戰影響,除電腦、電子與光學設備等轉單效應致 需求增加外,機械、金屬、印刷及資料儲存媒體複製、木竹製品等生產需求皆較
去年減少,全年製造業生產指數較上年減少0.44%,而總投入工時較上年減少
0.29%,致製造業勞動生產力指數為105.81(105年=100),較上年下降0.15%。
各中行業勞動生產力指數較上年下降者,以機械設備製造業下降12.36%最多,印
刷及資料儲存媒體複製業下降8.62%次之,基本金屬製造業下降8.58%再次;勞動
生產力指數較上年上升者,以電腦、電子產品及光學製品製造業升25.70%最高,
其他運輸工具及其零件製造業升6.96%次之。
表
5 工業(不含營建工程業、污染整治業)受僱者勞動生產力指數
基期:民國105年=100 104年 105年 106年 107年 108年 較上年
增減(%)
工業
94.96 100.00 103.25 105.37 105.31 -0.06礦業及土石採取業
104.00 100.00 102.90 103.55 98.64 -4.74電力及燃氣供應業
96.79 100.00 98.40 96.52 96.91 0.40用水供應業
97.71 100.00 100.02 95.09 95.81 0.76製造業
95.00 100.00 103.53 105.97 105.81 -0.15食品及飼品製造業 97.04 100.00 97.56 95.67 97.92 2.35 飲料及菸草製造業 94.12 100.00 105.45 101.19 98.54 -2.62
紡織業 100.72 100.00 97.69 96.12 94.80 -1.37
成衣及服飾品製造業 100.29 100.00 92.00 81.13 81.22 0.11 皮革、毛皮及其製品製造業 110.42 100.00 109.97 106.22 105.12 -1.04 木竹製品製造業 94.96 100.00 104.75 109.21 100.68 -7.81 紙漿、紙及紙製品製造業 93.32 100.00 100.17 101.39 100.46 -0.92 印刷及資料儲存媒體複製業 95.01 100.00 94.87 96.27 87.97 -8.62 石油及煤製品製造業 95.87 100.00 94.85 97.58 94.61 -3.04 化學原材料、肥料、氮化合物、塑橡
膠原料及人造纖維製造業 97.93 100.00 102.43 99.08 94.02 -5.11 其他化學製品製造業 100.74 100.00 104.86 104.75 105.13 0.36 藥品及醫用化學製品製造業 94.64 100.00 96.82 95.44 99.69 4.45 橡膠製品製造業 104.80 100.00 99.83 95.06 98.08 3.18 塑膠製品製造業 99.59 100.00 100.13 101.76 98.58 -3.13 非金屬礦物製品製造業 103.27 100.00 99.15 102.32 98.04 -4.18 基本金屬製造業 93.82 100.00 101.77 103.08 94.24 -8.58 金屬製品製造業 96.70 100.00 99.57 98.50 93.33 -5.25 電子零組件製造業 92.86 100.00 105.19 108.40 110.32 1.77 電腦、電子產品及光學製品製造業 99.27 100.00 102.42 114.35 143.74 25.70 電力設備及配備製造業 93.47 100.00 97.07 97.75 92.90 -4.96 機械設備製造業 103.20 100.00 107.03 112.74 98.81 -12.36 汽車及其零件製造業 100.14 100.00 97.30 91.57 92.83 1.38 其他運輸工具及其零件製造業 103.28 100.00 104.44 102.70 109.85 6.96 家具製造業 96.94 100.00 102.42 101.63 97.71 -3.86 其他製造業 93.87 100.00 110.29 121.12 123.08 1.62 產業用機械設備維修及安裝業 89.05 100.00 113.01 117.98 114.74 -2.75
▲工業(不含營建工程業、污染整治業)單位產出勞動成本指數較上年上升0.87%。
108年工業部門(不含營建工程業、污染整治業)單位產出勞動成本指數為 103.84(105年=100),較上年上升0.87%,其中以礦業及土石採取業較上年上升 5.63%最多,用水供應業上升1.34%次之。
製造業單位產出勞動成本指數為103.53(105年=100),因全年製造業生產 指數較上年減少0.44%,而受僱者總薪資成本增加0.50%,致製造業單位產出勞動 成本指數較上年上升0.95%。各中行業中以機械設備製造業上升16.29%最為顯
著,基本金屬製造業上升11.22%次之;而電腦、電子產品及光學製品製造業下降
18.95%最多。
表6 工業(不含營建工程業、污染整治業)受僱者單位產出勞動成本指數
基期:民國105年=100 104年 105年 106年 107年 108年 較上年
增減(%)
工業
100.55 100.00 99.54 102.94 103.84 0.87礦業及土石採取業
96.39 100.00 98.36 102.17 107.92 5.63電力及燃氣供應業
103.94 100.00 99.32 101.75 102.13 0.37用水供應業
107.60 100.00 100.23 101.76 103.12 1.34製造業
100.44 100.00 99.35 102.56 103.53 0.95食品及飼品製造業 98.15 100.00 106.47 114.30 115.02 0.63 飲料及菸草製造業 100.66 100.00 92.34 99.72 103.34 3.63
紡織業 93.84 100.00 105.91 110.88 114.52 3.28
成衣及服飾品製造業 93.52 100.00 113.38 138.90 137.08 -1.31 皮革、毛皮及其製品製造業 82.36 100.00 95.62 105.45 107.57 2.01 木竹製品製造業 97.13 100.00 98.00 97.21 103.42 6.39 紙漿、紙及紙製品製造業 98.17 100.00 99.65 105.04 104.97 -0.07 印刷及資料儲存媒體複製業 97.76 100.00 105.74 108.55 120.09 10.63 石油及煤製品製造業 106.16 100.00 114.26 108.19 115.00 6.29 化學原材料、肥料、氮化合物、塑橡
膠原料及人造纖維製造業 94.51 100.00 101.57 108.94 114.83 5.41 其他化學製品製造業 96.69 100.00 95.30 101.25 102.59 1.32 藥品及醫用化學製品製造業 100.77 100.00 108.26 113.99 107.33 -5.84 橡膠製品製造業 93.14 100.00 100.20 110.12 109.43 -0.63 塑膠製品製造業 94.40 100.00 99.99 102.09 105.51 3.35 非金屬礦物製品製造業 89.36 100.00 103.43 105.03 109.01 3.79 基本金屬製造業 106.55 100.00 102.63 104.87 116.64 11.22 金屬製品製造業 97.43 100.00 103.37 107.76 117.09 8.66 電子零組件製造業 103.27 100.00 97.87 102.44 100.03 -2.35 電腦、電子產品及光學製品製造業 97.94 100.00 102.08 98.33 79.70 -18.95 電力設備及配備製造業 104.23 100.00 105.99 111.22 118.43 6.48 機械設備製造業 91.17 100.00 94.83 95.84 111.45 16.29 汽車及其零件製造業 97.03 100.00 100.13 107.27 106.19 -1.01 其他運輸工具及其零件製造業 91.11 100.00 97.34 101.33 94.99 -6.26 家具製造業 96.74 100.00 97.50 100.22 105.59 5.36 其他製造業 102.08 100.00 92.56 85.38 85.61 0.27 產業用機械設備維修及安裝業 103.62 100.00 93.44 94.54 95.62 1.14
Summary Analysis
1. Number of Employees
▲The number of employees in the Industrial & Service sector increased by 90 thousand or 1.14% compared to the previous year.
In 2019, the demand for employees continued to increase because of the mildly growing economy.
The average number of employees in the Industrial & Service sector was 7,967 thousand, an annual increase of 90 thousand or 1.14%. Observed the industrial classification structure, the number of employees in the Industrial sector accounted for 42.60%, while that in the Services sector accounted for 57.40%.
The average number of employees in the Industrial sector was 3,394 thousand, an annual increase of 18 thousand or 0.52%; among all industries in this sector, the number of employees increased the most by 10 thousand in the Manufacturing industry. The average number of employees in the Services sector was 4,573 thousand, also increased by 73 thousand or 1.61% annually; among all industries in this sector, the number of employees increased the most by 16 thousand in the Wholesale & retail trade industry; the next most increase was in the Human health activities industry and the Accommodation
& food service activities industry, where they increased by 13 thousand and 11 thousand, respectively.
The average number of employees in Manufacturing industry was 2,855 thousand. Compared to the previous year, this was an increase of 10 thousand people or 0.34%. Among all sub-industries in this sector, the Manufacture of computers, electronic & optical products increased the most by 5 thousand. Followed by the increase of 4 thousand in the industry of Manufacture of food products &
prepared animal feeds. In third place was the Manufacture of fabricated metal products increased by 2 thousand. Significantly, Manufacture of electronic parts & components and Manufacture of textiles decreased by 4 thousand.
Table 1 Number of Employees by Industry
Unit:PersonsinThousand 2015 2016 2017 2018 2019 Annual rate
of change (%)
Total 7 532 7 637 7 769 7 877 7 967 1.14
Industrial sector 3 279 3 294 3 337 3 376 3 394 0.52
Mining & quarrying 4 4 4 3 3 -0.83
Manufacturing 2 753 2 768 2 810 2 845 2 855 0.34
Electricity & gas supply 30 31 31 32 32 1.92
Water supply & remediation activities 30 31 32 33 34 1.46
Construction 461 461 461 463 470 1.51
Services sector 4 253 4 343 4 432 4 500 4 573 1.61
Wholesale & retail trade 1 630 1 642 1 666 1 689 1 705 0.96
Transportation & storage 290 296 299 301 303 0.61
Accommodation & food service activities 431 458 481 492 503 2.30
Information & communication 211 219 224 228 233 2.07
Financial & insurance activities 378 381 386 387 390 0.63
Real estate activities 114 114 114 115 119 3.84
Professional, scientific & technical activities 257 263 266 271 277 2.22
Support service activities 370 379 388 394 404 2.50
Education (excluding all levels of public & private schools) 70 69 70 71 72 1.86
Human health activities 336 345 357 368 381 3.59
Arts, entertainment & recreation 63 67 69 70 71 0.54
Other service activities 104 110 114 113 114 0.70
Note: Education industry covers "Educational support activities & other education" only, such as various types of tutoring classes, art classes, driving classes, and agent services for study abroad or study-tour abroad.
▲The average monthly total earnings per employee in the Industrial & Service sector increased by 2.39% compared to the previous year.
In 2019, the average monthly total earnings per employee in the Industrial & Service sector was NT$53,657, which was an increase of 2.39% compared to the previous year. Of which, the regular earnings was NT$41,883, which was an annual increase of 2.01%, and the irregular earnings was NT$11,774, which was an annual increase of 2.85%. The average monthly total earnings of full-time employees with Taiwan nationality was NT$56,640, which was an increase of 2.58% compared to the previous year.
The average monthly total earnings per employee in the Industrial sector was NT$ 52,865, which was an increase of 1.65% compared to the previous year. The earnings in various industries increased compared to the previous year, with the Construction industry increased the most (2.72%), followed by Mining & quarrying industry (1.91%), and the Manufacturing industry (1.56%).
The average total monthly earnings per employee in the Service sector was NT$ 54,245, which was an increase of 2.92% compared to the previous year. The earnings in various industries increased compared to the previous year. Of which, the Real estate activities industry increased the most (5.82%), followed by the Professional, scientific & technical activities industry (4.34%), and the Financial &
insurance activities industry (4.31%).
Table 2 Average Monthly Total Earnings per Employee by Industry
Unit: NT$
2015 2016 2017 2018 2019 Annual rate of change
(%)
Full-time Employees with Taiwan Nationality - - - 55 215 56 640 2. 58
Total (all employees) 49 024 49 266 50 480 52 407 53 657 2. 39
Industrial sector 48 373 48 654 49 907 52 005 52 865 1. 65
Mining & quarrying 57 198 55 425 55 098 56 288 57 364 1. 91
Manufacturing 48 713 49 162 50 678 52 948 53 776 1. 56
Electricity & gas supply 96 595 94 453 94 730 96 054 96 137 0. 09 Water supply & remediation activities 44 357 43 216 44 286 45 319 45 830 1. 13
Construction 43 346 42 839 42 506 43 645 44 833 2. 72
Services sector 49 526 49 730 50 912 52 708 54 245 2. 92
Wholesale & retail trade 45 422 45 345 47 260 49 798 51 328 3. 07 Transportation & storage 51 579 52 540 53 314 54 994 55 588 1. 08 Accommodation & food service activities 32 508 32 498 33 406 34 077 34 686 1. 79 Information & communication 66 595 67 749 69 196 69 909 72 144 3. 20 Financial & insurance activities 84 742 85 452 86 425 89 215 93 059 4. 31
Real estate activities 44 075 42 897 44 893 47 658 50 431 5. 82
Professional, scientific & technical activities 56 132 56 427 57 585 58 773 61 326 4. 34
Support service activities 35 451 35 855 36 178 37 133 37 616 1. 30
Education (excluding all levels of public & private schools) 24 304 24 876 25 288 26 033 26 972 3. 61
Human health activities 64 100 65 236 65 681 67 014 68 517 2. 24
Arts, entertainment & recreation 36 184 36 821 37 535 38 742 39 520 2. 01
Other service activities 33 901 33 497 33 860 34 966 35 594 1. 80
Note: Same as Table 1.
▲The average monthly total working hours per employee in the Industrial & Services sector were 0.4 hours less than the previous year.
In 2019, the average monthly total working hours per employee for the Industrial & Service sector employees were 169.0 hours, which was 0.4 hours less than the previous year. The monthly total working hours in the Industrial sector were 0.6 hour less than the previous year, which was 173.9 hours. Of which, the Manufacturing industry had 0.9 less hours. The monthly total working hours in the Service sector remained the same as the previous year (165.5 hours). The monthly working hours in the Education industry and the Other service activities industry dropped the most, at 1.5 hours respectively. The monthly total working hours in the Real estate activities industry dropped by 1.4 hours.
Observed from the perspective of industrial classification, the top 10 with the longest average total working hours were as follows: Security & investigation activities (219.9 hours), Motor bus transportation (199.4 hours), Beauty treatment (183.6 hours), Manufacture of textiles (182.0 hours), Manufacture of rubber products (181.6 hours), Manufacture of electronic parts & components (180.9 hours), Electricity Supply (178.8 hours), Manufacture of wood & of products of wood & bamboo (178.6 hours), Manufacture of basic metals (178.3 hours), Manufacture of beverages & tobacco products (178.0 hours).
Observed from the perspective of employment types, the average monthly total working hours per full-time employee were 172.3 hours. The highest in the Support service activities industry was 186.3 hours. The Other service activities industry have 177.9 hours, and the Education industry has the lowest at 152.9 hours. The monthly total working hours per part-time employee were 103.0 hours. The Wholesale & retail trade industry and the Accommodation & food service activities had 119.8 hours and 115.4 hours, respectively.
Table 3 Average Monthly Total Working Hours per Employee by Industry
Unit: Hours 2015 2016 2017 2018 2019 Annual
change (hours)
employment type Full-time Part-time
Total 175.3 169.6 169.6 169.4 169.0 -0.4 172.3 103.0
Industrial sector 180.6 173.9 174.2 174.5 173.9 -0.6 175.5 82.2
Mining & quarrying 178.6 173.5 170.4 167.8 168.7 0.9 169.5 73.4
Manufacturing 182.1 175.4 175.8 176.0 175.1 -0.9 176.8 81.5
Electricity & gas supply 174.9 172.0 176.5 177.6 176.9 -0.7 176.9 106.7 Water supply & remediation activities 176.1 169.0 167.8 167.6 167.8 0.2 169.1 79.8
Construction 172.2 166.3 165.3 166.0 166.6 0.6 168.0 86.6
Services sector 171.3 166.3 166.1 165.5 165.5 0.0 169.8 107.1
Wholesale & retail trade 170.9 164.6 164.7 164.3 164.1 -0.2 167.3 119.8 Transportation & storage 178.1 172.4 172.1 173.4 173.3 -0.1 175.6 105.9 Accommodation & food service activities 167.2 163.6 160.4 158.3 158.6 0.3 169.3 115.4 Information & communication 165.1 161.1 162.7 161.7 161.4 -0.3 164.1 80.3 Financial & insurance activities 162.3 162.8 164.6 166.0 165.8 -0.2 166.4 77.2 Real estate activities 177.2 168.7 169.1 169.1 167.7 -1.4 169.2 80.3 Professional, scientific & technical activities 170.4 165.3 165.2 165.3 165.4 0.1 167.4 84.9 Support service activities 185.0 179.8 179.2 178.6 178.4 -0.2 186.3 94.5 Education (excluding all levels of public & private schools) 132.8 132.7 132.0 131.4 129.9 -1.5 152.9 55.9 Human health activities 172.2 166.2 166.8 165.5 165.7 0.2 168.6 82.4 Arts, entertainment & recreation 177.5 169.5 164.4 162.2 162.4 0.2 169.3 85.6 Other service activities 190.4 184.3 180.0 178.0 176.5 -1.5 177.9 85.8 Note: Same as Table 1.
▲The average accession rate of employees in the Industrial & Services sector was 2.34%, which was higher than the separation rate of 2.25%.
In 2019, the average accession rate of employees in the Industrial & Services sector was 2.34%
and the average separation rate was 2.25%. The net average accession rate (accession rate minus separation rate) was 0.09%. The average turnover rate [(accession rate + separation rate) /2] was 2.30%, which was a 0.02% reduction compared to the rate of 2.32% in the previous year.
The net accession rate in the Industrial sector was 0.02%. Among it, the Electricity & gas supply industry was higher at 0.24%, followed by Water supply & remediation activities industry at 0.21%.
The net accession rate in the Service sector at 0.15%, and all industries in this sector had positive net accession rates. The Real estate activities industry was the highest at 0.38%, followed by the Human health activities industry at 0.34%.
Observed from the perspective of industrial classification, the Support service activities was the highest accession rate at 4.72%, followed by the accession rate of 4.25% in the Accommodation &
food service activities industry and that of 3.51% in the Arts, entertainment & recreation industry, while the Electricity & gas supply industry was the lowest accession rate at 0.85%. For the separation rate, the Support service activities industry was the highest at 4.60%, followed by the separation rate 4.04% of in the Accommodation & food service Activities industry and that of 3.42% in the Arts, entertainment & recreation industry, while the Electricity & gas supply industry was still the lowest separation rate at 0.61%.
Table 4 Labor Turnover Rates by Industry
Unit: %
2015 2016 2017 2018 2019
accession rate separation
rate accession rate separation
rate accession rate separation
rate accession rate separation
rate accession rate separation
rate
accession net rate
Total 2.36 2.22 2.29 2.17 2.35 2.20 2.37 2.26 2.34 2.25 0.09
Industrial sector 2.06 2.01 2.01 1.93 2.05 1.93 2.03 1.95 1.96 1.94 0.02
Mining & quarrying 0.98 1.15 1.07 1.21 1.44 1.79 1.33 1.33 1.24 1.35 -0.11 Manufacturing 1.99 1.94 1.96 1.87 2.01 1.87 1.98 1.89 1.91 1.91 0.00 Electricity & gas supply 0.86 0.51 0.72 0.52 0.55 0.56 0.65 0.52 0.85 0.61 0.24 Water supply & remediation activities 1.74 1.48 1.56 1.26 1.61 1.58 1.84 1.55 1.72 1.51 0.21 Construction 2.61 2.58 2.43 2.47 2.44 2.41 2.45 2.42 2.38 2.23 0.15
Services sector 2.59 2.38 2.50 2.34 2.58 2.40 2.62 2.50 2.62 2.47 0.15
Wholesale & retail trade 2.39 2.29 2.38 2.32 2.47 2.31 2.48 2.39 2.41 2.34 0.07 Transportation & storage 2.10 1.88 1.83 1.73 1.76 1.66 1.64 1.56 1.55 1.52 0.03 Accommodation & food service activities 4.60 4.04 4.24 3.79 4.28 3.92 4.29 4.20 4.25 4.04 0.21 Information & communication 2.20 1.75 1.95 1.64 1.91 1.77 1.92 1.83 2.17 1.90 0.27 Financial & insurance activities 1.45 1.32 1.41 1.35 1.44 1.35 1.35 1.33 1.30 1.19 0.11 Real estate activities 2.97 2.99 2.24 2.27 2.13 2.02 2.40 2.30 2.53 2.15 0.38 Professional, scientific & technical activities 1.99 1.80 1.95 1.74 2.00 1.90 2.32 2.14 2.41 2.22 0.19 Support service activities 4.22 3.99 4.18 4.03 4.57 4.40 4.68 4.47 4.72 4.60 0.12 Education (excluding all levels of public & private schools) 2.21 2.23 2.25 2.35 2.85 2.67 3.18 3.05 3.11 2.91 0.20 Human health activities 1.51 1.30 1.58 1.34 1.63 1.35 1.65 1.38 1.79 1.45 0.34 Arts, entertainment & recreation 3.87 3.39 3.54 3.11 3.31 3.16 3.44 3.30 3.51 3.42 0.09 Other service activities 2.00 1.57 1.99 1.46 1.57 1.48 1.78 1.77 1.76 1.69 0.07 Note: Same as Table 1.