Original Article
Effectiveness of Motivational Interviewing for Improving Continuity of Care among Stroke Patients
Hsiao-Mei Chen
1, Fu-Chi Yang
2, Pei-Lun Hsieh
3, Ching-Min Chen
4*1 Department of Nursing, Chung Shan Medical University, Head Nurse, Department of Nursing, Cheng Ching Hospital, Taichung, Taiwan (R.O.C.)
2 College of General Education, National Chin-Yi University of Technology, Taichung, Taiwan, & PhD Student, Institute of Allied Health Sciences, College of Medicine, National Cheng Kung University, Tainan, Taiwan (R.O.C.)
3 Department of Nursing, College of Health, National Taichung University of Science and Technology, Taichung, Taiwan (R.O.C.)
4 Department of Nursing, & Institute of Allied Health Sciences, College of Medicine, National Cheng Kung University, Tainan, Taiwan (R.O.C.)
Introduction
Stroke is a leading cause of death globally, second only to ischemic heart disease. [1] Stroke was the fourth leading cause of death in Taiwan in 2017.About 50,000 individuals suffer strokes every year and on average 49.9 per 100,000 die from cerebrovascular disease. [2] A previous study has shown that the prevalence rate of depression is approximately 42%
three months after a stroke, [3] making it the most Background: Continuity of care (CoC) is an important issue for first-time stroke patients. Motivational interviewing (MI) involves facilitating and engaging intrinsic motivation within patients to change their behavior. However, there is a lack of relevant empirical studies on the effectiveness of MI for improving CoC among stroke patients. The purpose of this study is to explore the effectiveness of 6 weeks of MI on improving perception of CoC and depression levels among subjects who have experienced their first stroke.
Methods: This was a quasi-experimental study. Sixty-five patients diagnosed with stroke and hospitalized in the rehabilitation ward of a regional hospital in central Taiwan were recruited. Test results for patient continuity of care perception (PCCQ) and degree of depression were collected in both groups before and immediately after the 6-week intervention period, as well as at 3 months following the intervention period.
Results: Using the pretest results of the control group as baseline values, under the interaction of control and time, statistically significant differences in PCCQ scores were observed in the experimental group after 6-week intervention. The results confirmed that MI enhances PCCQ scores (GEE = 0.41, p
= 0.005) of stroke patients.
Conclusion: As MI enhances PCCQ scores, it can be applied to the clinical care of stroke patients Keywords: Motivational interviewing, Continuity of Care, Stroke Patients, Depression
* Corresponding Author: Ching-Min Chen Address: No.1, University Road, Tainan City 701 Tel: +886-6-2353535 ext. 5858 ; 0933-967246 Fax: +886-6-2377550
E-mail: chingmin@mail.ncku.edu.tw
serious complication. [4] This not only negatively impacts on recovery and social activities, but also leads to increased morbidity and mortality. [5-6] Making the best use of the golden period of hospitalization to avoid depression is an important issue for stroke patients and clinical professionals. [7]
Continuity of care (CoC) includes appropriate referrals, case management, and discharge preparation processes that ensure complete and continuous care of patients, a concept that is critical to both health care teams and their patients. [8-9] Haggerty et al. [9]
conducted an interdisciplinary team study, dividing CoC into three modes, namely informational continuity, relational continuity, and management continuity. Informational continuity refers to the provision of appropriate care and proper and correct medical information by the medical system and the medical staff as time progresses. Relational continuity refers to a persistent quality treatment relationship with patients as time progresses. Management continuity refers to the provider’s use of procedures and guidelines that ensure that patients obtain orderly, coherent, complementary and timely care or treatment, as well as timely and quality services.
Through provision of integral and timely CoC by a professional medical team, service fragmentation is reduced, which enhances the CoC perception of patients. [9-10] Relevant research has shown that applying motivational interviewing (MI) to stroke patients improves patient knowledge, satisfaction, and activities of daily living (ADL), which enhance CoC and quality of health care. [8,11-13] MI is a brief client-centered intervention designed to enhance intrinsic motivation to encourage behavioral change by exploring and reducing the ambivalence of patients. [14-15] The core concept of MI is that it should be the patient, rather than the healthcare provider, who voices the argument for change. [16] Medical personnel should refrain from using an ingrained approach. Rather, they should become action- oriented problem solvers and reflective listeners. [17]
The four guiding principles of MI are: (1) expressing empathy, (2) developing discrepancy, (3) rolling with resistance, and (4) supporting self-efficacy. [12-13,17]
Studies have shown that MI can assist patients with self-management of chronic disease and improve care outcomes through modification of
behaviors such as smoking cessation, [18] weight control, [19] drug compliance, [20] health status monitoring, [16-17]and depression prevention. [13,18-19] The purpose of this study is to apply MI to interventions of stroke patients and to explore the Patient Continuity of Care Questionnaire (PCCQ) and the effects of depression status. The results can serve as a reference for clinical teams promoting CoC of stroke patients.
Materials and Methods
Study Design and SampleA quasi-experimental design was adopted.
Participants were recruited from March to October 2016 from a rehabilitation ward of a regional hospital in central Taiwan based on convenience sampling.
The subjects experienced their first stroke within 3 months of the onset of the study. The experimental group received a 15-30 minute MI session once a week for 6 weeks. Conversely, the control group received individual bedside attention from a researcher (nurse) for 15–30 minutes once a week for 6 weeks. The researcher mainly provided stroke- related information and expressed concern but did not attempt to enhance patient motivation or change patient behavior. To avoid cross-contamination of MI intervention between the groups, a cluster assignment approach was applied, with recruitment carried out in two steps. Experimental group subjects were recruited first followed by control group subjects. The patients in both groups received routine health care during the intervention and PCCQ and Center for Epidemiological Studies Depression (CES-D) questionnaires were filled out before the intervention to obtain baseline values for measuring the degree of improvement after the intervention. The first posttest was conducted at 6 weeks at the end of the intervention period.
The second posttest was conducted 3 months after the intervention period. Inclusion criteria were: 1) Diagnosed with stroke by physician and transferred to the rehabilitation ward for occupational and physical rehabilitation with stable vital signs after acute-phase treatment; 2) provided signed consent to participate in the survey and intervention; 3) aged
Appendix 1. Operational manual for motivational interviewing of stroke patients
Motivational Interviewing SESSION 1 Goals
1. Introduction.
2. Assess the stage of behavioral change.
3. First motivational interview.
4. Summary of the interview.
1. Introduce the purpose of the study and clarify the content of the motivational interview.
2. Assess the stage of behavioral change and awareness of and readiness for post-stroke care.
3. Develop understanding of the issues of concern.
4. Summarize and reorganize the content of the interview and ask the patients if there is anything that should be added. Inform the patients of the time of the next interview before ending the session.
SESSION 2
1. Assess the stage of behavioral change.
2. Second motivational interview.
3. Summary of the interview.
1. Summarize what was discussed in SESSION 1 2. Assess the stage of behavioral change based on
the information given. Encourage patients to express concerns, ideas, and thoughts about post-stroke care through discussions. Since every patient might have a different assessment of the advantages and disadvantages of post-stroke care, this step enables a better understanding of not only the aspects the patient has taken into account and is concerned about, but also the contradictions.
The research nurse responds to the patient with feedback, inquiries, and affirmations and deals with resistance to trigger patient perception of the benefits of change and disadvantages of not changing.
3. Discuss post-stroke care and explain continuity of care. Assist patients to enter the action stage.
4. Summarize and review the content of the interview and reinforce patient ideas regarding change during post-stroke care. Inform the patients of the time of the next interview before ending the session.
SESSION 3
1. Assess the stage of behavioral change.
2. Third motivational interview.
3. Discuss the preparations for post-stroke care.
4. Summary of the interview.
1. Summarize what was discussed in SESSION 2 and implement assessment of patient motivation to change.
2. Discuss the preparations to be made for post-stroke care, such as adjusting mindset, maintaining positive thoughts, controlling blood pressure, taking medications regularly, learning about the post-stroke diet, implementing rehabilitation, and providing related information about assistive devices and supplies.
3. Assist patients with concepts for implementing post-stroke care in real life, providing ideas and discussing what kinds of difficulties might be encountered. Ask patients to write down goals and plans for change.
4. Summarize the content of the interview and emphasize the commitment to change. Inform the patients of the time of the next interview before ending the session.
18 or over; and 4) not mentally impaired. Exclusion criteria included: 1) History of other nervous system disease, such as Parkinson’s disease, psychiatric disease, or multiple sclerosis; 2) having received psychiatric or clinical psychology intervention; 3) drug addiction; 4) suffering from depression (CES-D
>10); and 5) inability to participate in the interviews or to answer questions.
G power 3.0.10 statistical software [21] was utilized to determine the sample size with alpha value set at 0.05, power at 0.8, and effect size at 0.70 based on a study Byers et al. [12] Estimations were based on repeated measures ANOVA and other statistical
methods for analyzing factors. [12] In addition, considering the loss rate of 10% refusal to participate in and 10% withdrawal from the study, [22] the required total sample size was 64. The final sample size was 65, with 33 in the experimental group and 32 in the control group. During the study period, three participants who developed depression (social worker referral) and four who did not complete the posttests were excluded, resulting in an effective acceptance rate of 90.28%.
Interventions
MI intervention was performed by a researcher SESSION 4
1. Assess the stage of behavioral change.
2. Fourth motivational interview.
3. Discuss the preparations for post-stroke care.
4. Summary of the interview.
1. Summarize what was discussed in SESSION 3 and implement assessment of patient motivation to change.
2. Discuss the “change plan” and customize the post-stroke care plan.
3. Summarize the content of the interview, enhance autonomy and strengthen patient choice of and commitment to changes in their post-stroke care.
Inform the patients of the time of the next interview before ending the session.
SESSION 5
1. Assess the stage of behavioral change.
2. Fifth motivational interview.
3. Discuss special circumstances that might occur.
4. Summary of the interview.
1. Summarize what was discussed in SESSION 4 and implement assessment of patient motivation to change.
2. Discuss special circumstances and high-risk recurrence scenarios that may be experienced after discharge and ways to respond to them.
3. Assist patients with environmental reevaluation of factors that can affect health behavior and propose alternatives to unhealthy behavior, enabling patients to use resources that lead to healthy behavior.
4. Summarize the content of the interview and inform the patients of the time of the next interview before ending the session.
SESSION 6
1. Assess the stage of behavioral change.
2. Sixth motivational interview.
3. Support changes.
4. Summary of the interview.
1. Summarize what was discussed in SESSION 5 and implement assessment of patient motivation to change.
2. Review the most important changes.
3. Summarize the patient commitment to change and the changes made and enhance and confirm the patient commitment and changes.
4. Explore other changes patients may want to make in the future.
5. Ask the patients to restate their change plans and the consequences of changing and not changing.
6. Support patient self-efficacy and emphasize patient ability to change.
with approximately 20 years of experience in internal medicine and surgical departments. This researcher completed an elective course on Motivational Psychology (3 credits) and participated in a 16- hour MI and practical exercise seminar. During the research process, rigorous discussions with nursing supervisors, attending physicians, and social worker were conducted. This ensured cooperation during intervention, monitoring of the progress of the study, and consistency of the study. Interviews were conducted with stroke patients in the experimental group based on the operational manual for MI of stroke patients (see Appendix 1). Individualized behavioral change strategies were based on stage of readiness for change of each patient. Behavioral characteristics of the 6 stages (pre-contemplation, contemplation, preparation, action, maintenance, and termination) were then integrated with 10 behavioral change strategies. [23] From the pre-contemplation to the contemplation stage, consciousness raising was adopted as the process of change. Transition from the contemplation stage to the preparation stage involved dramatic relief and self-re-evaluation.
From the preparation stage to the action stage, self- commitment was the identified process of change.
Finally, moving from action to maintenance stage required reinforcement management, environmental re-evaluation, helpful relationships, and stimulus control. There was successful transition from one stage to another. [24] In addition, the 6-week MI intervention was conducted utilizing 5 principles of MI [23] and 10 basic therapeutic techniques, including asking permission, eliciting/evoking change talk, exploring importance and confidence, and asking open-ended questions, as well as reflective listening, normalizing, decisional balance, affirmation, advice/
feedback, and summarizing. [25]
Study Instrument
A self-developed structured questionnaire for data collection included: 1) socio-demographic information; 2) PCCQ; and 3) CES-D Scale. The socio-demographic information included gender, age, marital status, level of education, living situation, working situation, economic situation, religious beliefs, health conditions (types and numbers of chronic diseases), ADL, [26] and stroke-related
conditions (smoking history, type of stroke, National Institutes of Health stroke scale (NIHSS), stroke area, hemiparesis, and risk factors). The Chinese version of PCCQ was developed by this research team [27] in August 2011 based on the work of Hadjistavropoulos. It comprises 35 items, with a total of 6 domains: relationships with providers during hospitalization (7 items), information transfer to patients (12 items), relationships with providers in the community (5 items), management of written documents (2 items), management of follow-up (5 items), and management of communication among providers (4 items). A Likert type five-point scale was applied, ranging from 1 (strongly disagree) to 5 (strongly agree). A total of 11 experts were involved in the content validation test of the Chinese version of the PCCQ, with CVI= 0.93. In terms of reliability, this scale was found to have good internal consistency, with Cronbach’s alpha of 0.91- 0.92.
[11] The 10-item CES-D Scale excerpted from the Taiwan Longitudinal Study on Aging (TLSA) was easily understood and less likely to cause emotional overload than the full version. [28] Scoring was 0=
never; 1= rarely; 2= sometimes; 3= often or always for the negative items with the scale in the reverse direction for positive items (items 9 and 10). Total score ranged from 0-30 points, with a higher score indicating a higher degree of depression.
Data Collection
Ethics approval was obtained from the Institutional Review Board (IRB) of the teaching hospital (Number: REN 10332). A pilot study was conducted in February 2016 during which 5 stroke patients were recruited to fill out the questionnaires and engage in MI. The purpose of the pilot study was to revise the questionnaires and the operational manual for MI, as well as to examine the reliability and validity of the instruments before formal data collection. Subjects who met the inclusion criteria were referred by physicians and assigned to study groups by the research team. The researcher explained the purpose of the study to the participants to obtain their signed consent before beginning data collection. Data collection included pretest, posttest at 6 weeks, and telephone interview at 3 months after the intervention for both groups.
Statistical Analysis
Statistical Package of Social Science (SPSS) for Windows 25.0 was utilized for data analysis in accordance with the purpose of the study and the research framework. [29] Data analysis included frequency distribution, percentage, mean, and standard deviation. Test of homogeneity was conducted for the baseline data of the stroke patients in both the experimental and control groups. Chi- square test for contingency tables was performed for categorical data and independent-sample t-test was performed for homogeneity of the continuous data. Moreover, independent-sample t-test was conducted for pretest PCCQ and CES-D scales to determine the differences between the two groups before MI intervention. Repeated measures ANOVA was utilized to analyze changes in the PCCQ and CES-D scales for both groups before the intervention, at 6 weeks (immediately following the end of the intervention), and at 3 months after the intervention. Fisher’s test was used for comparisons of the pretests between the two groups, as well as between the immediate posttest (T2) and pretest (T1) and between the 3-month posttest (T3) and pretest (T1) in each group. A generalized estimating equation (GEE) was utilized for estimates in both the experimental and control groups to understand the effectiveness of the MI intervention on stroke patients.
Results
Description of Participants
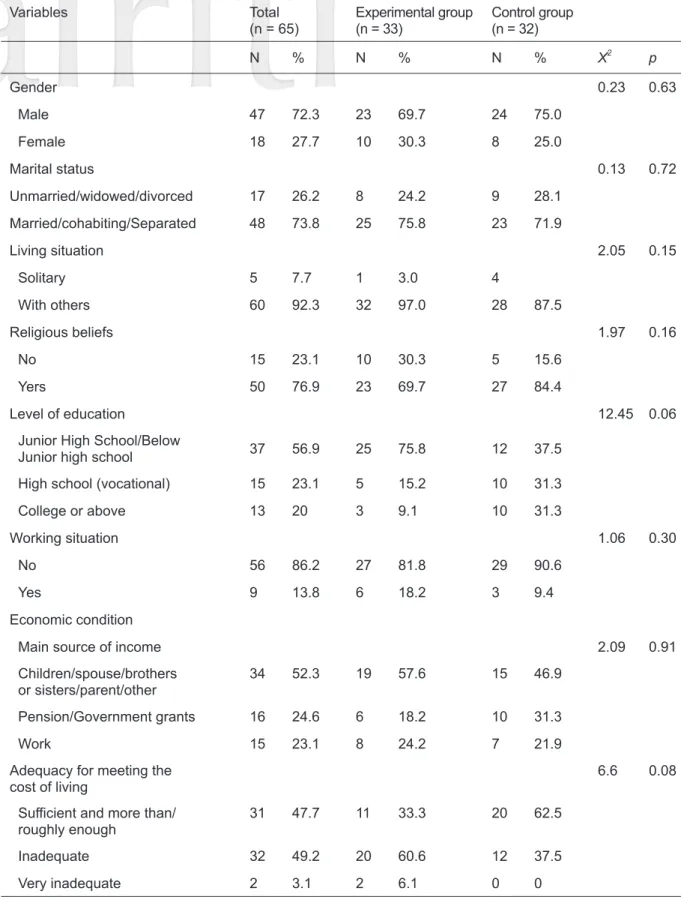
The effective sample size was 65 subjects, 47 of whom were male (72.3%). There were 33 subjects in the experimental group (average age 61.61 ± 14.71) and 32 subjects in the control group (average age 61.31 ± 2.60). The average number of people living together in the experimental group was 4.12
± 2.76, while that in the control group was 2.60
± 2.05. Average ADL score of the experimental group was 40.45 ± 17.96 while that of the control group was 32.66 ± 16.06. There were no significant inter-group differences in the baseline data of the subjects (p > 0.05) and the two groups were considered homogeneous (Table 1).
Influence of MI Intervention on Stroke Patient PCCQ Scores
Repeated measures ANOVA was utilized for analyzing the changes in the average PCCQ scores in both groups at different time intervals.
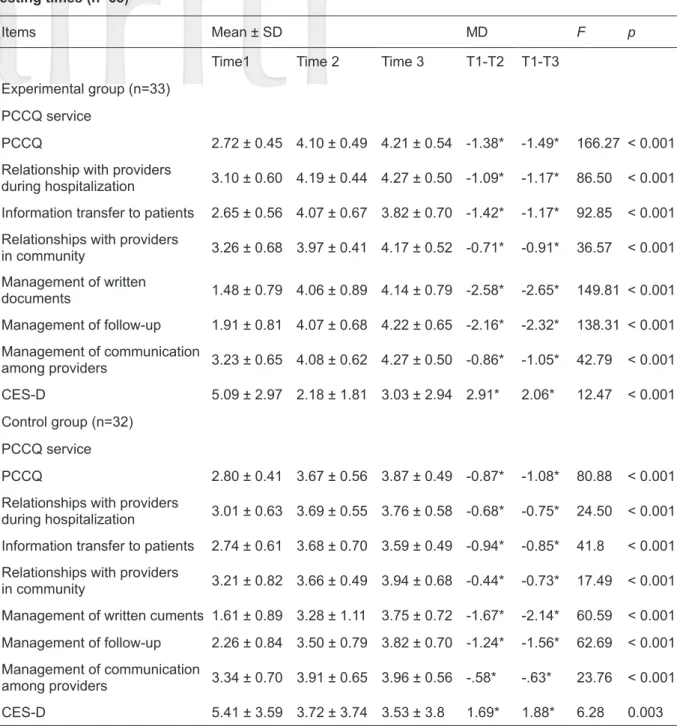
GEE was used to estimate the effect of MI on PCCQ scores. There were no significant inter- group differences for PCCQ pretest scores (Table 1). Changes in PCCQ scores in the experimental group and control group before, after 6 weeks of, and 3 months after MI intervention were examined. In the experimental group, repeated measures ANOVA revealed that the average PCCQ scores for the three time intervals were 2.72 (SD
= 0.45), 4.10 (SD = 0.49), and 4.21 (SD = 0.54), respectively, indicating significant increases over time (F = 166.2, p < 0.001). There were increases of 1.38 (T2-T1; p < 0.05) and 1.49 (T3-T1; p <
0.05) in the PCCQ scores of the experimental group. In terms of the changes in the 6 subscales of PCCQ, average scores gradually increased for relationships with providers during hospitalization (F = 86.50, p < 0.001), information transfer to patients (F = 92.85, p < 0.001), relationships with providers in the community (F = 36.57, p < 0.001), management of written documents (F = 149.8, p <
0.001), management of follow-up (F = 138.3, p <
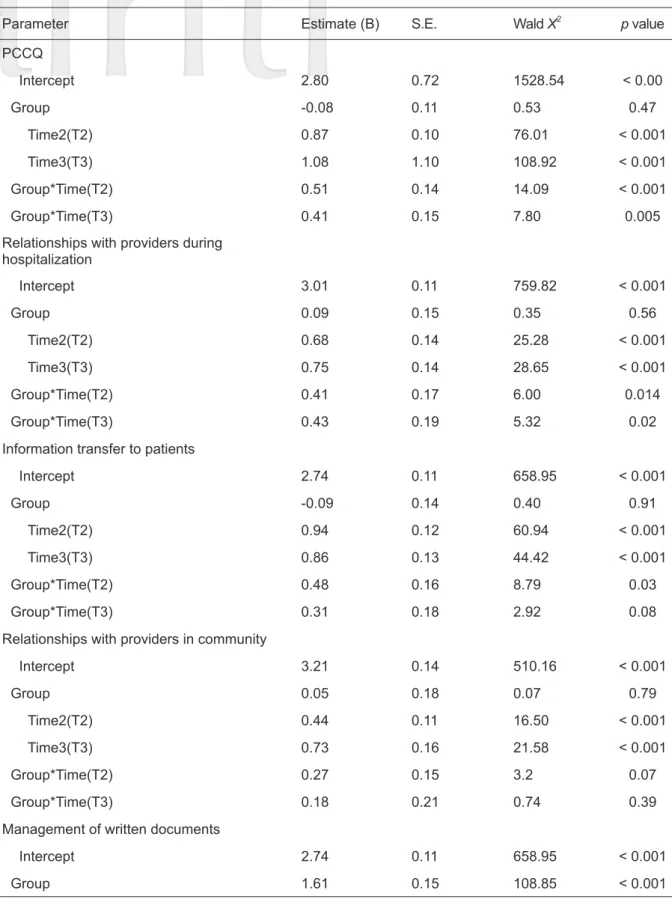
0.001), and management of communication among providers (F = 42.79, p < 0.001) (Table 2). GEE was utilized to analyze the changes in PCCQ scores for the two groups, for which the pretest values were the baseline. The results for the interaction of
“group and time” showed that PCCQ scores were significantly higher in the experimental group than in the control group. On the relationships with providers during hospitalization subscale, higher score was observed in the experimental group than in the control group on posttest 3 months after the intervention. Similar results were found for the management of follow-up and management of communication among providers subscales (GEE = 0.76, p < 0.05; 0.42, p < 0.05) on posttest 3 months after the intervention (Table 3).
Influence of MI Intervention on Stroke Patient CES-D Scores
The influence of MI intervention on CES-D
Table 1. Comparisons of homogeneity of the two groups in terms of pretest data
Variables Total
(n = 65) Experimental group
(n = 33) Control group (n = 32)
N % N % N % X2 p
Gender 0.23 0.63
Male 47 72.3 23 69.7 24 75.0
Female 18 27.7 10 30.3 8 25.0
Marital status 0.13 0.72
Unmarried/widowed/divorced 17 26.2 8 24.2 9 28.1
Married/cohabiting/Separated 48 73.8 25 75.8 23 71.9
Living situation 2.05 0.15
Solitary 5 7.7 1 3.0 4
With others 60 92.3 32 97.0 28 87.5
Religious beliefs 1.97 0.16
No 15 23.1 10 30.3 5 15.6
Yers 50 76.9 23 69.7 27 84.4
Level of education 12.45 0.06
Junior High School/Below
Junior high school 37 56.9 25 75.8 12 37.5
High school (vocational) 15 23.1 5 15.2 10 31.3
College or above 13 20 3 9.1 10 31.3
Working situation 1.06 0.30
No 56 86.2 27 81.8 29 90.6
Yes 9 13.8 6 18.2 3 9.4
Economic condition
Main source of income 2.09 0.91
Children/spouse/brothers
or sisters/parent/other 34 52.3 19 57.6 15 46.9
Pension/Government grants 16 24.6 6 18.2 10 31.3
Work 15 23.1 8 24.2 7 21.9
Adequacy for meeting the
cost of living 6.6 0.08
Sufficient and more than/
roughly enough 31 47.7 11 33.3 20 62.5
Inadequate 32 49.2 20 60.6 12 37.5
Very inadequate 2 3.1 2 6.1 0 0
Variables Total
(n = 65) Experimental group
(n = 33) Control group (n = 32)
N % N % N % X2 p
Smoking history 0.02 0.89
Non-smoker 36 55.4 18 5.45 18 56.3
Smoker 29 44.6 15 45.5 14 43.7
Type of stroke 0.38 0.54
Blockage/Ischemic Stroke 33 50.8 18 54.5 15 46.9
Hemorrhagic Stroke 32 49.2 15 45.5 17 53.1
Stroke area 9.35 0.16
Anterior cerebral artery 12 18.5 7 21.2 5 15.6
Middle cerebral artery 21 32.3 12 36.4 9 28.1
Posterior cerebral artery 8 12.3 6 18.2 2 6.3
Basal ganglia 10 15.4 2 6.1 8 25
Thalamus 2 3.1 1 3.0 1 3.1
Intracranial hemorrhage 8 12.3 2 6.1 6 18.8
Brain stem 4 6.20 3 9.1 1 3.1
Hemiparesis 0.12 0.73
Left side 44 67.7 23 69.7 21 65.6
Right side 21 32.3 10 30.3 11 34.4
Risk Factors for Stroke 0.83 0.97
None 4 6.2 2 6.1 2 6.3
Hypertension 32 49.2 17 51.5 15 46.9
Diabetes 3 4.6 2 6.1 1 3.1
Heart disease 4 6.2 2 6.1 2 6.3
Cardiovascular disease and
diabetes 19 29.2 9 27.3 10 31.3
Hypertension and heart disease 3 4.6 1 3.0 2 6.3
Mean SD Mean SD Mean SD t p
Age 61.46 13.88 61.61 14.71 61.31 2.60 0.09 0.29
Number of people living together 3.37 2.53 4.12 2.76 2.60 2.05 2.53 0.36
Number of diseases 2.79 1.10 2.33 0.89 3.19 1.26 -3.39 0.09
ADL 36.1 17.64 40.45 17.96 32.66 16.06 1.81 0.66
NIHSS 10.09 2.98 9.30 2.92 10.91 2.86 -2.24 0.94
MMSE 56.48 2.59 25.88 2.88 27.13 2.11 -.18 0.14
Abbreviation: ADL, activities of daily living, IADL, Instrumental activities of daily living, NIHHS, National Institute of Health stroke scale, MMSE, mini–mental state examination.
scores before, after 6 weeks of, and 3 months after the implementation of MI intervention was compared. In the experimental group, repeated measures ANOVA was utilized to analyze levels of depression, with average scores for the three tests of 5.09 (SD = 2.97), 2.18 (SD = 1.81), and 3.03
(SD = 2.94), respectively, indicating significant decreases over time (F = 12.47, p < 0.001). The Scheffé test was used for comparisons between the 1st posttest (T2) and pretest (T1) and the 2nd posttest (T3) and pretest (T1). The results showed significant decreases (T2-T1; p < 0.05; T1-T3; p <
Table 2. Differences in PCCQ and CES-D scores among stroke patients in both groups at different testing times (n=65)
Items Mean ± SD MD F p
Time1 Time 2 Time 3 T1-T2 T1-T3
Experimental group (n=33) PCCQ service
PCCQ 2.72 ± 0.45 4.10 ± 0.49 4.21 ± 0.54 -1.38* -1.49* 166.27 < 0.001 Relationship with providers
during hospitalization 3.10 ± 0.60 4.19 ± 0.44 4.27 ± 0.50 -1.09* -1.17* 86.50 < 0.001 Information transfer to patients 2.65 ± 0.56 4.07 ± 0.67 3.82 ± 0.70 -1.42* -1.17* 92.85 < 0.001 Relationships with providers
in community 3.26 ± 0.68 3.97 ± 0.41 4.17 ± 0.52 -0.71* -0.91* 36.57 < 0.001 Management of written
documents 1.48 ± 0.79 4.06 ± 0.89 4.14 ± 0.79 -2.58* -2.65* 149.81 < 0.001 Management of follow-up 1.91 ± 0.81 4.07 ± 0.68 4.22 ± 0.65 -2.16* -2.32* 138.31 < 0.001 Management of communication
among providers 3.23 ± 0.65 4.08 ± 0.62 4.27 ± 0.50 -0.86* -1.05* 42.79 < 0.001 CES-D 5.09 ± 2.97 2.18 ± 1.81 3.03 ± 2.94 2.91* 2.06* 12.47 < 0.001 Control group (n=32)
PCCQ service
PCCQ 2.80 ± 0.41 3.67 ± 0.56 3.87 ± 0.49 -0.87* -1.08* 80.88 < 0.001 Relationships with providers
during hospitalization 3.01 ± 0.63 3.69 ± 0.55 3.76 ± 0.58 -0.68* -0.75* 24.50 < 0.001 Information transfer to patients 2.74 ± 0.61 3.68 ± 0.70 3.59 ± 0.49 -0.94* -0.85* 41.8 < 0.001 Relationships with providers
in community 3.21 ± 0.82 3.66 ± 0.49 3.94 ± 0.68 -0.44* -0.73* 17.49 < 0.001 Management of written cuments 1.61 ± 0.89 3.28 ± 1.11 3.75 ± 0.72 -1.67* -2.14* 60.59 < 0.001 Management of follow-up 2.26 ± 0.84 3.50 ± 0.79 3.82 ± 0.70 -1.24* -1.56* 62.69 < 0.001 Management of communication
among providers 3.34 ± 0.70 3.91 ± 0.65 3.96 ± 0.56 -.58* -.63* 23.76 < 0.001
CES-D 5.41 ± 3.59 3.72 ± 3.74 3.53 ± 3.8 1.69* 1.88* 6.28 0.003
Note: *p< 0.05 ** p< 0.01 *** p< 0.001
Abbreviation: MD, mean deviation, PCCQ, patient continuity of care questionnaire, CES-D, Center for Epidemiological Studies Depression, Time1 (T1), pretest, Time2 (T2), at 6 weeks, Time3 (T3), after 3 months.
Table 3. Comparisons of differences in PCCQ and CES-D scores between the two groups at different times using GEE (n = 65)
Parameter Estimate (B) S.E. Wald X2 p value
PCCQ
Intercept 2.80 0.72 1528.54 < 0.00
Group -0.08 0.11 0.53 0.47
Time2(T2) 0.87 0.10 76.01 < 0.001
Time3(T3) 1.08 1.10 108.92 < 0.001
Group*Time(T2) 0.51 0.14 14.09 < 0.001
Group*Time(T3) 0.41 0.15 7.80 0.005
Relationships with providers during hospitalization
Intercept 3.01 0.11 759.82 < 0.001
Group 0.09 0.15 0.35 0.56
Time2(T2) 0.68 0.14 25.28 < 0.001
Time3(T3) 0.75 0.14 28.65 < 0.001
Group*Time(T2) 0.41 0.17 6.00 0.014
Group*Time(T3) 0.43 0.19 5.32 0.02
Information transfer to patients
Intercept 2.74 0.11 658.95 < 0.001
Group -0.09 0.14 0.40 0.91
Time2(T2) 0.94 0.12 60.94 < 0.001
Time3(T3) 0.86 0.13 44.42 < 0.001
Group*Time(T2) 0.48 0.16 8.79 0.03
Group*Time(T3) 0.31 0.18 2.92 0.08
Relationships with providers in community
Intercept 3.21 0.14 510.16 < 0.001
Group 0.05 0.18 0.07 0.79
Time2(T2) 0.44 0.11 16.50 < 0.001
Time3(T3) 0.73 0.16 21.58 < 0.001
Group*Time(T2) 0.27 0.15 3.2 0.07
Group*Time(T3) 0.18 0.21 0.74 0.39
Management of written documents
Intercept 2.74 0.11 658.95 < 0.001
Group 1.61 0.15 108.85 < 0.001
0.05) in the experimental group. (Table 2). These results were utilized to analyze the CES-D data in the two groups, with the results of pretests used as the baseline. The results of GEE indicated that in the interaction of “group and time”, CES-D scores of the experimental group were lower than those of
the control group on the 1st posttest (6 weeks after) and the 2nd posttest (3 months after). However, neither result was statistically significant (p > 0.05) (Table 3).
Discussion
Parameter Estimate (B) S.E. Wald X2 p value
Time2(T2) 0.90 0.30 9.08 0.003
Time3(T3) 0.51 0.27 3.69 0.06
Group*Time(T2) 0.90 3.00 9.08 0.003
Group*Time(T3) 0.51 0.27 49.52 < 0.001
Management of follow-up
Intercept 2.26 0.15 241.39 < 0.001
Group -0.35 0.20 3.08 0.08
Time2(T2) 1.24 0.16 63.35 < 0.001
Time3(T3) 1.56 0.18 75.66 < 0.001
Group*Time(T2) 0.93 0.24 15.10 < 0.001
Group*Time(T3) 0.76 0.24 10.22 < 0.001
Management of communication among providers
Intercept 3.34 0.12 755.87 < 0.001
Group -0.11 0.16 0.44 0.51
Time2(T2) 0.58 0.12 24.79 < 0.001
Time3(T3) 0.63 0.11 31.07 < 0.001
Group*Time(T2) 0.28 0.17 2.75 0.10
Group*Time(T3) 0.42 0.18 5.75 0.02
CES-D
Intercept 5.41 0.62 75.25 < 0.001
Group -0.32 0.81 0.15 0.69
Time2(T2) -1.69 0.58 8.61 0.003
Time3(T3) -1.88 0.65 8.34 0.004
Group*Time(T2) -1.22 0.78 2.44 0.12
Group*Time(T3) -0.19 0.97 0.04 0.85
Note: Reference group indicates control group, Reference group, Time1 (T1, Pretest), Reference group, control group*Time1, Time2 (T2), at 6 weeks, Time3 (T3), after 3 months.
Abbreviation: PCCQ, patient continuity of care questionnaire, CES-D, Center for Epidemiological Studies Depression.
Repeated measures ANOVA was utilized for evaluating the changes among subjects. Mean PCCQ scores increased significantly in the experimental group, which means that subjects in this group perceived significantly improved CoC after 6 weeks of and 3 months after MI intervention.
These results were similar to the findings of Kim, Thrift, Nelson, Bladin, & Cadilhac and Shin et al.
[30-31] who showed that MI intervention improves
CoC. A comparison was made between the PCCQ scores in both the experimental and control groups under the interaction of “group and time”.
Overall, in terms of the differences between the two posttests (conducted after 6 weeks of and 3 months after intervention) and the pretest, PCCQ scores for relationships with providers during hospitalization, management of written documents, management of follow-up, and management of communication among providers improved 3 months after MI intervention. These results were similar to those of Byers et al. and Sohl, Birdee, &
Elam [12,33], which indicated that in stroke patients MI intervention changes patient level of knowledge and behavior and increases patient satisfaction with the medical team. In terms of information transfer to patients, in the experimental group the score on posttest conducted after 6 weeks of intervention was significantly higher than that of the control group. However, when compared with the score on posttest 3 months after intervention, there was no significant difference. During the 6 weeks of hospitalization, the nurse held one-on-one motivational interviews and provided diagnostic information and explanations of relevant drugs, diet, and auxiliary equipment. As first-time stroke patients may actively adjust their willingness to change their behavior through MI intervention, significant differences in information transfer to patients were achieved. [12,33] However, the mean scores for information transfer to patients 3 months after discharge showed a decreasing trend in both groups, without statistical significance. For relationships with providers in the community, no significant difference was observed for the comparison of the scores on posttests of both groups
after 6 weeks of and 3 months after intervention.
This was most likely due to lack of a fully functional family physician system in Taiwan. Once the stroke patients were discharged, they had the freedom to choose a medical treatment setting, resulting in difficulties in clinical implementation of information transfer to patients and relationships with providers in the community. [34]
On posttests after 6 weeks of and 3 months after intervention, the CES-D score of the experimental group was lower than that of the control group.
However, the differences were not significant.
This differed from the results of Cheng et al. [13]
and Watkins et al. [35] which showed significant differences in depression status among stroke patients who underwent 4-week MI intervention.
The reason for the discrepancies may be that the present study excluded stroke patients with CES-D score >10. Therefore, none of the patients suffered from depression. In this study, degree of depression decreased in the two groups, but only slightly, indicating no obvious effect of MI intervention on stroke patient level of depression.
Conclusions
A quasi-experimental design was used in this study and the effectiveness of 6-week MI intervention in the CoC of stroke patients (including PCCQ scores and depression levels) was explored.
Stroke patients were unable to understand the concepts of CoC during the first MI session but became familiar with them after 6 sessions. They maintained a good therapeutic relationship with the providers, felt satisfied with the care given by the providers, took initiative in terms of understanding disease-related information and overcoming psychological barriers and disease-related problems, and adjusted their levels of self-confidence and methods of emotional expression, which significantly enhanced the effectiveness of CoC. Therefore, in the face of dual pressures from health insurance providers and the need to reduce medical resource utilization, it is suggested that MI be applied to clinical practice, research and policies. In addition,
MI can be extended to clinical studies on CoC for patients with acute and chronic diseases. MI should also be included in health care professional training programs. Clinically, MI guides the participation of patients and their families, encourages patients to actively learn ADL, and focuses on family and community connections to enhance patients’ social adaption, PCCQ score, and depression level.
Although MI intervention in stroke patients has been shown to effectively improve patient CoC perception, there are some limitations to this study that should be noted. A quasi-experimental study design was used and inference of the causal relationship of results was not possible. It is suggested that, in the future, experimental studies be conducted to improve the degree of inference.
In addition, convenience sampling was used in the recruitment process without random assignment, making it impossible for the inferences to represent all stroke patients. It is suggested that the source of samples be expanded and the number of hospitals for recruitment be increased to improve the objectiveness and representativeness of the samples.
Moreover, MI intervention was conducted by a single researcher and the timing of the interviews varied. Therefore, patient degree of fatigue might have differed and impacted on internal validity.
Funding
We are grateful for the funding we received from the Cheng Ching Hospital, Taichung, Taiwan (R.O.C.) (CH10500196B). “The funders had no role in the design of the study; in the collection, analyses, interpretation of data; in the writing of the manuscript, in the decision to publish the results”.
References
1. World Health Organization. The top 10 causes of death. 2020 February 26. Retrieved from https://
www.who.int/news-room/fact-sheets/detail/the- top-10-causes-of-death
2. Ministry of Health and Welfare. Causes of Death in Taiwan, 2017. 2020 February 26. Retrieved
from https://dep.mohw.gov.tw/DOS/lp-4472-113.
html
3. Tse T, Douglas J, Lentin P, et al: Reduction in retained activity participation is associated with depressive symptoms 3 months after mild stroke:
An observational cohort study. J Rehabil Med Suppl 2017; 49: 120-127.
4. Towfighi A, Ovbiagele B, El Husseini N, et al:
Poststroke depression: A scientific statement for healthcare professionals from the American Heart Association/American Stroke Association. Stroke 2017; 48: e30-e43.
5. Harrison M, Ryan T, Gardiner C, Jones A: Psychological and emotional needs, assessment, and support post-stroke: A multi-perspective qualitative study.
Top Stroke Rehabil 2017; 24: 119-125.
6. Purton J: Stroke survivors’ experiences of upper limb dysfunction: A longitudinal exploratory study. Keele University, UK: Staffordshire; 2017.
7. Jørgensen TS, Wium-Andersen IK, Wium-Andersen MK, et al: Incidence of depression after stroke, and associated risk factors and mortality outcomes, in a large cohort of Danish patients. JAMA Psychiatry 2016; 73: 1032-1040.
8. Chen HM, Tu YH, Chen CM: Effect of continuity of care on quality of life in older adults with chronic diseases: A meta-analysis. Clin Nurs Res 2017; 26: 266-284.
9. Haggerty JL, Reid RJ, Freeman GK, et al: Continuity of care: A multidisciplinary review. Br Med J 2003;
327: 1219-1221.
10. Hadjistavropoulos H, Biem H, Sharpe D, et al:
Patient perceptions of hospital discharge: reliability and validity of a Patient Continuity of Care Questionnaire. Qual Health Care 2008; 20: 314-323.
11. Chen HM, Chen CM: A Chinese version of the patient continuity of care questionnaire: Reliability and validity assessment J Clin Nurs. 2017; 26: 1338- 1350.
12. Byers AM, Lamanna L, Rosenberg A: The effect of motivational interviewing after ischemic stroke on patient knowledge and patient satisfaction with care: A pilot study. J Neurosci Nurs 2010; 42: 312- 322.
13. Cheng D, Qu Z, Huang J, et al: Motivational interviewing for improving recovery after stroke.
Cochrane Libr 2015; 6. https://doi.org/10.1002/
14651858.CD011398.pub2
14. Barker-Collo S, Krishnamurthi R, Witt E, et al:
Improving adherence to secondary stroke prevention strategies through motivational interviewing:
Randomized controlled trial. Stroke 2015; 46: 3451- 3458.
15. Krishnamurthi R, Witt E, Barker‐Collo S, et al: Reducing recurrent stroke: Methodology of the motivational interviewing in stroke (MIST) randomized clinical trial. Int J Stroke 2014; 9: 133- 139.
16. Parekh K, Benningfield M, Burrows H, et al:
Motivational advising workshop: Utilizing motivational interviewing theory to facilitate and engage intrinsic motivation to change learners' behavior. MedEdPORTAL 2018; 14: 10751.
17. Lindson N, Thompson TP, Ferrey A, et al: (2019).
Motivational interviewing for smoking cessation.
Cochrane Database Syst Rev 2019; 7: 1-127.
18. Christie D, Channon S: The potential for motivational interviewing to improve outcomes in the management of diabetes and obesity in paediatric and adult populations: A clinical review. Diabetes Obes Metab 2014; 16: 381-387.
19. Lee WW, Choi K, Yum RW, et al: Effectiveness of motivational interviewing on lifestyle modification and health outcomes of clients at risk or diagnosed with cardiovascular diseases: A systematic review.
Int J Nurs Stud 2016; 53: 331-341.
20. Lee D, Kim S: The effects of group motivational interviewing compliance therapy on drug attitude, medicine application self-efficacy and medicine application in psychiatric patients. J Korean Acad Psychiatr Mental Health Nurses 2017; 26: 391- 401.
21. Faul F, Erdfelder E, Buchner A, et al: Statistical power analyses using G* Power 3.1: Tests for correlation and regression analyses. Behav Res Methods 2009; 41: 1149-1160.
22. Yeh HF, Shao JH: Exploring the relationship between heart failure symptom and diet self-efficiency old age patient as an example. Hungkuang Acad Rev 2015; 75: 1-11.
23. Prochaska JO, Velicer WF: The transtheoretical model of health behavior change. Am J Health
Promot 1997; 12: 38-48.
24. Prochaska JO, Redding CA, Evers KE, et al:
The transtheoretical model and stages of change.
Health Behav Theory Res Pract 2015: 125-148.
25. Sobell L and Sobell MJ: Motivational interviewing strategies and techniques: Rationales and examples, 2008. http://www.nova.edu/gsc/forms/mi_rationale_
techniques.pdf
26. Shah S, Vanclay F, Cooper B: Improving the sensitivity of the Barthel index for stroke rehabilitation. J Clin Epidemiol 1989; 42: 703-709.
27. Chen HM, Tzeng CY, Chen CM, et al: Validation and reliability testing of the patient continuity of care questionnaire in elderly with chronic diseases in Taiwan. J Nurs Healthc Res 2013; 9: 261-270.
28. Lee K, Ou Y, Chen S, Weng LJ: The psychometric properties of a short form of the CES-D used in the Taiwan longitudinal study on aging. Formosa J Ment Heal. 2009; 22: 383-410.
29. George D, Mallery P: IBM SPSS statistics 25 step by step: A simple guide and reference, fifteenth edition. New York, NY: Routledge; 2018.
30. Kim J, Thrift AG, Nelson MR, et al: Personalized medicine and stroke prevention: Where are we?
Vasc Health Risk Manag 2015; 11: 601.
31. Shin DW, Cho J, Yang HK, et al: Impact of continuity of care on mortality and health care costs:
A nationwide cohort study in Korea. Ann Fam Med 2014; 12: 534-541.
32. Sohl SJ, Birdee G, Elam R: Complementary tools to empower and sustain behavior change: Motivational interviewing and mindfulness. Am J Lifestyle Med 2016; 10: 429-436.
33. Auton MF, Patel K, Carter B, et al: Motivational interviewing post-stroke: An analysis of stroke survivors’ concerns and adjustment. Qual Health Res 2016; 26: 264-272.
34. Chung CH, Huang LY, Sun UJ: Hospital-based accountable family physicians’ system: the pilot study of community-based integrated care program.
Taipei City Med J 2016; 13: 72-79.
35. Watkins CL, Wathan JV, Leathley MJ, et al:
The 12-month effects of early motivational interviewing after acute stroke: A randomized controlled trial. Stroke 2011; 42: 1956-1961.