國立臺灣大學生物資源暨農學院森林環境暨資源學系 碩士論文
School of Forestry and Resource Conservation College of Bioresources and Agriculture
National Taiwan University Master Thesis
中越石灰岩溶植物
─報春苣苔屬與石山苣苔屬之葉綠體基因體
Plastomes of Primulina and Petrocodon
─ Two Characteristic Plant Genera of Sino-Vietnamese Limestone Flora
謝佳倫
Chia-Lun Hsieh
指導教授:鍾國芳 博士 Advisor: Kuo-Fang Chung Ph.D.
中華民國 107 年 1 月
January 2018
國 立臺大學碩士學位論文口試委員會審
定書
ii
謝辭
這篇論文的完成,必須感謝眾多師長與朋友的協助與鼓勵。首先要感謝我的 指導教授鍾國芳老師,在我碩士班期間引導我、鼓勵我,並幫助我解決研究上的 問題,和我討論研究的方向與論文的內容。感謝口試委員蘇惠君老師與劉少倫老 師,願意撥冗審閱論文,提供寶貴建議與匡正。
感謝廣西植物研究所許為斌博士等人和鍾國芳老師的合作,奠基了此研究的 材料收集,多次陪同或協助採集行程,並提供許多珍貴的植物材料。也感謝過去 與鍾國芳老師一同前往廣西、湖南等華南各地採集的研究室學長姊、許翊萱和朱 安雅。沒有大家的協助,勢必得花費極大的成本來獲得研究材料,謹致上由衷的 謝意。另外,非常感謝黃雅怡博士於基因體組裝上的協助,也感謝翁茂倫博士耐 心解惑我的疑問,使我組裝基因體的過程更加順利。
很感謝研究室學長姊與同學的協助與指導,一同度過歡樂的研究室生活與野 外採集時光。非常感謝劉世慧學姊於分析方法上提供寶貴的建議與幫助,並仔細 修改我的論文,使之更加完善;感謝黃群智學姊,帶領我熟悉分子技術相關實驗 與實驗室的注意事項;感謝曾妤馨學姊,平時和我討論各方面的研究知識並提出 許多精闢看法與建議,使我獲益良多;感謝游旨价學長,在研究之路上的督促與 鼓勵;感謝郭聞喜學長,和我討論資料的分析方法和實驗上的技術指導;感謝黃 郁嵐學長於研究上的建議,並總是邀我去野外看植物散心;很感謝許翊萱於實驗
初期的協助,萃取出許多良好品質的DNA 樣本,讓定序順利進行。感謝研究室
的所有人在這段時間的陪伴與指教,都是讓我能夠完成論文的莫大推手。
最後,我要感謝我的父母,雖然每每在野外時總是讓他們掛心,非常感謝他 們一直以來對我的包容與支持,最後我才能順利完成此論文研究。
Abstract
Primulina and Petrocodon, two characteristic Gesneriaceae genera of the
limestone flora in southern China and northern Vietnam, are featured by their exclusive habitat preference and remarkable diversity. The genome skimming strategy, which sequences genomic DNA in low coverage to recover the high copy portions and to increase the multiplex level of sequencing, was employed to obtain complete plastomes, mitochondrial exomes and nuclear ribosomal DNAs of eight Primulina and two Petrocodon species. Phylogenies based on the data from the three cell compartments
were reconstructed and compared. Additional eight Gesneriad plastomes (including five Primulina spp.) accessed online were incorporated in the comparative and phylogenetic
analyses. The newly sequenced plastomes are highly conserved in genome structures and gene contents. Although the phylogenies inferred from plastid, mitochondrial and nuclear data are incongruent, the well supported plastome phylogeny represents a backbone relationships of Primulina and its allies. The sequence divergence among plastomes of Primulina and Petrocodon were evaluated to identify variable regions which serve as potentially useful markers for systematic or population studies.
Key words: Genome skimming, Karst flora, Mitochondrial exome, Petrocodon, Plastome, Primulina.
iv
摘要
分布於中國華南與北越石灰岩地區之苦苣苔科(Gesneriaceae)報春苣苔屬 (Primulina)與石山苣苔屬(Petrocodon),擁有特殊的生境偏好與豐富的多樣性,為 當地喀斯特物種之代表類群。本研究採用基因體略讀(genome skimming)之定序策 略,定序八個報春苣苔屬與兩個石山苣苔屬物種之低覆蓋率(coverage)全基因體 資料,獲取在細胞中擁有高副本數(copy number)的葉綠體基因(plastome)、粒線體 外顯子體(mitochondria exome)與細胞核核醣體 DNA (nuclear ribosomal DNA)之序
列,並分別進行親緣關係樹的重建。此法不需透過成本較高的高覆蓋率定序,仍 可獲得大量資料,並能夠增加同時定序的樣本數量。此外,八個下載自基因銀行 (GenBank)的苦苣苔科物種之完整葉綠體基因體亦被納入基因體比較與親緣關係
分析。雖然不同胞器DNA 所重建之親緣關係樹存在許多不一致之處,但根據完
整葉綠體基因體重建之演化關係具有極高支持度,可作為報春苣苔屬與其近緣屬 間演化歷史之骨幹架構。藉由加入其他物種之序列進行比較,可得知所有納入分 析之葉綠體基因體於基因組成與基因體的結構上均相當保守。本研究亦藉由排列 比對報春苣苔屬與石山苣苔屬之完整葉綠體基因體序列,辨識出數個高變異的基 因體區段,可作為未來進行族群遺傳與親緣關係研究所需的高解析力分子標記。
關鍵字: 報春苣苔屬、石山苣苔屬、葉綠體基因體、粒線體外顯子體、基因體略
讀、喀斯特植物
Content
國立臺大學碩士學位論文口試委員會審定書 ... i
謝辭 ... ii
Abstract ... iii
摘要 ... iv
Content ... v
List of Figure ... vii
List of Table ... viii
1. Introduction ... 1
1.1 Gesneriaceae in karst landscape of southern China ... 1
1.2 Primulina and Petrocodon ... 2
1.2.1 Primulina Hance ... 2
1.2.2 Petrocodon Hance ... 4
1.3 General features of plastome ... 5
1.4 The application of cpDNA to plant systematics ... 7
1.5 Next generation sequencing and genome skimming ... 9
1.6 Goals of this study ... 12
2. Materials and Methods ... 13
2.1 Plant materials and taxon sampling ... 13
2.2 DNA extraction and next generation sequencing ... 15
2.3 Plastome assembly and validation ... 16
2.4 Plastome annotation ... 21
2.5 Plastome comparison ... 23
2.6 Plastome alignment, sequence divergence comparison and identification of variable regions ... 24
2.7 Plastome repeat analyses ... 25
2.8 Phylogenomic analyses based on plastomes ... 27
2.9 Mitochondrial exome assembly, alignment and phylogenetic reconstruction ... 28
vi
2.10 Nuclear ribosomal DNA assembly, alignment and phylogenetic analyses ... 30
3. Results... 32
3.1 Sequencing and assembly of plastomes... 32
3.2 Characteristics of Primulina and Petrocodon plastomes ... 33
3.3 Plastome comparison and identification of variable regions ... 38
3.4 IR/SC boundaries of Gesneriad plastomes ... 41
3.5 Repeat contents in Primulina and Petrocodon plastome ... 43
3.6 Chloroplast phylogenomic analyses ... 47
3.7 Assembly and phylogenetic analysis of mitochondrial exome... 48
3.8 Phylogenetic analysis of nuclear ribosomal sequences ... 49
4. Discussion ... 50
4.1 Highly conserved Primulina and Petrocodon plastomes ... 50
4.2 Variable regions identified for Primulina and Petrocodon ... 51
4.3 Annotation issues in plastome annotations ... 52
4.4 Incongruences between plastome phylogeny and previous studies ... 54
4.5 Incongruences among mitochondrial, nuclear and plastid phylogenies ... 56
4.6 Potential explanations for the incongruences ... 59
4.7 Utilities of mitochondrial data in plant phylogenetic analyses ... 63
5. Conclusion ... 64
6. References ... 66
7. Appendix ... 83
List of Figure
Fig. 1. The genomic iceberg explaining the concept of genome skimming. ... 11 Fig. 2. A brief workflow of plastome assembly. ... 19 Fig. 3. The chimeric alignment of read mapping in Geneious mapper. ... 20 Fig. 4. Identifying the IR/SC boundary by mapping reads to the extracted reference
sequence of IRA. ... 20 Fig. 5. The genome maps of Primulina and Petrocodon plastomes. ... 36 Fig. 6. The mVISTA genome similarity plot of 18 Gesneriaceae plastomes. ... 39 Fig. 7. The sliding window analysis of 15 Primulina and 2 Petrocodon plastomes
alignment with variable regions designated. ... 40 Fig. 8. The IR/SC boundary graph of 18 Gesneriaceae plastomes. ... 42 Fig. 9. Number of SSRs and its motif types in the ten newly sequenced plastomes. .. 45 Fig. 10. The numbers and locations of SSR of each species. ... 46 Fig. 11. The ML phylogeny inferred from complete plastomes of 18 Gesneriaceae
species. ... 47 Fig. 12. The ML phylogeny inferred from 26 mitochondrial protein coding genes of
11 Gesneriaceae species. ... 48 Fig. 13. The ML phylogeny inferred from nr DNA of 11 Gesneriaceae species. ... 49 Fig. 14. The comparison of ML phylogenetic trees inferred from plastomes (left) and
mitochondrial exome (right) data... 57 Fig. 15. The comparison of ML phylogenetic trees inferred from plastomes (left) and
nrDNA (right) data. ... 57 Fig. 16. The comparison of ML phylogenetic trees inferred from nrDNA (left) and mt exome (right) data. ... 58
viii
List of Table
Table 1. Statistics of the assembly in the newly sequenced taxa. ... 14
Table 2. Reference plastid genomes adopted in GeSeq annotating steps ... 22
Table 3. Plastome features of Gesneriaceae species. ... 35
Table 4. The gene contents of Primulina and Petrocodon plastomes. ... 37
Table 5. The locations and lengths of dispersed repeats of the ten plastomes. ... 44
1. Introduction
1.1 Gesneriaceae in karst landscape of southern China
Gesneriaceae Rich. & Juss. ex. DC., which comprises 150 – 160 genera and 3000 – 3500 species, is mainly distributed in the tropics and subtropics across the world (Weber, 2004; Skog and Boggan, 2006). In China, 41 genera and over 580 species have been recorded with, surprisingly, over 80% of endemism (Möller et al., 2016). Most of them are distributed in southern China, where is covered by extensive limestone landscape (or so called Karst topography) (Xu, 1995). Therefore, southern China was recognized as a hotspot for Chinese Gesneriaceae (Wei et al., 2004; Hou et al., 2010).
The karst environment plays an important role in the diversity of southern China flora (Xu, 1995; Hou et al., 2010) due to the complex and unique habitats it provides.
High salinity, high porosity and fragmented habitats are the general features of limestone karst, making the landscape unsuitable for ordinary plants to grow. However, many of the Gesneriaceae in southern China prefer, or even grow exclusively on the harsh environment of limestone bedrock or acidic soil type (Wei et al., 2004). The niche specificity of karst plants, along with the continual fragmentation of karst terrains, may facilitate allopatric speciation and isolation by distance, driving the speciation of those karst specialized plants, resulting the diverse limestone flora of southern China (Chang, 2012).
2
1.2 Primulina and Petrocodon 1.2.1 Primulina Hance
The genus Primulina Hance was established by H. F. Hance in 1883 as a monotypic genus containing only P. tabacum (Hance, 1883). Based on the molecular data, the genus was expanded to include Chirita Buch.-Ham. ex. D. Don section Gibbosaccus C. B. Clarke, Chiritopsis W. T. Wang and Wentsaiboea D. Fang & D. H.
Qin (Wang et al., 2011; Weber et al., 2011a). Before the revisions, the genus Chirita was morphologically diverse containing over 100 species with two-thirds of which belonged to the sect. Gibbosaccus, but has long been problematic in the generic and infra-generic delimitation (Li and Wang, 2007; Möller et al., 2009). The species number of sect. Gibbosaccus increased rapidly due to many new species found in southern China karst area. After the re-circumscription of Chirita and Primulina, the latter has become one of the largest genus of Old World Gesneriaceae largely owing to the inclusion of the species-rich Chirita sect. Gibbosaccus (Wang et al., 2011; Weber et al., 2011a). As many new species of Primulina that were being described until recent years, the genus is constantly increasing in species number (e.g., Yang et al., 2016; Wu et al., 2017; Yang et al., 2017; Tian et al., 2018). Primulina now contains over 170 predominantly calciphilous species growing almost exclusively on limestone area of southern China and few in northern Vietnam (Möller et al., 2016). These two regions
are collectively referred to as Sino-Vietnamese Karst, which is characterized by ubiquitous karst landscape and diverse flora (Xu, 1995).
The rich diversity, high endemism and strict habitat preference have made Primulina suitable materials for studying species divergence, adaptation and speciation
of limestone flora. However, many described species differ only among trivial morphological traits and some of them may be taxonomic synonyms (Christie et al., 2012) The diversity of the genus was probably overestimated (Weber et al., 2011a).
Recent studies showed that adopting both morphological and molecular data have facilitated the specific and generic delimitation in Primulina (e.g., Xu et al., 2012;
Chung et al., 2013; Pan et al., 2013; Xu et al., 2013). However, the evolutionary history of Primulina was not fully resolved due to the large species number and insufficient variability of the molecular makers (e.g., Kang et al., 2014; Guo et al., 2015). More informative molecular markers or sequence information are required to improve the resolution of the relationships among taxa and to answer more evolutionary questions of karst flora.
4
1.2.2 Petrocodon Hance
Petrocodon Hance is another calciphilous yet small Chinese Gesneriad genus
which is distributed in Karst topography of southern China with a few species in northern Indochina (Hance, 1883; Chen et al., 2014). The genus has been expanded by including the monotypic genera Calcareoboea C. Y. Wu ex. H. W. Li, Dolicholoma D.
Fang & W. T. Wang, Paralagarosolen Y. G. Wei, and Tengia Chun, plus all species from Lagarosolen W. T. Wang, three species from Didymocarpus Wall., one species from Wentsaiboea, and one species from Primulina based on earlier molecular phylogenies
(Möller et al., 2011; Wang et al., 2011; Weber et al., 2011a; Weber et al., 2011b; Xu et al., 2014). The molecular data support that these genera formed a well-supported
monophyletic group and is sister to Primulina (Möller et al., 2011; Wang et al., 2011;
Weber et al., 2011a; Weber et al., 2011b; Xu et al., 2014). Regarding to the various genera it had accommodated after the re-circumscription, Petrocodon now comprises about 30 species with extreme morphological diversity, especially in floral characteristics (Weber et al., 2011b; Wen et al., 2012; Xu et al., 2014; Möller et al., 2016; Cen et al., 2017; Lu et al., 2017). Weber et al. (2011b) considered the amazing variations in floral morphologies the consequence of rapid radiation evolving into various pollination syndromes. Therefore, Petrocodon is particularly ideal for studying floral evolutionary changes.
1.3 General features of plastome
The chloroplast (cp) is a vital organelle for the survival of plants. Although a majority of the cp genes had transferred to the nuclear genome (Martin et al., 2002), the endosymbiotic origin makes the plastid retains its own genome with multiple copies per organelle and be able to replicate by itself (Gray and Archibald, 2012). The remaining genes encoded in land plant plastomes are mainly responsible for photosynthesis and housekeeping functions, such as transcription and translation (Bock, 2007; Wicke et al., 2011). Most of the land plant plastomes contain about 110 – 130 genes including 8 rRNA genes (4 duplicated genes in IRs), 30 – 35 tRNA genes and about 70 – 88 protein coding genes depending on plant lineages (Wicke and Schneeweiss, 2015). The gene content and the coding sequences are quite conserved across various lineages of land plants (Palmer and Stein, 1986; Wolf, 2012) because of the strong selective pressure acting on the genes, and the genes are crucial to the survival of plants (Rochaix, 1997).
The genome size of most of the land plant plastomes is more or less than 150 kb while ranging from 107 kb (Cathaya argyrophylla; Lin et al., 2010) to 218 kb (Pelarogium; Chumley et al., 2006), and it is not correlated with the nuclear genome size (Daniell et al., 2016). The structure and gene orders of plastome is highly conserved among land plants as well (Palmer and Stein, 1986). The typical image of a
6
plastome is represented as a circular chromosome consisting of two large rRNA- encoding inverted repeats (IRs) separated by a long single copy (LSC) and a short single copy (SSC) regions, forming a quadripartite structure (Kolodner and Tewari, 1979;
Palmer, 1985). The presence of two copies of IR enables the flip-flop recombination which results in isoforms of different orientations of the single copy regions (Palmer, 1983; Martin et al., 2013). However, some studies have shown that the shapes of plastid DNAs are not necessarily circular with many of them found to be concatenated linear or branched, and probably vary among different lineages or stages of plastid development (Lilly et al., 2001; Bendich, 2004; Oldenburg and Bendich, 2004; Shaver et al., 2008). To be consistent with general publications of plastomes, the plastomes
newly sequenced in this study were mapped to a circular conformation.
The inheritance of angiosperm plastids has long been thought to be predominantly maternal (Corriveau and Coleman, 1988; Birky, 1995; Mogensen, 1996; Zhang et al., 2003; Hagemann, 2004). However, accumulating evidence has shown that some lineages exhibit bi-parental (e.g., Meyer and Stubbe, 1974; Metzlaff et al., 1981; Nagata et al., 1999) or even paternal inheritance (Actinidia; Testolin and Cipriani, 1997). The uniparental transmission of organelle is probably evolutionarily unstable (Greiner et al., 2015).
1.4 The application of cpDNA to plant systematics
In plant molecular systematics, the chloroplast DNA (cpDNA) has been a popular and frequently adopted source of markers in the past few decades (Palmer et al., 1988;
Soltis and Soltis, 1998; Shaw et al., 2005; Shaw et al., 2014), even though the cpDNA evolves about half of the speed of nuclear DNA (Wolfe et al., 1987). Despite the conserve nature, other characteristics of cpDNA, such as multiple copies, uniparental inheritance and the relatively small, haploid genome, make it an easily accessible data source representing a single genealogical history, which is convenient to phylogenetic analyses (Palmer et al., 1988; Kelchner, 2000). These features of cpDNA can avoid the problems caused by recombination, polyploidy, or paralogues when using nuclear data (Feliner and Rosselló, 2007). Moreover, by comparing the phylogenetic histories inferred from cpDNA with nuclear phylogenies, hybridization hypotheses could be tested (e.g., Sang et al., 1997; Isoda et al., 2000; Barber et al., 2007). With respect to highly conserved coding parts of plastome, intergenic regions have been employed and were proved to be useful to resolve phylogenies at lower taxonomic level (e.g., Shaw et al., 2005; Shaw et al., 2007; Shaw et al., 2014). However, the tiny fractions of
cpDNA amplified by PCR were not informative enough to resolve the relationships of many taxon-rich, radiated, or phylogenetically recalcitrant groups (e.g., Knox and Palmer, 1995; Turner et al., 2013). Applying larger numbers of molecular markers or
8
longer sequences have been suggested to improve the resolution for the phylogenetic studies (Parks et al., 2009).
The advances in the sequencing technology, that is to say, the Next Generation Sequencing (NGS), in the past decade have made genome-scale data more available and affordable (Niedringhaus et al., 2011). As a result, there have been over 1300 complete plastome sequences deposited in GenBank until 2016 (Tonti-Filippini et al., 2017). Many studies have utilized the whole or partial plastome sequences to conduct phylogenomic analyses, yielding highly resolved phylogenetic trees (Parks et al., 2009).
This has been proven effective to resolve phylogenetic relationship of various taxonomic level ranging from intraspecific level (Parks et al., 2009) to deep phylogeny among entire green plants (Ruhfel et al., 2014).
The soaring number of plastid genomes being sequenced has also allowed a wide range of plant plastomes to be compared, facilitating our understanding of plastome evolution such as the seldom observed structural rearrangements or gene loss events (e.g., Ku et al., 2013; Lei et al., 2016; Song et al., 2017). It is the conserved nature of plastid structure that makes inversions or gene/intron losses powerful characters to build phylogeny. For instance, Graham et al. (2000) have utilized the characters of indels and inversions in plastomes to decipher the deep phylogenetic relationship of basal angiosperms.
1.5 Next generation sequencing and genome skimming
While traditional methods like Sanger sequencing only retrieve small fractions of DNA from the vast genome, NGS can sequence tens of thousands of short reads simultaneously, generating enormous molecular data in a short period of time (Niedringhaus et al., 2011). To overcome the sequencing errors inherent to high throughput sequencers and to compensate for the shorter read length comparing to traditional PCR data, the same genomic site must be sequenced multiple times. This is the concept called ‘coverage’, or ‘sequencing depth’ of the NGS data (El-Metwally et al., 2014). It is the short but numerous reads assembled into an intact molecule with
enough coverage that the correct and complete genome is recovered (El-Metwally et al., 2014). However, generating a complete nuclear genome with enough coverage
requires expensive and laborious efforts, especially for the colossal genome of most of the plants. Moreover, since the sequence information of every single instrumental run of the NGS output is inevitably immense, it still costs quite a lot even though the cost of sequencing per base has dropped dramatically in recent years (Niedringhaus et al., 2011). How to minimize the cost and maximize the value of NGS techniques is an important concern? To be cost-effective, several approaches of genome reduction methods, such as target enrichment and RAD-seq, have been developed just to sequence parts of the genome (Cronn et al., 2012) by modifying the library preparation protocols
10
before the sequencing reactions.
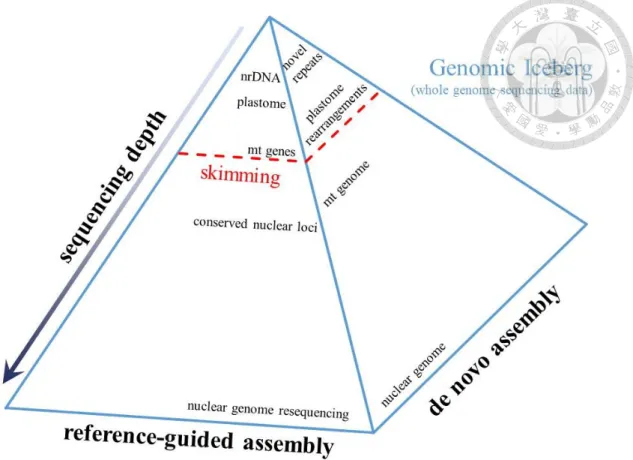
An alternative way is to sequence a complete set of cellular DNA (Fig. 1) with low coverage, a method which may not be sufficient to recover the complete nuclear genome, but is desirable for those high copy portions in the cell, such as organelle genomes (plastids and mitochondria) and nuclear ribosomal DNAs (nrDNAs). This method which is named genome skimming (Straub et al., 2012; Fig. 1), or genome surveying sequencing (Steele et al., 2012) is amenable to multiplexing several samples in a single lane, raising the efficiency and reducing the cost of each run. Comparing to genome reduction methods, the library preparation steps of genome skimming are relatively simple for processing only the total cellular DNA without any enzymatic treatment or sequence baiting (Straub et al., 2012). The method is particularly suitable for acquiring the phylogenetically useful plastome data, and has been applied extensively to the studies working on the comparative genomics and phylogenomic analyses using cpDNA (e.g., Malé et al., 2014; Zhang et al., 2015). Not only can genome skimming obtain plastome, but also it can recover the high copy nrDNAs and partial mitochondrial genome which may provide different genealogical insights to be compared (Henriquez et al., 2014).
Fig. 1. The genomic iceberg explaining the concept of genome skimming.
The whole genome sequencing data is analogized as a genomic iceberg. To obtain the data in lower part of the iceberg, deeper sequencing depth is required. To reduce cost and increase efficiency, the genome skimming method only ‘skim’ the uppermost part (nrDNA, plastome and mt genes) of the iceberg, as indicated by the red dashed line.
The figure is modified from Straub et al. (2012).
12
1.6 Goals of this study
Primulina and Petrocodon, being two characteristic genera of karst regions, can
serve as decent materials to conduct evolutionary studies of limestone plants, probing into the underlying processes and mechanisms of plant evolution in this specific habitat.
To resolve their phylogenetic relationships more robustly, I explored the complete plastome as an informative data source by using the genome skimming approach to reduce cost and increase sampling. The mitochondrial data, which is unpopular to systematics, and the nuclear ribosomal DNA can be acquired by this sequencing strategy as well to serve as different genealogical histories and to be compared with plastid data. Therefore, the study is aimed to:
(1) Sequence and assemble the complete plastomes of two limestone characteristic genera, Primulina and Petrocodon, by genome skimming methodology;
(2) Retrieve sequences from other cell compartments, mitochondria and nuclear (for nrDNA), to infer phylogenies and compare them to plastome data;
(3) Reconstruct the phylogenetic relationship using the newly sequenced and other published Gesneriaceae plastomes to provide a backbone relationship of the family;
(4) Identify variable regions among Primulina and related genera based on the aligned plastomes as applicable markers to better resolve the genus in the future.
2. Materials and Methods
2.1 Plant materials and taxon sampling
The plant materials were collected from the field expedition in Guangxi and Hunan, as well as the Guangxi Botanical Garden in 2015. The voucher specimens were deposited at Herbarium of Biodiversity Research Center, Academia Sinica, Taipei (HAST). Fresh leaves were dried by silica gel to preserve the DNA contents.
The taxa sequenced in this study were chosen as diverged as possible to represent each clades in the phylogenies of Primulina referring to the results of Guo et al. (2015).
Petrocodon was also included as a sister group to Primulina. Regarding to the
concentration and quality of extracted DNA, 11 samples with nine Primulina and two Petrocodon species were sent to the library preparation steps (Table 1).
In addition, the complete plastomes of five Primulina species (P. brachytricha var.
magnibracteata (W. T. Wang & D. Y. Chen) Mich. Möller & A. Weber, P. eburnea
(Hance) Y. Z. Wang, P. huaijiensis Z. L. Ning & J. Wang, P. liboensis (W. T. Wang &
D. Y. Chen) Mich. Möller & A. Weber, P. linearifolia (W. T. Wang) Y. Z. Wang) and three other Gesneriad species (Boea hygrometrica (Bunge) R.Br., Lysionotus pauciflorus Maxim, and Haberlea rhodopensis Friv.) (Table 1 and Table 3), which are accessible in the GenBank to date, were also included in the comparative genomic analyses.
14
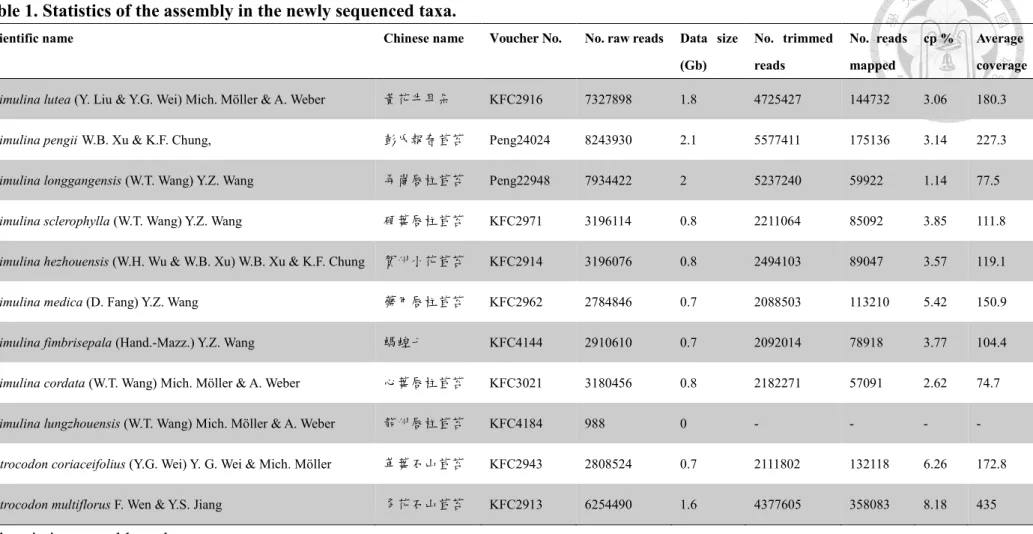
Table 1. Statistics of the assembly in the newly sequenced taxa.
Scientific name Chinese name Voucher No. No. raw reads Data size
(Gb)
No. trimmed reads
No. reads mapped
cp % Average coverage
Primulina lutea (Y. Liu & Y.G. Wei) Mich. Möller & A. Weber 黃花牛耳朵 KFC2916 7327898 1.8 4725427 144732 3.06 180.3
Primulina pengiiW.B. Xu & K.F. Chung, 彭氏報春苣苔 Peng24024 8243930 2.1 5577411 175136 3.14 227.3
Primulina longgangensis (W.T. Wang) Y.Z. Wang 弄崗唇柱苣苔 Peng22948 7934422 2 5237240 59922 1.14 77.5
Primulina sclerophylla (W.T. Wang) Y.Z. Wang 硬葉唇柱苣苔 KFC2971 3196114 0.8 2211064 85092 3.85 111.8
Primulina hezhouensis (W.H. Wu & W.B. Xu) W.B. Xu & K.F. Chung 賀州小花苣苔 KFC2914 3196076 0.8 2494103 89047 3.57 119.1
Primulina medica (D. Fang) Y.Z. Wang 藥用唇柱苣苔 KFC2962 2784846 0.7 2088503 113210 5.42 150.9
Primulina fimbrisepala (Hand.-Mazz.) Y.Z. Wang 螞蝗七 KFC4144 2910610 0.7 2092014 78918 3.77 104.4
Primulina cordata (W.T. Wang) Mich. Möller & A. Weber 心葉唇柱苣苔 KFC3021 3180456 0.8 2182271 57091 2.62 74.7
Primulina lungzhouensis (W.T. Wang) Mich. Möller & A. Weber 龍州唇柱苣苔 KFC4184 988 0 - - - -
Petrocodon coriaceifolius (Y.G. Wei) Y. G. Wei & Mich. Möller 革葉石山苣苔 KFC2943 2808524 0.7 2111802 132118 6.26 172.8
Petrocodon multiflorus F. Wen & Y.S. Jiang 多花石山苣苔 KFC2913 6254490 1.6 4377605 358083 8.18 435
Abbreviation: cp: chloroplast.
14
2.2 DNA extraction and next generation sequencing
The total genomic DNA of each samples was extracted by modified CTAB method (Doyle and Doyle, 1987, 1990) from 0.01 g of silica gel dried leaves which were frozen by liquid nitrogen and ground into powder. The quantity and quality of extracted DNA were checked by 1% gel electrophoresis, Nanodrop 2000 (Thermo Scientific Inc., Carlsbad, CA, USA) and Qubit Fluorometer (Thermo Scientific).
The DNA samples passing the quality checks were sent to High Throughput Genomics Core at Biodiversity Research Center, Academia Sinica (BRCAS) to conduct library preparation and next generation sequencing. The DNA library were constructed by using TruSeq Nano DNA Library Prep kit (Illumina Inc., San Diego, CA, USA) following manufacturer’s instruction with insert size 550 bp in length. Indexed DNA libraries were sequenced by Illumina MiSeq System (Illumina) in pair-end mode with read length = 300 bp. In total of 11 of my samples plus five samples of other species for other research projects were multiplexed in one flow cell of the sequencing machine which contains only lane.
16
2.3 Plastome assembly and validation
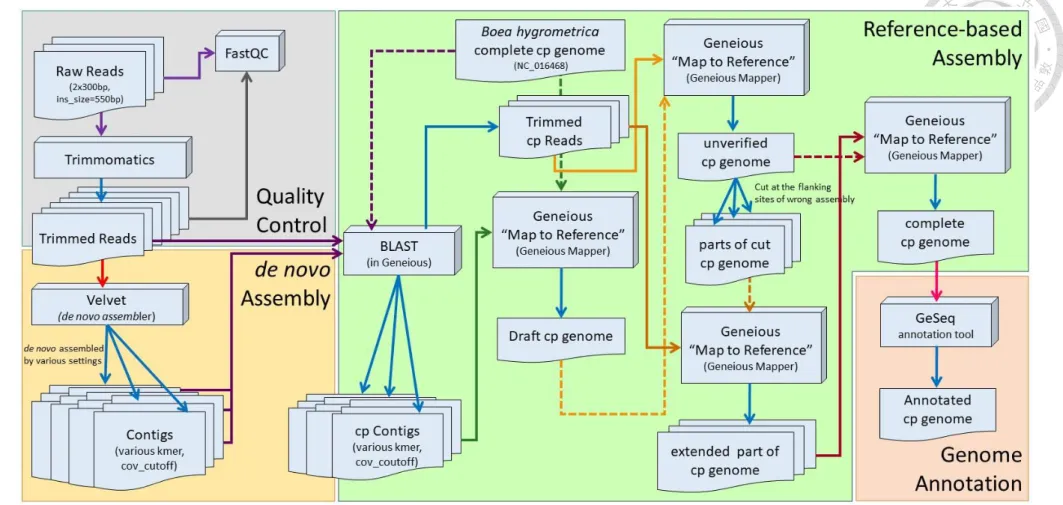
A brief work flow of the plastome assembly is presented in Fig. 2. First, The sequencing quality of raw reads were evaluated via FastQC v0.11.5 (Andrews, 2010).
Low quality portions of the reads were trimmed and filtered by Trimmomatic 0.36 (Bolger et al., 2014) with the setting of LEADING:25 TRAILING:25 SLIDINGWINDOW:4:20 MINLEN:200. The trimmed reads were then de novo assembled by Velvet assembler (Zerbino and Birney, 2008) with various combination of settings (kmer=141–181 with interval= 4; -cov_cutoff 50/100/200; -min_contig_lgth 100; -scaffolding yes/no), generating multiple contig files for each samples. Since the assembly is primarily purposed to recover the plastid DNA, higher coverage cutoff value will leave more contigs belonging to plastomes, which have multiple copies per cell. The number of contigs and N50 value of each combinations of different settings were compared to each other. For each samples, 6 – 10 contig files which have higher N50 value, fewer contigs number and longer overall contig length were chosen and imported into Geneious R10 (Kearse et al., 2012) for subsequent analyses.
Second, the imported contigs and trimmed reads files were filter by Basic Local Alignment Tool (BLAST) in Geneious against the reference B. hygrometrica cp (Bhcp) genome (Zhang et al., 2012) with Megablast mode and Max E-value= 10-5 to separate chloroplast and non-chloroplast reads or contigs. All the filtered cp contigs files of the
same species were then mapped to the reference Bhcp genome to construct a draft plastome sequence by using ‘Map to Reference’ function in Geneious with ‘Medium- Low Sensitivity / Fast’ and ‘Iterate up to 25 times’ settings. The consensus sequence representing draft plastome of each species was generated with 50% masking threshold, and a question mark masked areas with coverage under 1×. Next, the trimmed cp reads were mapped to the draft genome by using ‘Map to Reference’ function and consensus sequence was generated in Geneious with the same settings as the previous step to fill the gaps. To validate the gap-filled genome, the trimmed cp reads were mapped back to the latest consensus again. By screening the read mapping condition across each sites of the plastome, I were able to find out and mark the regions with problematic assemblies. The structural differences, which are usually large insertions and deletions in length of 50 – 300 bp or longer that cannot be detected by read mapping method, between reference and my species may cause the reads mapped on the genome forming a ‘chimeric alignment’ (Fig. 3). To solve this problem, the draft sequence were cut into pieces and were mapped by reads of the same species to extend the contigs. The draft sequences were cut at flanking sites upstream and downstream to the problematic regions to avoid extracting incorrect sequences being extracted. The cut parts were served as references being mapped by the trimmed reads by using ‘Map to Reference’
function with default settings except iterating up to 100 times in order to extend
18
sequences from the breaking points of the genome pieces. After generating consensus from the mapping result of each fragments cut from the draft genome, these extended pieces (consensus of the mapping) were mapped back to the draft genome, from which the pieces were cut. The extensions from the cutting sites would form overlapping sequences after the mapping, recovering the correct sequence of that species. Lastly, the trimmed cp reads were mapped back to the corrected plastome sequence to check overall correctness and to estimate the average coverage of each plastomes.
The IR/SC boundaries of each species were determined by mapping the cp reads to the extracted IR sequence of Bhcp genome. The boundary of IR/SC become apparent because of the different ends (5’ and 3’ ends) of the SC represented by the reads will show two types of distinct sequence contents even if the read mapping of the query species shows different boundary position from the reference IR (Fig. 4).
Fig. 2. A brief workflow of plastome assembly.
Blue arrow indicates the output of each steps. The rest of the different colors of arrows indicate each different step of assembly. The data served as reference sequence(s) for read mapping or blasting were connected with dash line to the tools that it were input. The boxes shown in 2D indicate the various files of sequences or contigs. The boxed shown in 3D indicate different analyzing tools.
19
20
Fig. 3. The chimeric alignment of read mapping in Geneious mapper.
The chimeric alignment was caused by the large indels between the query species and the reference sequence. The disagreements between the reads and reference were highlighted by blue blocks.
Fig. 4. Identifying the IR/SC boundary by mapping reads to the extracted reference sequence of IRA.
The IRA sequence was extracted and served as a reference to be mapped by the reads of the species whose IR/SC boundaries were not sure yet. By mapping the reads back to the extracted IR sequence, the boundary of the query species would be clear, for the different ends of SC will be aligned together showing two distinct types of sequence contents.
2.4 Plastome annotation
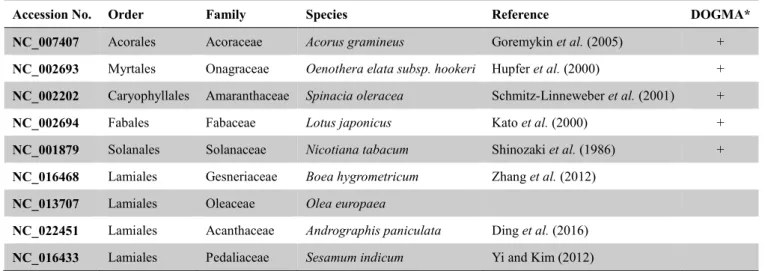
Instead of the widely used plastome annotation tool, DOGMA (Wyman et al., 2004), I adopted GeSeq (Tillich et al., 2017) web tool which provides more customized settings than DOGMA to perform primary annotation, then using ‘transfer annotation’
function in Geneious for the secondary annotation. The GeSeq annotator also integrates several third-party tRNA annotation tools which may be needed after the DOGMA annotation to confirm the presence of tRNA genes.
First, I chose two plastomes (P. lutea and Pet. multiflorus) representing two genera to be annotated by GeSeq with the following settings: BLAT protein search identity=
90; BLAT rRNA, tRNA, DNA search Identity= 95; 3rd party tRNA annotators, tRNAscan-SE v1.3.1 (Lowe and Eddy, 1997) activated with Mitochondria/Chloroplast Search Mode and default settings. Among the reference plastomes available in GeSeq server, nine were chosen containing five diverged species adopted in DOGMA and four Lamiales, to which is the order that Gesneriaceae belongs, species (Table 2).
Next, the results of annotation were visualized by viewing the genome maps output by GeSeq, which integrated OrganellarGenomeDRAW (OGDRAW; Lohse et al., 2013) to construct the figure. The newly generated .gb files from GeSeq were downloaded and imported into Geneious to check gene boundaries and to delete the redundant annotations by mapping the extracted genes of Bhcp genome. To verify the correct
22
anticodon names and length of each tRNA genes, sequences of each tRNA genes were searched in the online server version of tRNAscan-SE (Lowe and Chan, 2016).
Furthermore, genes with extremely short exons (petB, petD) or the notable trans- splicing genes (rps12), which were often annotated erroneously (Tonti-Filippini et al., 2017), were checked and annotated carefully by manual curation under Geneious. After the plastomes of P. lutea and Pet. multiflorus being completely annotated, they were mapped to each of the remaining unannotated plastomes of the same genera, and the
‘transfer annotation’ function in Geneious was applied to transfer annotation from the annotated genome to the unannotated one. Finally, the annotated plastomes of every species were aligned by MAFFT (Katoh et al., 2002) with default settings in Geneious, and the coding regions were shown in translated amino acid sequence to check the correctness of annotations. By inputting the Genbank format (.gb) files generated by
Geneious, the genome maps were drawn by OGDRAW (Lohse et al., 2013).
Table 2. Reference plastid genomes adopted in GeSeq annotating steps
*The reference genome that was adopted in DOGMA was marked as ‘+’.
Accession No. Order Family Species Reference DOGMA*
NC_007407 Acorales Acoraceae Acorus gramineus Goremykin et al. (2005) + NC_002693 Myrtales Onagraceae Oenothera elata subsp. hookeri Hupfer et al. (2000) + NC_002202 Caryophyllales Amaranthaceae Spinacia oleracea Schmitz-Linneweber et al. (2001) +
NC_002694 Fabales Fabaceae Lotus japonicus Kato et al. (2000) +
NC_001879 Solanales Solanaceae Nicotiana tabacum Shinozaki et al. (1986) + NC_016468 Lamiales Gesneriaceae Boea hygrometricum Zhang et al. (2012)
NC_013707 Lamiales Oleaceae Olea europaea
NC_022451 Lamiales Acanthaceae Andrographis paniculata Ding et al. (2016) NC_016433 Lamiales Pedaliaceae Sesamum indicum Yi and Kim (2012)
2.5 Plastome comparison
To compare the plastome sequences of different Gesneriaceae species, sequence files of 18 Gesneriad plastomes were uploaded to mVISTA (Frazer et al., 2004) website to generate the similarity plot under the Shuffle-LAGAN mode which is able to improve the alignment of distant homologues. The sequence as well as the annotations of P. lutea were used as the reference for the similarity comparison. The plot was further edited in Adobe Illustrator CC (Adobe Systems, Inc., USA). The IRB regions of each plastomes in the alignment plot were removed to reduce redundancy.
The locations of the IR/SC boundaries and each genes flanking the boundaries were checked under the visualized interface of Geneious. The comparison of IR/SC boundaries of each Gesneriad plastomes were drawn in graph by using Adobe Illustrator CC (Adobe Systems, Inc.).
24
2.6 Plastome alignment, sequence divergence comparison and identification of variable regions
. To develop molecular markers applicable to intrageneric systematic studies, especially for resolving relationships among Primulina species, only the plastomes of Primulina and Petrocodon were included in this analysis. The ten successfully
recovered plastomes of Primulina and Petrocodon generated in this study plus five Primulina plastomes downloaded from GenBank were aligned by MAFFT (Katoh et al., 2002) with default settings in Geneious. The sequence divergence of 16 plastid
genomes were estimated by the sliding window analysis performed in DnaSP 6 (Librado and Rozas, 2009) with window length of 800 bp and step size of 200 bp. The output data were plotted by Microsoft Excel with Pi value as y-axis. By referring to the method of Thomson et al. (2017), the regions with the windows of Pi values over 95th percentile (Pi value higher than or near to 0.02) were marked as variable regions, which are potentially useful for phylogenetic analyses.
2.7 Plastome repeat analyses
The repeat contents of plastome is often considered to be rare in number comparing to the nuclear genome with the exception of the presence of two large IRs (Palmer, 1991). Many of them have been proven to be useful in population genetics to evaluate the divergence between populations or close related species (e.g., Powell et al., 1995; Cato and Richardson, 1996; Bryan et al., 1999; Provan et al., 2001). Hence, I searched the ten successfully assembled plastomes of this study for two main categories of repeats, the simple sequence repeats (SSRs, or microsatellites with motif repeating in mono-, di-, tri-, tetra-, penta-, and hexa- nucleotide units) and the dispersed repeats.
To avoid redundancy, the following repeat analyses were performed on the plastomes containing only one IR. Currently, no universal criterion for the definitions of SSRs or dispersed repeats. I adopted the most frequently used criteria for each analyses after reviewing several similar studies (e.g., Martin et al., 2013; Ni et al., 2016; Jiang et al., 2017) .
The SSR contents were detected by the Perl script MISA (Beier et al., 2017) with the threshold of ten repeat units for mononucleotide SSRs, five repeat units for dinucleotide SSRs, four repeat units for trinucleotide SSRs, and three repeat units for tetra-, penta-, and hexanucleotide SSRs.
26
The dispersed repeats, which can be further divided into direct, reverse and palindromic repeats, were identified by REPuter (Kurtz et al., 2001) with the minimum repeat size of 30 bp, 90 % or greater repeat identity by setting Hamming distance of 3.
The repeats overlapping to its own copy or to other repeats were excluded.
2.8 Phylogenomic analyses based on plastomes
The ten complete plastomes assembled in this study plus eight other Gesneriad plastomes downloaded from GenBank (Table 3) were aligned by MAFFT (Katoh et al., 2002) with default settings in Geneious and exported as NEXUS file. The alignment file was then imported into jModelTest 2.1.10 (Guindon and Gascuel, 2003; Darriba et al., 2012) to test the nucleotide substitution models with default settings. By referring
to the Akaike information criterion (AIC), the GTR+GAMMA+I model was suggested.
The phylogenetic analysis based on maximum likelihood (ML) method using the model selected by jModelTest was performed by RAxML (Stamatakis, 2014) in Geneious with
‘rapid bootstrapping and search for best-scoring ML tree’ and bootstrap analysis with 500 replications to estimate branch support. The only European species, Haberlea rhodopensis, in the alignment was set as outgroup in the analysis. The phylogeny was drawn via FigTree v1.4.2.
28
2.9 Mitochondrial exome assembly, alignment and phylogenetic reconstruction
Plant mitochondrial genomes are well known for its dynamic genome structure and the larger genome size with low portion of coding regions comparing to plastid (Alverson et al., 2010; Mower et al., 2012). These characteristics have made the assembly of mitochondrial genome a difficult task. For genome skimming data, despite the recovery of complete mitochondrial genome being impossible, it is not difficult to retrieve the coding sequences alone (Straub et al., 2012). The mitochondrial part still provides another unexplored information.
I tried to obtain mitochondria genes by mapping the filtered, non-plastid reads to each of the extracted exons separately from B. hygrometrica mitochondrial (Bhmt) genome (Zhang et al., 2012), which has been the most close-related reference. After read mapping and checking start and stop codons of each genes, the consensus sequences of each exons were extracted. All the consensus sequences were concatenated in the order of the name of the exons and genes.
The concatenated exomes of each species, together with the concatenation of extracted CDS from Bhmt genome, were aligned by MAFFT with default settings in Geneious and exported to jModelTest to test the substitution model. The best model selected by the previous analysis were chosen for reconstructing ML phylogenetic tree
by using RAxML in Geneious with the settings as those performed in plastome phylogenetic analyses, but the alignment of mt exomes being further partitioned by three different codon positions. The concatenated Bhmt exome was set as outgroup of the analysis. The output tree file was drawn into graph by FigTree v1.4.2.
30
2.10 Nuclear ribosomal DNA assembly, alignment and phylogenetic analyses
Nuclear ribosomal DNA (nrDNA) usually appears in tandem repeats, possessing multiple copies in plant genomes (Appels and Honeycutt, 1986; Rogers and Bendich, 1987) which makes it easy to be recovered under the genome skimming method. The two internal transcribed spacers (ITS1 and ITS2) between three ribosomal subunits genes of nrDNA have been another frequently used markers for plant systematics other than plastid DNA (Álvarez and Wendel, 2003). I tried to recover the complete cistron of nrDNA, which contains 18S, 5.8S, 26S genes, and ITS1, ITS2 sequences, aiming to reconstruct a phylogeny representing the nuclear genealogy.
The ITS sequence of P. pengii (GenBank accession number: KF498139) were chosen as the reference sequence to be mapped by the cp-excluded reads of P. pengii by Geneious mapper (‘map to reference’ function) with the same setting as the assembly of mt exomes. Since the18S and 26S gene of the ITS sequence of P. pengii were not completely sequenced, the ribosomal genes in the result of read mapping cannot be fully annotated. The nrDNA sequence with full length of ribosomal genes of Perilla citriodora (Nakai) Makino (GenBank accession number: KT220699) was mapped to the consensus extracted from the read mapping results of P. pengii to annotate the ribosomal genes. After the annotation, the complete nrDNA cistron of P. pengii was
extracted and then served as a reference for the rest of the samples for nrDNA cistron assembly.
The DNA of studied species together with the B. hygrometrica ITS sequence (GenBank accession number: KU203783) were aligned by MAFFT in Geneious with default setting. The alignment was imported to jModelTest to test the appropriate nucleotide substitution models by inferring to AIC. The ML phylogenetic tree was reconstructed by RAxML under Geneious with rapid bootstrapping of 500 times and B.
hygrometrica was set as an outgroup. The resulting tree file was further visualized by FigTree.
32
3. Results
3.1 Sequencing and assembly of plastomes
Among the 11 species being sent to library preparation and sequencing, the output of P. lungzhouensis was almost empty. This might result from the low quantity and poor quality of this DNA sample. Except the failed one, the remaining ten samples have been sequenced successfully with output data size ranging from 0.7 – 2.1 Gb. By calculating the number of the reads mapped to assemble the plastome, the average coverage of each plastome assembled were estimated. The coverage of most of the assembled plastomes were over 100× with two species being about 70× (Table 1).
The proportion of plastid DNA to the total extracted genomic DNA were also estimated by recording the number of cp reads mapped to the complete plastomes of the same species divided by the number of the total trimmed reads. The cp reads of Primulina and Petrocodon species accounted for c.a. 5% of the genomic DNA (with
the range of 0.96 – 6.3%) (Table 1). It is basically congruent with the results from several studies about plastid DNA proportion in a cell (Bendich, 1987; Straub et al., 2012). However, the amount of cpDNA varies considerably among different stages of leave development and the cell types (Rauwolf et al., 2009; Rowan et al., 2009; Straub et al., 2012). The proportion of cpDNA to nuclear DNA is an important consideration for increasing the multiplexing level of genome skimming data (Straub et al., 2012).
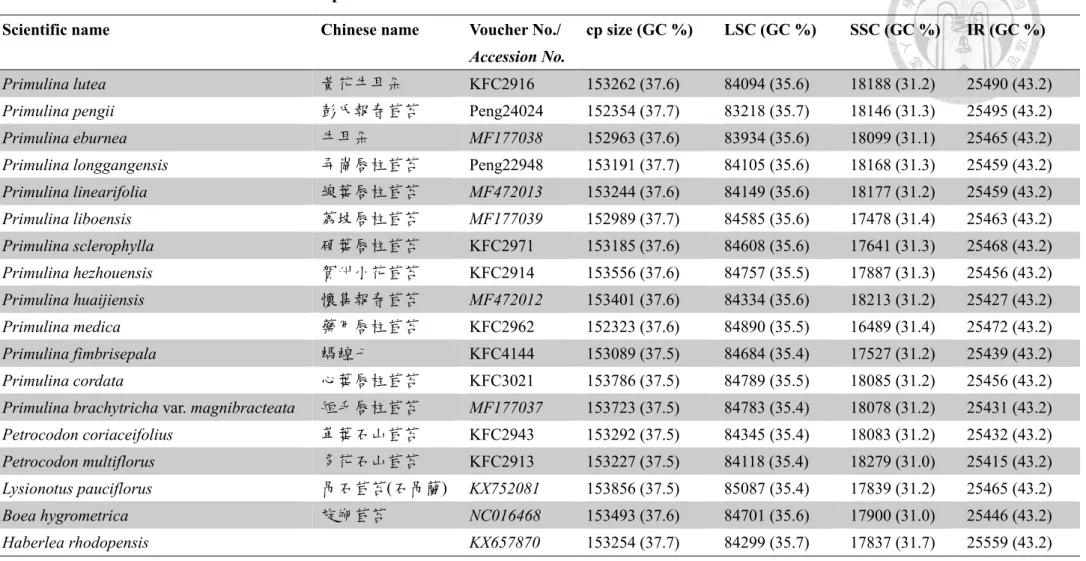
3.2 Characteristics of Primulina and Petrocodon plastomes
Sizes of the complete plastomes of the ten newly sequenced species ranged from 152323 bp (P. medica) to 153786 bp (P. cordata) (Table 3). Among these newly generated plastomes, the length of LSC ranging from 83218 bp (P. pengii) to 84890 bp (P. medica), the length of IRs ranging from 25415 bp (Pet. multiflorus) to 25495 bp (P.
pengii), and the length of SSC ranging from 16489 bp (P. medica) to 18279 bp (Pet.
multiflorus) (Table 3). The GC contents of assembled plastomes ranged from 37.5 –
37.6 % indicating the obviously AT-biased sequence content of the plastome which is consistent with most of the plant species (Shimada and Sugiura, 1991). However, the GC contents of IR are significantly higher than the values in SC regions (Fig. 5 and Table 3).
In the plastomes of Primulina and Petrocodon, no pseudogene, which is defined as genes possessing immature stop codon(s), was detected. The gene contents of the eight Primulina and two Petrocodon plastomes are identical. They harbor in total of 111 different genes, including 80 different protein coding genes, 27 different tRNA genes, and four different rRNA genes (Table 4). Among the 111 genes, 19 were completely duplicated in IR and three (rps19, ndhF and ycf1) were partially duplicated resulting from their locations on IR/SC boundaries. The trans-splicing genes, rps12, were partially duplicated with two of its exons located in IRs. Including those genes
34
completely duplicated in IRs and excluding the incompletely duplicated parts of the IR boundaries located genes (but counting the trans-splicing gene, rps12, as two copies) the overall gene number of a Primulina or Petrocodon plastome is 131 with 87 protein coding genes, 36 tRNA genes and 8 rRNA genes (Table 4). There are 16 intron containing genes (not counting duplicated copy) in total with 11 protein coding genes and five tRNA genes (Table 4). Only the ycf3 and clpP gene contain two introns while the remaining genes contain one intron (Table 4). There are three pairs of genes overlapping with each other (psbD/psbC, ndhK/ndhC, atpE/aptB). The length of the coding regions (including RNA genes) accounts for 44.2 % of the total size of a Primulina or Petrocodon plastome in average, indicating the plastome structure of
species sequenced in this study is relatively compact comparing to the nucleus whose genome is usually dominated by non-coding sequences (Schmidt and Heslop-Harrison, 1998; Vicient et al., 1999; Meyers et al., 2001; Feschotte et al., 2002).
By comparing the gene contents of the two genera with the reference Bhcp genome and other Gesneriad plastomes, regardless of the annotation disparity which means the same gene was annotated into different names, there is no gene losses, relocations or structural inversions. This comparison suggest that plastomes of Gesneriaceae species sampled here are highly conserved in gene contents and gene orders.
Table 3. Plastome features of Gesneriaceae species.
Note: The unit of size and length of each plastomes is base pair (bp). The accession numbers of sequences from GenBank were shown in italic.
Scientific name Chinese name Voucher No./
Accession No.
cp size (GC %) LSC (GC %) SSC (GC %) IR (GC %)
Primulina lutea 黃花牛耳朵 KFC2916 153262 (37.6) 84094 (35.6) 18188 (31.2) 25490 (43.2)
Primulina pengii 彭氏報春苣苔 Peng24024 152354 (37.7) 83218 (35.7) 18146 (31.3) 25495 (43.2)
Primulina eburnea 牛耳朵 MF177038 152963 (37.6) 83934 (35.6) 18099 (31.1) 25465 (43.2)
Primulina longgangensis 弄崗唇柱苣苔 Peng22948 153191 (37.7) 84105 (35.6) 18168 (31.3) 25459 (43.2)
Primulina linearifolia 線葉唇柱苣苔 MF472013 153244 (37.6) 84149 (35.6) 18177 (31.2) 25459 (43.2)
Primulina liboensis 荔坡唇柱苣苔 MF177039 152989 (37.7) 84585 (35.6) 17478 (31.4) 25463 (43.2)
Primulina sclerophylla 硬葉唇柱苣苔 KFC2971 153185 (37.6) 84608 (35.6) 17641 (31.3) 25468 (43.2)
Primulina hezhouensis 賀州小花苣苔 KFC2914 153556 (37.6) 84757 (35.5) 17887 (31.3) 25456 (43.2)
Primulina huaijiensis 懷集報春苣苔 MF472012 153401 (37.6) 84334 (35.6) 18213 (31.2) 25427 (43.2)
Primulina medica 藥用唇柱苣苔 KFC2962 152323 (37.6) 84890 (35.5) 16489 (31.4) 25472 (43.2)
Primulina fimbrisepala 螞蝗七 KFC4144 153089 (37.5) 84684 (35.4) 17527 (31.2) 25439 (43.2)
Primulina cordata 心葉唇柱苣苔 KFC3021 153786 (37.5) 84789 (35.5) 18085 (31.2) 25456 (43.2)
Primulina brachytricha var. magnibracteata 短毛唇柱苣苔 MF177037 153723 (37.5) 84783 (35.4) 18078 (31.2) 25431 (43.2) Petrocodon coriaceifolius 革葉石山苣苔 KFC2943 153292 (37.5) 84345 (35.4) 18083 (31.2) 25432 (43.2)
Petrocodon multiflorus 多花石山苣苔 KFC2913 153227 (37.5) 84118 (35.4) 18279 (31.0) 25415 (43.2)
Lysionotus pauciflorus 吊石苣苔(石吊蘭) KX752081 153856 (37.5) 85087 (35.4) 17839 (31.2) 25465 (43.2)
Boea hygrometrica 旋朔苣苔 NC016468 153493 (37.6) 84701 (35.6) 17900 (31.0) 25446 (43.2)
Haberlea rhodopensis KX657870 153254 (37.7) 84299 (35.7) 17837 (31.7) 25559 (43.2)
35
36
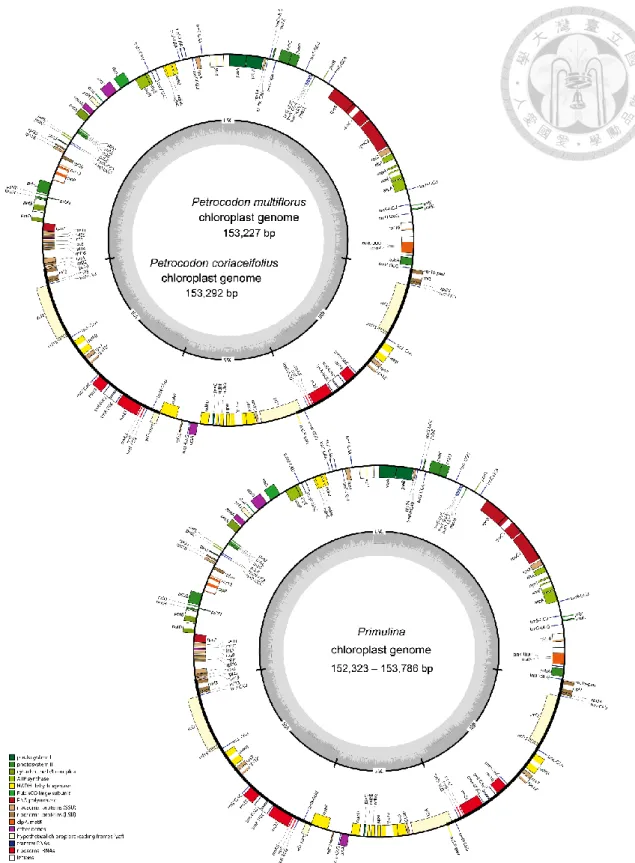
Fig. 5. The genome maps of Primulina and Petrocodon plastomes.
The genes drawn on inner side of the outer circle are transcribed clockwise, and those on the outer side are transcribed counterclockwise. IRs are shown in bold line in the outer circle. The inner circle indicates GC contents across the genome with lighter gray indicating AT contents. Genes belonging to different functional groups were shown in different colors.
Table 4. The gene contents of Primulina and Petrocodon plastomes.
Gene category Gene Name
Photosystem I psaA, psaB, psaC, psaI, psaJ
Photosystem II
psbA, psbB, psbC, psbD, psbE, psbF, psbH, psbI, psbJ, psbK, psbL, psbM, psbN, psbT, psbZ
Cytochrome b/f complex petA, petB*, petD*, petG, petL, petN ATP synthase atpA, atpB, atpE, atpF*, atpH, atpI
NADH dehydrogenase
ndhA*, ndhB(×2)*, ndhC, ndhD, ndhE, ndhF#, ndhG, ndhH, ndhI, ndhJ, ndhK
RubisCO large subunit rbcL
RNA polymerase rpoA, rpoB, rpoC1*, rpoC2
Ribosomal proteins (SSU)
rps2, rps3, rps4, rps7(×2), rps8, rps11, rps12(×1.67)†*, rps14, rps15, rps16*, rps18, rps19#
Ribosomal proteins (LSU) rpl2(×2)*, rpl14, rpl16, rpl20, rpl22, rpl23(×2), rpl32, rpl33, rpl36 Protease, Maturase clpP**, matK
Other genes accD, ccs1, ccsA, infA, lhbA, cemA Hypothetical chloroplast
reading frames (ycf)
ycf1#, ycf2(×2), ycf3**, ycf4, ycf15(×2)
Transfer RNAs (tRNA)
trnA-UGC(×2)*, trnC-GCA, trnD-GUC, trnE-UUC, trnF-GAA, trnG-UCC, trnH-GUG, trnI-CAU(×2), trnI-GAU(×2)*, trnK-UUU*, trnL-CAA(×2), trnL-UAA*, trnL-UAG, trnM-CAU, trnfM-CAU, trnN-GUU(×2), trnP-UGG, trnQ-UUG, trnR-ACG(×2), trnR-UCU, trnS-GCU(×2), trnS-UGA, trnT-GGU(×2), trnV-GAC(×2), trnV-UAC*, trnW-CCA, trnY-GUA
Ribosomal RNAs (rRNA) rrn4.5(×2), rrn5(×2), rrn16(×2), rrn2(×2) (×2): Genes duplicated in IRs.
*Genes with one intron.
**Genes with two introns.
† The trans-splicing gene, rps12, which possesses three exons with two of which duplicated in IRs.
Therefore, the gene was marked as ×1.67 copies.
# The partially duplicated genes locating on the IR/SC boundary.
38
3.3 Plastome comparison and identification of variable regions
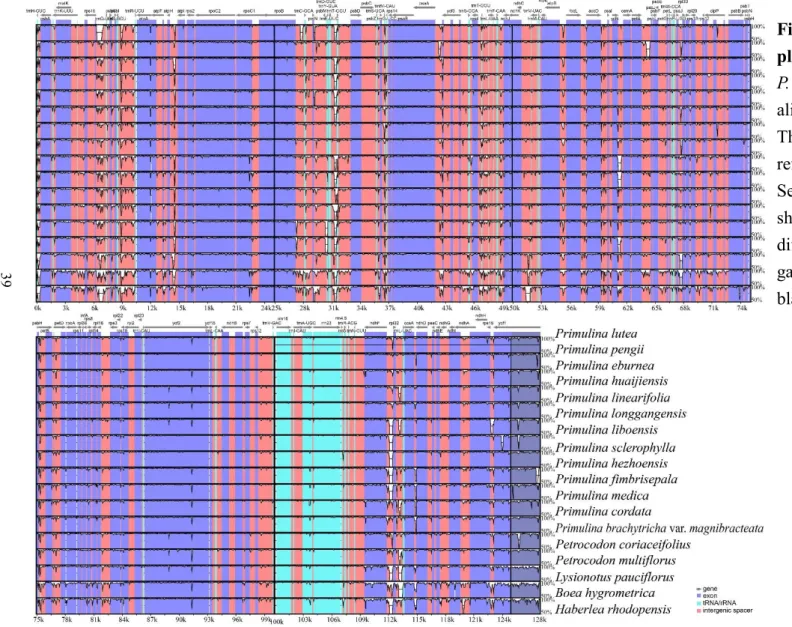
The alignment identity plot generated by mVISTA was shown in Fig. 6. The result indicates that the cp sequences are highly conserved among the 18 Gesneriaceae species included in this study. The sequences of IRs are even more conserved than the SC regions. This is consistent with the general knowledge about IR whose substitution rate is lower than LSC and SSC, because IRs are identical to each other, being able to repair mutations from other copies via biased gene conversion (Birky and Walsh, 1992), and to stabilize the overall plastid genome structure (Blazier et al., 2016).
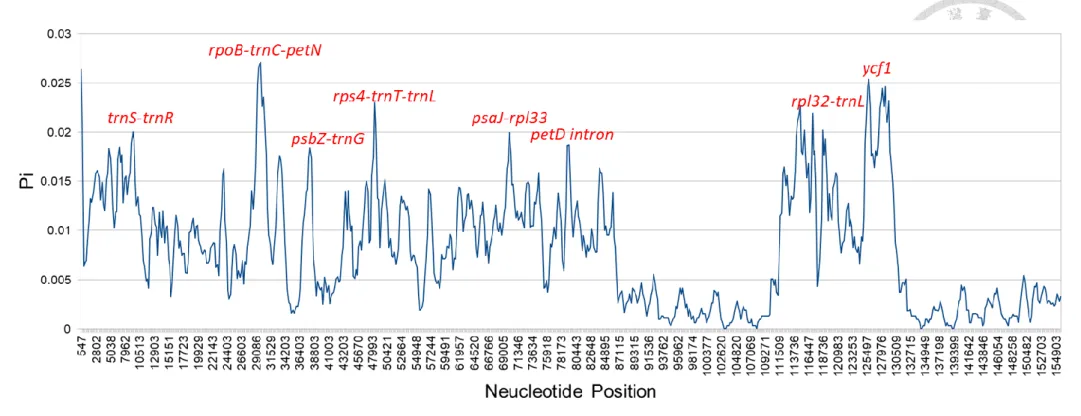
Since the indels (the alignment gaps) were not excluded in the mVISTA plot, some part of the graph seemed to be very variable consequently (Fig. 6).The variable regions in the mVISTA analyses may not be phylogenetically informative. I performed the sliding window analysis (Fig. 7) which evaluated the sequence divergence by Pi value using DnaSP. In total of eight regions, trnS-trnR, rpoB-trnC-petN, psbZ-trnG, rps4- trnT-trnL, psaJ-rpl33, petD intron, rpl32-trnL, and ycf1, whose Pi values were over 95th percentile, were identified as variable regions (Fig. 7).
Fig. 6. The mVISTA genome similarity plot of 18 Gesneriaceae plastomes.
P. lutea was used as a reference for the alignment and similarity comparison.
The gaps and differences comparing to the reference were shown in blank in the plot.
Sequence similarity under 50% was not shown here. Different colors indicate different sequence type. The alignment gaps and dissimilarities were shown in blank area in the plot.
39
40
Fig. 7. The sliding window analysis of 15 Primulina and 2 Petrocodon plastomes alignment with variable regions designated.
40
3.4 IR/SC boundaries of Gesneriad plastomes
The IR/SC boundaries and the positions of the genes flanking the IR/SC boundaries of the Gesneriad plastomes included in this study were drawn in the graph (Fig. 8). The order of the studied species included in Fig. 8 were determined by their phylogenetic relationships based on the phylogenies inferred from complete plastomes (Fig. 11). The IR/SC boundaries among studied species are highly conserved with very minor expansions or contractions except for Haberlea rhodopensis, which is one of basal lineages in Gesnericaceae (Möller et al., 2011), with its IRs contracting to exclude the ndhF gene despite its longer IRs. My data show that the more close-related the species are, the more minor the IR/SC boundaries shift. Moreover, the LSC/IR boundary is usually more conserved than the IR/SSC one, which is consistent in many plant taxa (Zhu et al., 2016).
42
Fig. 8. The IR/SC boundary graph of 18 Gesneriaceae plastomes.
3.5 Repeat contents in Primulina and Petrocodon plastome
Despite the generally low repeat contents in plastid genomes (Palmer, 1991), a moderate amount of SSRs and few dispersed repeats were identified in Primulina and Petrocodon plastomes. The SSRs in chloroplast have been employed as useful genetic
markers in population genetic studies owing to its high mutation rate and the features of uniparental inheritance and haploid genome (Powell et al., 1995).
There are only 22 different dispersed repeats identified from the ten plastomes with over half of the repeats were presented in multiple or all of the plastomes (Table 5). The shared sequence contents of the disperse repeats have shown that the repeats in Primulina and Petrocodon are quite conserved in both sequence contents and locations
of repeats in the genomes. Most of the dispersed repeats were in the length of 30 - 45 bp, and none of them was longer than 60 bp. Palindromic repeat is the most abundant type among the three different repeat classes (forward, reverse, palindromic; Table 5).
The number of SSRs in each plastomes ranged from 28 to 44 (Fig. 9). Most of the SSRs are mononucleotide A/T repeats with very few C/G types (Fig. 8) indicating that the cp SSRs are also strongly AT-biased. Over half of the SSRs are located in intergenic spacers (Fi.g 10 A). Most of the SSRs distribute in LSC regarding to the long length of LSC (Fig. 10 B). By contrast, IRs contain very few SSRs comparing to SSC which is shorter than IRs but sometimes contains more SSRs than IRs in my results (Fig. 10 B).