行政院國家科學委員會專題研究計畫 成果報告
利用距離估測以及紋理地圖改良以場景地標影像為依據的 自走式機器人之視覺導航技術
研究成果報告(精簡版)
計 畫 類 別 : 整合型
計 畫 編 號 : NSC 100-2221-E-011-051-
執 行 期 間 : 100 年 08 月 01 日至 101 年 07 月 31 日 執 行 單 位 : 國立臺灣科技大學電機工程系
計 畫 主 持 人 : 鍾聖倫 共 同 主 持 人 : 項天瑞
計畫參與人員: 碩士班研究生-兼任助理人員:廖士辰 碩士班研究生-兼任助理人員:呂泓佑 博士班研究生-兼任助理人員:傅宇
報 告 附 件 : 出席國際會議研究心得報告及發表論文
公 開 資 訊 : 本計畫涉及專利或其他智慧財產權,1 年後可公開查詢
中 華 民 國 101 年 10 月 25 日
中 文 摘 要 : 精密的環境三維地圖模型在機器人同步建圖與定位的問題中 非常重要。本計劃的研究成果是匯整距離以及影像的兩組感 測資訊,以塑模室內建築物中走道環境的三維模型。本研究 方法的自走式機器人載具上架設低成本的二維平面電射掃描 儀 (laser range finder) 以及全向攝影機
(omnidirectional camera),這兩個感應器座標間的相對關 係以及全向鏡從球面影像矯正成平面影像的關係可由校正程 序取得。如此,機器人在不定間隔的停駐點所收集到其與垂 直牆面的距離,以及由全向鏡矯正後平面的影像,可建構出 周遭走道環境中局部的彩色三維塑模。再利用 RANSAC
(random sample consensus) 以及 ICP (Iterative Closest Point) 演算法,我們可由相臨兩停駐點所得到的影像特徵點 比對,推估出兩停駐點間較精確的相對位置與面向,作為由 局部的三維塑模拼貼出較全面性區域的模型的依據。利用室 內牆面垂直的特性,本計劃採用較低成本的兩種感測器,可 建置出只用其中一種感測器所無法達成的三維地圖模型效 果。
中文關鍵詞: 立體塑模、影像之登載與辨識、雷射掃描儀、全向鏡、資料 匯整
英 文 摘 要 : This paper describes a framework to reconstruct a 3D color model of corridor environment by using a 2D laser range finder and an omnidirectional camera attached on top of a robot. Each of data scans, which contain an omnidirectional image and its laser
readings, are collected from different robot
positions. Local visual features are obtained through images to identify correspondences and the depth perceptions of matching features are acquired from the laser scanner. Given a set of correspondences, a relative motion between each two consecutive frames is firstly estimated based on RANSAC (random sample consensus) method and the result is refined by using scan matching technique. After that, the computed relative motion is transformed into 3D coordinate system to be used as an initial guess for a pair-wise color constraint-based registration ICP (Iterative Closest Point). The result of this registration is used to convert a new scan into its preceding scan then to integrate into the global coordinate. This above process is repeatedly applied for each pair of
successive scans to incrementally build a complete 3D color model. The result showed that the proposed framework can obtain an accurate model with both color and 3D information.
英文關鍵詞: 3D modeling, corridor, registration, laser range finder, omnidirectional camera, data fussion
Abstract— This report describes a framework to recon- struct a 3D color model of corridor environment by using a 2D laser range finder and an omnidirectional camera attached on top of a robot. Each of data scans, which contain an omnidirectional image and its laser readings, are collected from different robot positions. Local visual features are obtained through images to identify corre- spondences and the depth perceptions of matching fea- tures are acquired from the laser scanner. Given a set of correspondences, a relative motion between each two consecutive frames is firstly estimated based on RANSAC (random sample consensus) method and the result is refined by using scan matching technique. After that, the computed relative motion is transformed into 3D coordinate system to be used as an initial guess for a pair-wise color constraint-based registration ICP (Itera- tive Closest Point). The result of this registration is used to convert a new scan into its preceding scan then to in- tegrate into the global coordinate. This above process is repeatedly applied for each pair of successive scans to incrementally build a complete 3D color model. The result showed that the proposed framework can obtain an accurate model with both color and 3D information.
Keywords:3D modeling, corridor, registration, laser range finder, omnidirectional camera.
I. INTRODUCTION
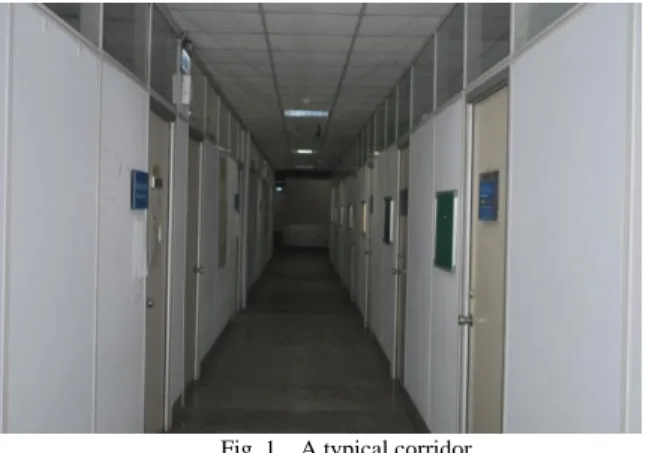
Nowadays, the problem of 3D modeling has been received more attention among robotic community due to its application in various areas such as self-localization, navigation and path planning, etc. For the issue of indoor modeling, the corridor environment has always been a challenge because of its similarity. As observed in Fig. 1, the corridor mainly consists of par- allel walls. These walls are similar in both appearance and geometric attributes. Moreover, there are a lot of identical doors along the walls, thus it is difficult to dif- ferentiate these walls. On the other hand, the recon- struction of a 3D environment requires obtaining knowledge about the target environment through sensor systems. The two most popular sensors are camera and LRF (laser range finder). However, these sensors also have their own problems. For instance, a camera projects an entire 3D scene onto a 2D image but depth infor- mation is lost. The LRF may provide high accuracy of
the depth measurements but its angular resolution is low.
As a result, the small or thin objects, which are clearly visible to camera, may only be partially captured by LRF.
Motivated by this observation, we propose a frame- work which uses a fusion of a 2D LRF and omnidirec- tional camera to reconstruct a 3D color model of corridor environment. The developed framework is based on the below three assumptions.
First, the experimental environment must be in static state that means no moving objects. Second, the robot is supposed to make planar motion during its data collect- ing process. Third, all wall surfaces are assumed to be flat, which is especially true in the corridor environment.
Since our goal is to build a 3D model using a sensor system which includes a LRF and omnidirectional cam- era, we must deal with the following issues. The first one is that the relation between each pixel point in image and its corresponding 3D scene point. The second problems is that how to fuse the range measurement from LRF to omnidirectional image. The last ones is the problem of 3D reconstruction from successive scans.
The rest of this paper is organized as follows. The related work is presented in section II. In the section III, an overview of proposed framework is provided. After that, the detail of each step in the proposed framework is described in section IV, section V, and section VI respectively. The result of experiment is shown in section VII. Finally, section VIII discusses the proposed method’s performance.
行政院國家科學委員會專題研究計畫成果報告 利用距離估測以及紋理地圖改良以場景地標影像為依
據的自走式機器人之視覺導航技術
國科會計畫編號: NSC 100-2221-E-011-051 執行期間:民國一○○年八月一日至一○一年七月卅一日
執行機構: 國立臺灣科技大學電機工程學系†.資訊工程學系‡
主持人:鍾聖倫† 教授
共同主持人: 項天瑞‡ 助理教授
計畫參與人員:傅宇、廖士辰、Hung-Duy Nguyen
Fig. 1. A typical corridor
II. RELATED WORK
In the previous section, the three crucial problems of this paper were already listed. To solve the first problem, an omnidirectional camera calibration must be done. In the second issue, data fusion of LRF and omnidirectional camera requires an extrinsic calibration process to embed the range information in omnidirectional images. The problem of 3D reconstruction from successive scans could be done by using matching and registration method.
In this section, previous work which relates to these three problems is presented.
A. Omnidirectional camera calibration
The work on omnidirectional camera calibration may be categorized into two main groups. The first one includes the method from self-calibration processes which are performed from point correspondences and epipolar constraint through minimizing an objective function. The second one covers techniques that exploit the presence of calibration pattern. The methods described in [7, 11] are classified as the first group. The calibration process is done by taking advantage of epipolar geometry without using calibration pattern.
However, these self-calibration techniques just focus on particular sensor types, such as parabolic and hyperbolic mirror. In contrast with approaches mentioned so far, the authors in [10, 13] present methods to calibrate omnidirectional camera by using checkerboard-like calibration pattern. In addition, these techniques may be applied for different types of omnidirectional camera. D.
Scaramuzza in [18] also developed a toolbox for calibrating omnidirectional camera. This toolbox is flexible and easy to use since it just asks users to capture calibration pattern images at few positions and orientations.
B. Laser-Camera Calibration
While most previous works on laser and camera extrinsic calibration are deal with perspective camera and 2D laser range finder (see [15]), little research has been published on using omnidirectional camera.
Moreover, some methods uses visible laser beams such as in [9]. Conversely, the authors [12] propose a method for fast extrinsic calibration between camera and 3D laser scanner in case of invisible laser. A Matlab toobox is also provided to implement this method. The toolbox requires user collect laser and image data of calibration pattern at several poses. After that, the region of points in image, which is on the pattern, is selected by user. The calibration is finally done by minimizing the difference in orientation and distances of the pattern planes observed by two sensors. Bacca in [1] adapt the method propose by Zhang and Pless [15] to perform an extrinsic calibration between a 2D laser range finder and omnidrectional camera. The proposed method then is evaluated at pixel error by using ground truth data from the calibration patterns projected on image.
C. 3D model reconstruction
To reconstruct a 3D environment with color infor- mation, P. Biber in [2] used a sensor system consists of an omnidirectional camera and a 2D laser range finder.
From the laser scan, an accurate 2D map is built by scan matching based on normal distribution transform. Im- ages are captured from panoramic camera used to gen-
erate texture later. The input images are warped onto the planes assigned to walls and floor according to the laser scan data. As a result, the 3D environment consists of textured wall and floor planes. Later, P. Biber also ex- tended this work by using graph cut algorithm [3]. His new model is formed not only by textured walls and floors but also 3D point clouds, thus structures like windows and stair are visualized as well.
In [17, 5] and [14], the authors have used a CCD camera mounted on the top of a 2D laser range finder.
The key ideal here is to combine the strong visual cor- respondences with the depth accuracy obtained from the laser scanner. In [17, 14], image correspondences were extracted by using Scale Invariant Feature Transform (SIFT) [8] algorithm. However, the authors in [17]
treated these SIFT features as a corresponding set for a method called trimmed Generalized Total Least Squares Iterative closest point (GTLS-ICP) to infer a relative motion. Therefore, their ICP algorithm did not require establishing the correspondences. In contrast, the author in [14] used directly these found features to calculate a rough relative transformation. After that, this computed relative transformation is used as an initial guest for a modified color ICP algorithm. Y. Bo in [5] proposes another method to search for correspondences. The laser data is projected to the current image to find the corre- sponding points in the next image by using image matching method called Kanade-Lucas-Tomasi (KLT) tracker. Motion between frames is inferred from these correspondences. All these above methods result in a high precision color 3D model.
Johnson and Kang in [7] discuss a methodology of integrating multiple textured 3D data sets. This method requires the 3D data sets be firstly recovered from om- nidirectional multi-baseline stereo. The two consecutive data sets are registered by using an ICP variant which they called as color ICP. This ICP version takes into account not only geometric information but also the
Fig. 2. An Overview of proposed framework
color to search for corresponding points. Once the reg- istration step is finished, a complete 3D textured model was constructed by merging shape and appearance from multiple 3D textured data sets based on occupancy grid.
III. METHOD OVERVIEW
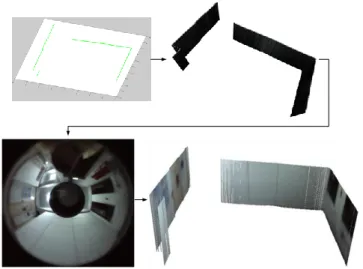
This section introduces an overview of our frame- work to reconstruct a 3D color model of corridor envi- ronment. Four major steps can be identified as follow (see Fig. 2 for illustration).
D. Data Acquisition
A mobile robot equipped with a laser range finder and omnidirectional camera (see the Fig. 3 for illustration), is manually controlled to steer through the target envi- ronment. It records laser scans and captures images from the omnidirectrional camera at different poses. In our experiment, new measurements were taken whenever robot displacement is about 50 cm and heading change about 300~450.
E. Calibration
To efficiently take advantage of data from laser and camera, the sensor system must be calibrated. Two cali- bration processes should be done. The first one is the omnidirectional camera calibration. After that, another calibration between omnidirectional camera and the laser is required to relate the laser points into the camera co- ordinate system. The approach to calibrate sensor system is described in section V
F. Data Fusion
This step aims to embed the range measurement from laser scanner to omnidirectional image as followed. First, a 3D point set is generated from laser scans by sampling in z-axis. Second, these 3D points are reprojected into image plane to retrieve color information by using the result of calibration from the previous step. As a result, 3D color point cloud of each scans are produced.
G. Model Generation
After 3D color points at each scan poses are obtained, a complete 3D model is reconstructed from successive scans. Firstly, the 2D relative change between two robot poses is computed. After that, the 2D relative motions are now transformed into 3D coordinate systems. These 3D relative transformations then are used as initial values for a sequential registration process by using a color con-
straint 3D ICP algorithm performing on each two suc- cessive scans. The new scan is converted to the previous scan and then is integrated into global coordinate system to incrementally reconstruct a 3D color model.
IV. CALIBRATION
H. Omnidirectional Camera Calibration
Our omnidirectional camera consists of a normal
camera and a convex mirror. To calibrate it, we adopt the model described in [13] which relates to the toolbox developed in [18]. This toolbox requires users to capture images of a checkerboard pattern at different poses. As a result, the output of this toolbox is the coefficients of a polynomial which manages the projection of a 3D scene point to a pixel point on the image. In addition, the rela- tive poses of checkerboard plane respect to camera frame, which are expressed as a rotation and translation matrix, are also provided by this toolbox. These relative poses are used to support for the next calibration process.
I. Laser-Camera Calibration
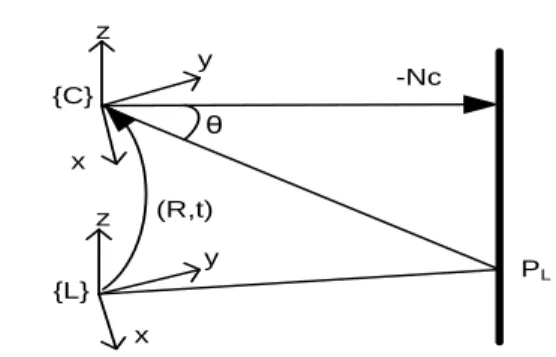
The goal of this calibration is to find the transformation that relates the laser coordinate frame to the camera frame. This transformation is composed of a 3x3 rotation matrix R and a 3x1 translation vector t. (See the Fig. 5)
Let PL is the coordinate of a laser point on checkerboard pattern expressed as PC in camera frame as follow:
PC RPLt. (1) The checkerboard’s relative poses with respect to the camera frame could be estimated from the previous process. This parameter is then used to determine a vector that parallel to the normal vector of calibration plane and its magnitude equals to the distance from camera to calibration plane as:
NC R3(R3T.t3). (2) Where, R3 and t3 are the third column of rotational matrix and the translation vector of the checkerboard pattern pose with respect to the camera frame.
Since the laser points belong to the calibration pattern, there is a constraint based on the distance between the
(a) (b)
Fig. 3. System configuration. (a) sensor system (b) the close-up image of laser scanner and camera
{C}
z
x
y
{L}
z
x y
-Nc
(R,t)
PL
θ
Fig.4. Geometric relation between coordinate
camera and the calibration plane. This constraint can be described by the following equation.
NC.PC NC PC cos NC 2. (3) Substitute PL for PC by using (1), it leads to the fol- lowing non-linear cost function where R and t are the parameter need to be estimated, and PL is a laser point.
f(R,t)NC.(RPL t) NC 2. (4)
To achieve the parameters R and t, data must be captured at several positions; thus (4) becomes:
( , ) ( ( ) ) .
2
1 1
K
i M
j
ci Lij
ci
ci RP t N
N t N
R
f (5)
Where K is the total number of calibration poses, M is the number of laser point in the i-th target pattern and NCi
is the vector defined from (2) for the i-th calibration plane. The solution to the above non-linear cost function may be obtained by using Levernberg-Marquardt (LM) optimization algorithm which is offered from Matlab.
The result of calibration process is shown in Fig.5.
Laser points are projected on image as the green dots to validate the result. The laser points on the checkerboard are better fit to the pattern’s edge after calibration.
V. DATA FUSION
A laser range finder provides a set of distances to objects of surrounding environment. The relative posi- tion (from bird eye view) of these objects to scan pose could be easily inferred from these distances. Since, these points lie on a plane that is parallel to ground plane, thus their third coordinate that describe the height could be assigned to be equal to the difference between laser pose and the ground. Moreover, our third assumption states that all wall surfaces are supposed to be flat; thus the 3D coordinates of the other points on vertical surface are easily obtained from laser scanner results.
On the other hand, our goal is to build a 3D color model. Hence, the color information, which corresponds to each specific 3D point, could be extracted by using the mapping function from calibration process. As a result, a set of 3D color points is obtained by information from both of laser range finder and camera model.
This process could be described as follow. First, the laser scan points are transformed into Cartesian system.
Second, the 3D point set is generated by assigning the third z-coordinate. The last step is that mapping all the 3D points into image plane to retrieve their correspond- ing color values.(see the Fig. 6)
VI. MODEL GENERATION
This section describes the process of generating a complete 3D color model from pairs of successive scans.
J. Computing 2D relative motion
This part deals with issue: how to compute the 2D relative motion between these two scan poses. The corresponding features are firstly obtained by using SIFT
algorithm. The depth of matched features are estimated from laser scanner. The relative transformation between two poses is computed by using RANSAC-based method.
Lastly, the calculated result is refined with ICP.
1) Identifying image correspondences and estimating depth value of matched features
The corresponding features are obtained through SIFT. Their depth values are estimated from the range measurement as the following example (see Fig. 7). As the result of calibration, laser points could be reprojected on omnidirectional image. Let P’ is one of the feature lie on the region of laser range finder described as arch-shaped. According to the assumption: the wall is flat, the depth of P’ is the same as the point Pi (one of the reprojected laser points) which is a point on the extended ray OP’. Therefore, the depth value of all the matched SIFT features can be obtained through this ideal.
2) Relative motion estimation
Our goal is to obtain the displacement between two successive scans: (Δx, Δy, Δθ) which are the change in two axes (x, y) and heading orientation. It is achieved by using a RANSAC-based method proposed at [4]. The input of this process is the matched features from above step.
3) Iterative Closest Point
The estimation of relative motion from the previous process is used as an initial guess for ICP (Iterative Closest Point) algorithm.
In Fig. 8, the matching process is performed on two consecutive laser scans by using RANSAC-based tech-
(a) (b)
Fig. 5. Calibration result (a) Before Calibration (b) After Calibration
Fig. 6. Generation 3D color point at one pose.
nique and ICP respectively. The first scan is green dots and the second scan is described as black dots. The image shows that the refined result is improved when the se- cond scan is well matched to the first scan.
K. Transform 2D relative motion to 3D coordinate Under the assumption that a robot just makes planar motion meaning it rotates around the vertical axis and translates on the ground plane. Therefore, a 2D relative transformation could be transformed into 3D coordinate frame. This transformation may be expressed by the operation as follow.
0 1
0 0
0 cos sin
0 sin cos
y x t
R
(6)
L. Registration process
This section presents a pair-wise registration tech- nique of two 3D color data sets. The 3D color point cloud that belongs to the latest scan is registered into the co- ordinate frame of its previous scan and then is trans- formed into the global coordinate system to construct a complete 3D model. The origin of the global coordinate is set at the first camera reference frame.
1) The pair-wise registration with color-constraint This approach takes into consideration range and color information separately. In the phase of searching correspondences, the criterion consists in a pure Eu- clidean distance to find closest points. It is similar to the standard ICP but the difference occurs when a color distance constraint is applied to remove outlier or high potential of false pair of matching points. For each can-
didate pair of corresponding points, its color distance is computed as in the following function:
2 23 13 3 2 22 12 2 2 21 11
1(c c ) (c c ) (c c )
dColor (7)
Where {c11,c12,c13}{c21,c22,c23}are the color values of the first point and are the second point, re- spectively. {1,2,3} are weight coefficients of color attributes. We use YIQ color model instead of RGB model to reduce the effect of light variation. In our im- plementation, we choose{1,2,3}{0.1,1,1}
A color threshold is set to exclude the outliers. This threshold is calculated based on the method proposed by Z. Zhang in [16].
2) Integrate to global coordinate
The first scan pose is set as the origin of the global reference frame. A new scan is firstly registered to the previous scan and then transformed to the global coor-
Fig. 7. Estimating the depth of image feature
(a) (b)
Fig.8. Matching Result (a) Matching result using RANSAC-based method (b) The result is refined by using ICP
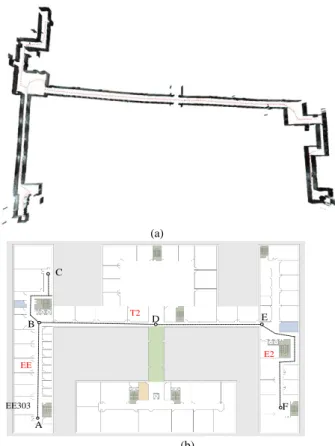
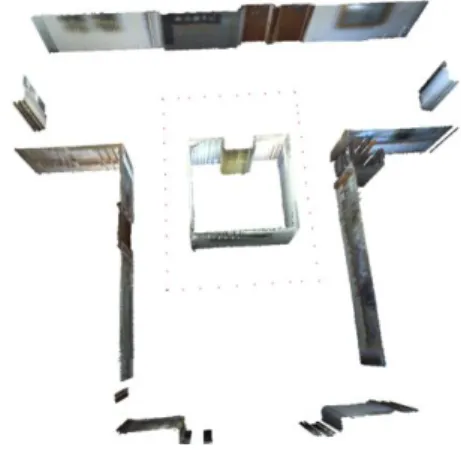
(a)
A
B E
C
EE303
D
F EE
T2
E2
(b)
Fig.9. (a) The reconstructed model from top view (b) Its floor plan
Fig.10. (a) The reconstruction model from sideview (b) The close-up of recontructed evironment (c) The image captured by a normal camera
dinate to incrementally build the complete model.
VII. RESULTS
The experiment was performed with the corridor environment of 60m x 100m using the proposed framework. The result of reconstruction is shown in Fig.
9(a). The red dots represent the positions where scans were captured. Another view of this reconstructed model is visualized in Fig. 10.
To evaluate the performance of the proposed framework, the experiment is conducted under the closed loop environments. Robot was set to move in loop path, and the change in distance between first and the last po- sition could be considered as the error. The result is shown in Fig. 11 and table I with different sizes.
VIII. CONCLUSION
In this paper, we have proposed the scheme for building a 3D model of corridor environment. By em- bedding the range measurement of laser range finder into wide-view omnidirectional images, a large scale struc- tured environment could be reconstructed with not just 3D geometric information but also color features. It is well known that ICP requires a good initial guess to ob- tain the good matching result. We proposed a method to obtain these initial parameters by combining visual cor- respondences and the range measurement from laser scanner. The computed 2D relative transformations be- tween each two scan poses are converted into 3D coor- dinate and again, are put as initial guest for pair-wise registration color constraint-based method to incremen-
tally reconstruct a complete 3D model. The performance of proposed framework is examined under the loop closure case. The results show that the reconstructed model is good for visualization goal.
References
[1] E. B. Bacca, E. Mouaddib and X. Cufi, “Embedding range information in omnidirectional images through laser range finder,” IEEE/RSJ International Conference on Intelligent Robot and system, pp.2053-2058, 2010.
[2] P. Biber, H. Andreasson, T. Duckett and A. Schilling, “3D Modeling of Indoor Environments by a Mobile Robot with a Laser Scanner and Panoramic Camera,” Proc. of IEEE/RSJ International Conference on Intelligent Robot and system, vol. 4, pp. 3430, 2004.
[3] P. Biber, S. Fleck and T. Duckett, ”3D Modeling of Indoor Environments for a Robotic security guard,” Proc. of the IEEE Computer Society Conference on Computer Vision and Pattern Recognition, pp. 124, 2005.
[4] J. L. Blanco, J. Gonzalez and J. A. F. Madrigal, ”A new method for robust and efficient occupancy grid-map matching,” In Proc of the 3rd Iberian conference on Pattern Recognition and Image Analysis, Part II,Springer-Verlag Berlin, Heidelberg © 2007.
[5] Y. Bo, Y. B. Hwang, and I. S. Kweon, “Accurate Motion Estiamation and High-precision 3D reconstruction by Sensor fusion,” IEEE International Conference on Robotics and Automation, pp. 4721 – 4726, 2007.
[6] A. Johnson and S. B. Kang, “Registration and integration of textured 3-D data,” In Proc. Int. Conf. On Recent Advances in 3-D Digital Imaging and Modeling, pp 234-241, May 1997.
[7] S. B. Kang, “Catadioptric self-calibration,” IEEE Conference on Computer Vision and Pattern Recogniton, pp. 201-207, 2000.
[8] D. G. Lowe, "Distinctive Image Features from Scale-Invariant Keypoints," International Journal of Computer Vision, vol. 60, pp. 91-110, 2004.
[9] C. Mei and P. Rives, ”Calibration between a Central Catadioptric Camera and a Laser Range Finder for robotic applications,” In Prof. of IEEE International Conference on Robotics and Automation, pp. 532-537, 2006.
[10] C. Mei and P. Rives, ”Single View Point Omnidirectional Camera Calibration from Planar Grids,” IEEE International Conference on Robotics and Automation, pp.3945 - 3950, 2007.
[11] B. Micusik and T. Pajdla, “Para-catadioptric Camera Autocalibration from Epipolar Geometry,” Asian Conference on Computer Vision, pp. 748-753, January 2004.
[12] R. Unnikrishnan and M. Herbert, “Fast Extrinsic Calibration of a laser range finder to a Camera,” Tech. Report CMU-RI-TR-05-09, Robotics Institute, Carnegie Mellon University, July 2005.
[13] D. Scaramuzza, A. Martinelli and R. Siegwart, “A Toolbox for Easily Calibrating Omnidirectional Cameras,” IEEE/RSJ International Conference on Intelligent Robot and system, pp.
5695 – 5701, Beijing China, October 7-15, 2006.
[14] J. H. Young, K. H. An, J. W. Kang, M. J. Chung and W. Yu, “3D Environment Reconstruction using modified color ICP algorithm by Fusion of a camera and a 3D Laser Range Finder,” IEEE/RSJ International Conference on Intelligent Robot and system, pp.
3082 – 3088, 2009.
[15] Q. Zhang and R. Pless, “Extrinsic Calibration of a camera and Laser Range Finder,” In Proc. of IEEE/RSJ International Conference on Intelligent Robots and System, vol. 3, pp.
2301-2306, 2004.
[16] Z. Zhang, “Iterative Point Matching for Registration of Free-Form Curves and Surfaces,” International Journal of Computer Vision, vol. 13:2, pp. 119-152, 1994.
[17] H. Andreasson and A. J. Lilienthal, “6D Scan Registration using Depth-Interpolated Local Image Features,” Robotics and Autonomous Systems, vol. 58, no. 2, 2010.
[18] An omnidirectional Camera toolbox’s tutorial, D. Scaramuzza http://robotics.ethz.ch/~scaramuzza/Davide_Scaramuzza_files/R esearch/OcamCalib_Tutorial.htm#omnimodelpartial.
Fig. 11. The reconstructed model under loop closure
TABLEI
LOOP CLOSURE IN DIFFERENT ENVIRONMENT SIZES
Size(m2) X(m) Y(m) Z(m) Number of
Scans 8.6 x 6.5 0.0045 0.0067 -0.0009 39
11.3 x 6.3 -0.049 0.0064 -0.0029 52
17.5 x 7.2 -0.918 0.57 -0.002 67
國科會補助專題研究計畫項下出席國際學術會議心得報告
日期:101年10月 23 日
一、參加會議經過
系統科學與工程涵蓋現代科技的許多應用。系統可視為許多個體的結合,像是人,組織,文化或 是活動等。個體間除了自主運作的法則外,同等重要的是如何彼此合而達到整體現象與功效。然 而,互動過程中也因為資源共享與網路的連通而變得更複雜。ICSSE 2012 的大會主軸是集思廣義 討個體互動間所涉及的計劃、發展以及佈署的問題進行研討。
ICSSE 2012 是由大連理工學院所主辦。主要兩天的會議中,有三個 keynotes,以及 11 個 parallel session。其中,北京中科院的 Fei-Yue Wang 教授主講 ACP-Based Parallel Control and Management for Complex Systems: Theory and Application,其主要的構想是:針對複雜的系統,利用數學建模,
輔以計算分析,然後同時地控制與管理數學的建模與真實系統,以作為實時的驗證。另外,加拿 大 Alberta University, Canada and Polish Academy of Sciences 的 Prof. Witold Pedrycz 主講的題目:
User-Centric Granular Models of Temporal and Spatiotemporal Data,有兩個重點,就是用來當作決策 資料在 Fuzzy 分析中的清晰度概念,以及從時間與空間的情境與關連中,賦乎解譯的意義,以當 作系統分析與設計的限制。另外,還有一位業界代表,Dr. Li-Quan Cong 主講 The Green
Manufacturing Techniques and Applications under the Consideration of Energy Supply Constriction,感 覺普通。
我的報告是在 6 月 30 日的 Special Session: Applications of Intelligent Mechanisms,報告順利,聽
計畫編號 NSC 100 -2221 - E - 011 - 051 -
計畫名稱 利用距離估測以及紋理地圖改良以場景地標影像為依據的自走式機器人 之視覺導航技術
出國人員
姓名 鍾聖倫 服務機構
及職稱 台灣科技大學電機系教授 會議時間 2012 年 6 月 30 日
至同年 7 月 2 日 會議地點 中國,大連
會議名稱
(中文) 2012 國際系統科學與工程研討會 (ICSSE)
(英文) 2012 International Conference on System Science and Engineering (ICSSE)
發表論文 題目
(中文) 以影像為基礎的智慧型出勤登載系統
(英文) Image-based Intelligent Attendance Logging System
附件四
1
眾並詢問我研究中當作人出勤依據的熱點的判定與後序進入與離席的偵測。利用影像處理的技術 支援控制的系統設計在這個 session 中似乎很引人注意。
二、與會心得
本次大會由大連理工主辦。大部份的時間,議程是以三到四組同時進行。大部份的作者都是中國人,
一般英文報告水準欠佳。會場中,有聽到與國防、產業相關的控制系統報告。大陸控制學者之多以 及研究題目的廣度讓我印象深刻。大會每天晚上都有晚宴,國內外的與會學者,齊聚一堂,交流學 術思想,討論學術問題。此次參加會議過程中,個人覺得最大的收獲是與國內外學者進行研究想法 上的交流。報告現場聽眾的提問,可以讓我知道研究同樣學者關心的技術瓶頸,而他們的建議也擴 展我後續的研究目標。透過與會人士報告自己最新的研究成果,並積極參與、交換研究心得,是我 覺得最大的收獲。
2
3
4
Image-based Intelligent Attendance Logging System
Hary Oktavianto Electrical Engineering Department
Electronic Engineering Polytechnic Institute of Surabaya Surabaya, Indonesia
Hsu Gee-Sern1, Chung Sheng-Luen2
1) Mechanical Engineering Department
2) Electrical Engineering Department
National Taiwan University of Science and Technology Taipei, Taiwan
[email protected] Abstract—This paper proposes an extension of the surveillance
camera’s function as an intelligent attendance logging system.
The system works as a time recorder within two phases; learning phase and monitoring phase. By placing a camera inside a working room, the sytem enters the learning phase by locating the sitting area automatically based on the camera’s images. The learning phase has a defined time duration to complete a working map. Next, the system switches to the monitoring phase to report each occupant’s working hour corresponding to their sitting area in the working map. The system detects the entering occupant, the leaving occupant, the sitting occupant, and the standing occupant from their seat. The system also tracks the occupants.
The working hours of the occupant will be counted as how long they sit in their desk. When the occupant sits at his/her seat, a start time is given. Later, after he/she leaves from their seat, a stop time is generated. The experimental setup has been done in our laboratory. The result shows that the system can achieve a good result.
Keywords-Activity map, Attendance, Logging System, Learning pahse, Monitoring phase, Surveillance camera
I. INTRODUCTION
Many working environments need supervision. For instance, in the line assembly of the factory or in the office. One kind of supervision is the action to keep monitoring the worker for being present or not. Usually, the company provides a time clock or time recorder. A time recorder is a mechanical or electronics timepiece that is used to assist in tracking the hours an employee of a company worked [1]. The time recorder could be mechanic (such as punched-card) or electronic (such as magnetic stripe card, RFID tag, hand-punch, or fingerprint).
This paper wants to seek a new way to design a time recorder.
Considering that intelligent buildings have increased as a research topic recently [2], [3], [4] and many buildings are installed with surveillance cameras for security reasons or as the infrastructure for context-aware applications, this paper proposes a technique to implement a system that works like a time recorder. By extending the function of the existing surveillance cameras as an intelligent attendance logging system, the proposed system has purposes to monitor and to report the occupant’s attendance. This system is suitable to be implemented in the sedentary working environment. For the occupants, they do not need to bring any tag or badge. The system will monitor the occupants’ attendance by using a camera that is placed inside the working room and sends the events/messages in real-time. The system is also designed to
support the context-aware applications such as smart home or intelligent buildings.
To monitor the occupants’ attendance, the locations of the occupant’s working area should be defined previously. The occupant’s working area is also called as the sitting area. There are two options to define the sitting area. The first option is the user specifies the locations manually and informs to the system.
The second option is the system learns to find the locations automatically. After the locations are defined clearly, the system starts to monitor the occupants’ attendance. The second option is chosen in this paper. Hence, the system is so called intelligent since it has ability to learn from a given environment to locate the sitting areas. The collection of the sitting area is called as a map.
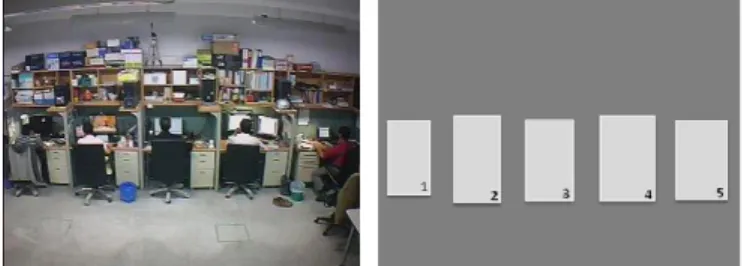
Fig. 1 shows an example scenario. Ideally, the occupant enters into the room and sits to start working. After that, the occupant stands up from his/her seat and leaves the room. The sitting and the standing up events will be used to decide where the sitting area of the occupant is and when the occupant works.
In the system implementation, this paper also intends to exploit the advantages of the existing open source library for the computer vision, OpenCV [5] and cvBlob [6].
The goal of this paper is to design an image-based intelligent attendance logging system with at least has the following functions:
1) Learning phase: detection and identification of seat locations in an unknown environment.
2) Monitoring phase: detection of entering and leaving events for each occupant into and from respective seat.
3) Real-time system: implementation of real-time intelligent attendance logging system.
Figure 1. Occupant’s working room (left) and a map consists of occupants’
sitting areas (right).
5
During the past decades, intelligent building has been developed. By using the cameras, the researchers extracted the information from the environment into a map. In [4], the map is labeled already. In [7], [8], [9], [10], and [11], the map is learned automatically to indicate interesting image regions and the way objects move between these places. In the case of the camera that was used, a static camera is used by the system as in [3], [4], [9], [10]. In [11], they applied omnidirectional camera to their system. The others, [2], [7], [8], used stereo camera to reduce the effect of lighting intensity and occlusion.
By integrating the existing open source library with additional algorithms, we have designed an intelligent attendance logging system which works in two phases.
Corresponding to the objectives, there are three contributions in this paper:
1) Learning mechanism that locates seats in an unknown environment.
2) Monitoring mechanism that detects entering and leaving events of occupants.
3) Integrating system with real-time performance up to 16 fps, ready for context-aware applications.
This paper is organized with the following sections. Section II describes the problem definition and preliminary. Section III explains about the proposed approach. Section IV discusses about the experiment results. Finally, the concluding remark and future work are given in Section V.
II. PROBLEM DEFINITION AND PRELIMINARY
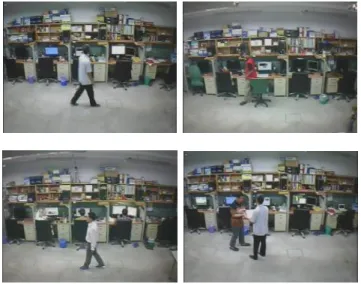
We made an observation on the sample image taken from the camera in the working environment. The working environment that we used in this paper is our laboratory. There are some desks in a line. To have a better view and considering the limitation of our camera’s view, we set the camera perpendicular to the desks. We recorded some image sequences as a video clips. We would like to know what we can learn from the one sample image taken by a camera in the real condition. Fig. 2 shows the snapshot of the image samples. The observations on these samples are listed as the following:
1) The path of the walking occupants in the scene is horizontal.
2) A person may walk behind the sitting person.
3) When a person sits, he/she is occluded by the chair.
4) The part of the person has similar color with the surrounding furniture.
5) An occlusion of two people happened sometimes.
6) There are seats in the both edge. This could be a problem if the occupant suddenly moves outside of the scene.
The system will be designed by considering the result from the observation. For instance, the horizontal path of the walking occupants can make the grouping algorithm of broken blobs easier. Also, we used four attribute features for tracking which are centroid, size, ground position, and color. We defined centroid as a center of the occupant’s bounding box.
Size feature is pixel density of one detected occupant. Ground position is the position of the occupant’s foot which is calculated at the bottom-centered of the occupant’s bounding box. Color is the RGB histogram from the occupant.
A. Tracking states
During the appearance of the object in the scene, we would like to keep tracking the object which is an occupant. Since the system can track a person, we just follow the person using the four attribute features. The system has four tracking states that have responsibility to track each person. The tracking states are entering state (ES), sitting state (SS), standing-up state (US), and leaving state (LS). The tracking states will be explained in section 3. Fig. 3 shows the diagram of the system. A person enters to the working room. The person sits into his/her seat.
He/her stands up from the seat. Finally, the person leaves the working room. There will be two phases in this system, learning phase and monitoring phase. Both phases are triggered by sitting event and standing-up event. During the learning phase, sitting event is used to locate the seating area. In the monitoring phase, sitting event is used to give a time stamp of the sitting time and standing-up event is used to give time stamp of the leaving time.
B. Approaches and Performance Criteria
This intelligent attendance logging system is designed based on two assumptions. The first assumption is the environment is unknown, in that, the number of seats and the locations of these seats are not known before the system monitors. The second assumption is each occupant has his/her own seat, as such, detecting the presence/absence of a particular seat amounts to answering the presence/absence of that corresponding occupant. In order to achieve the research
Figure 3.The diagram of the system.
Figure 2. Snapshot of some image samples.
6
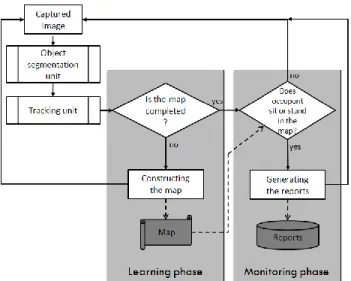
objectives, the algorithm of the proposed system is shown in Fig. 4. The system consists of an object segmentation unit, a tracking unit, learning phase, and monitoring phase. The report on presence or absence of the occupants is the final output of the system for further analysis.
There are two performance criteria to evaluate the system regarding to the main functions of the system. The main functions of the system are to detect the occupants’ sitting area and to report the monitoring result. The first criterion is the system should detect the sitting areas given by the ground truth.
The second criterion is the system should be able to monitor the occupants during their appearance in the scene to generate the accurate report. The system will be evaluated by testing it with some video clips using different scenario. The occupants enter into the scene. They will sit, stand up, leave the scene and sometimes make a group then separate. The first scenario is the occupants enter to the scene and leave one by one without making any occlusion. The objective is to see how good the system can detect the location of the occupants’ sitting area.
The second scenario is the same as the first scenario but the occupants will make a group to see how good the system can handle the occlusion problem. It is assumed that the scene in the video clips has horizontal path only, meaning that the occupants walk in the horizontal direction.
C. Broken blobs
We would like to have a person corresponding to a single blob. But sometimes, the part of the person has the similar color with the background or the person sits at his/her chair.
Then, the whole body is segmented into different parts. After we got the blobs, we need to group them if the unconnected blob belongs to a person. There are three conditions to examine the broken blobs. The first is the intersection distance of blobs (BI). The second is the nearest vertical distance of blobs (Bdy).
The third is the angle of blobs (BA) from their centroids. The unit of BI and Bdy are in pixels and the unit of BA is in degree. If those three conditions are satisfied (1) then the broken blobs are grouped into one blob. TI, Tdy, and TA are the threshold values for the intersection distance, the nearest vertical distance of blobs, and the angle of blobs, respectively. Each broken blob
will be marked by a rectangular box. The BI may have zero value or negative value, meaning that the rectangular box of two broken blobs is overlaping each other. The Bdy has absolute value (positive only). The BA has absolute value relative to each other. In the experiments, TI is 0 pixel, Tdy is 50 pixels, and TA
is 30°. Fig. 5 shows the result of blob grouping algorithm when an occupant has the same color with the background image.
The left image is the current image in the scene. The middle image is shown the broken blobs of the occupant. In this case, according to (1) the logic of G will be ((false) OR (true AND true)), that is 1. Hence, the two broken blobs are grouped. The right image is the result of blob grouping (it is shown by one rectangular box). Here, the blob grouping algorithm is expected to reconstruct the occupant with broken blobs. After the broken blobs are grouped, the centroid of the grouped blobs will be located at the center of the rectangular box.
otherwise
T B T B T
G BI I dy dy A A
0
1
III. PROPOSED APPROACHES
A. Tracking an individual
The system needs some mechanism to keep monitoring the occupants’ status in the scene whether they seated or unseated.
The status of the occupant is represented by the tracking states.
As shown in Fig. 3, there are four states:
(1) Entering state (ES), an incoming blob that appears in the scene for the first time will be marked as entering state.
This state also receives information from the motion detector to detect whether the incoming blob is an occupant or a noise. If the incoming blob is considered as noise and it remains there for more than 100 frames then the system will delete it. For instance, the size is too small because of shadows. To erase the noise from the scene, the system re-initializes the Gaussian model to the noise region so that the noise will be absorbed as a background image. An incoming blob is classified as an occupant if the incoming blob has motion at least for 20 frames continuously and the height of the blob is more than 60 pixels. Entering state will also group the broken blobs if any. A unique identification (ID) number and a bounding box are attached to the incoming occupant. The blob or the grouped blobs detected as an incoming occupant is called as a track.
The system adds this track in the tracking list.
(2) Sitting state (SS), detects if the occupant is sitting. In the experiments, sitting occupant can be assumed with
Figure 5. Blob grouping result of the occupant which is occluded by chair.
Figure 4. The algorithm of the system.
7