• 沒有找到結果。

Modeling and Comparing Height Growth of Larch Plantations in Different Land Types in Eastern Liaoning Province, Northeast China

N/A
N/A
Protected

Academic year: 2021

Share "Modeling and Comparing Height Growth of Larch Plantations in Different Land Types in Eastern Liaoning Province, Northeast China"

Copied!
16
0
0

加載中.... (立即查看全文)

全文

(1)

Modeling and Comparing Height Growth of Larch Plantations in Different Land Types in Eastern Liaoning Province, Northeast China

Hui-Yan Gu

1,2)

【 Summary】

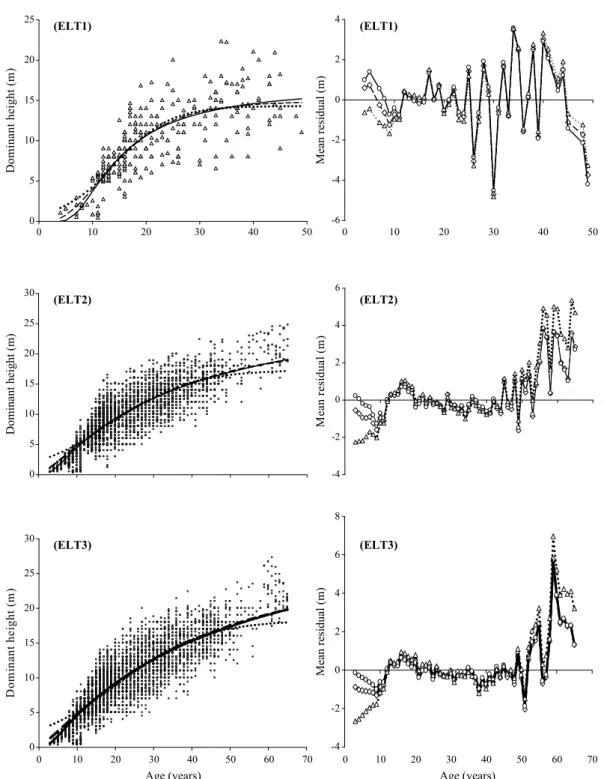
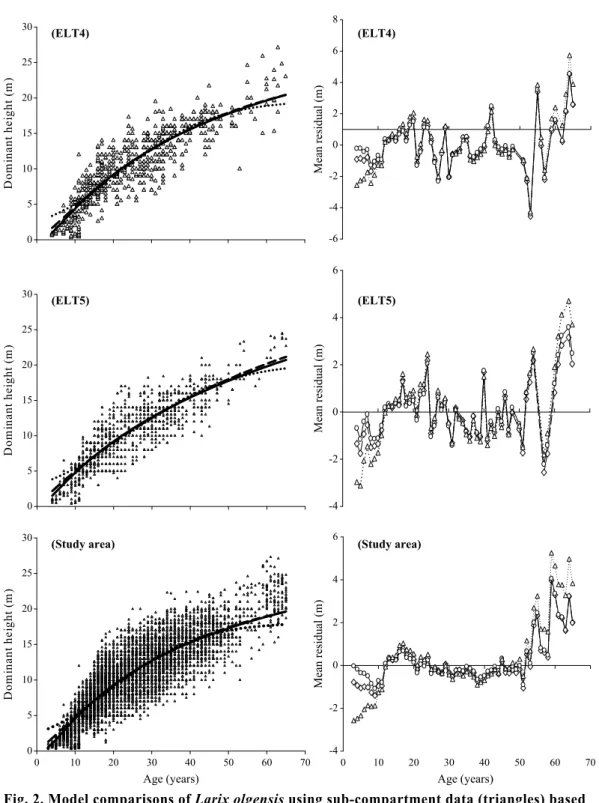
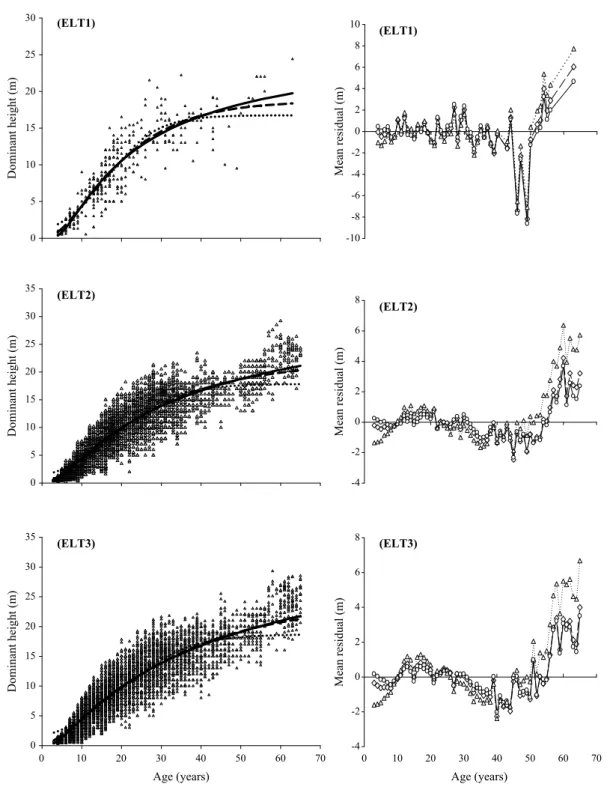
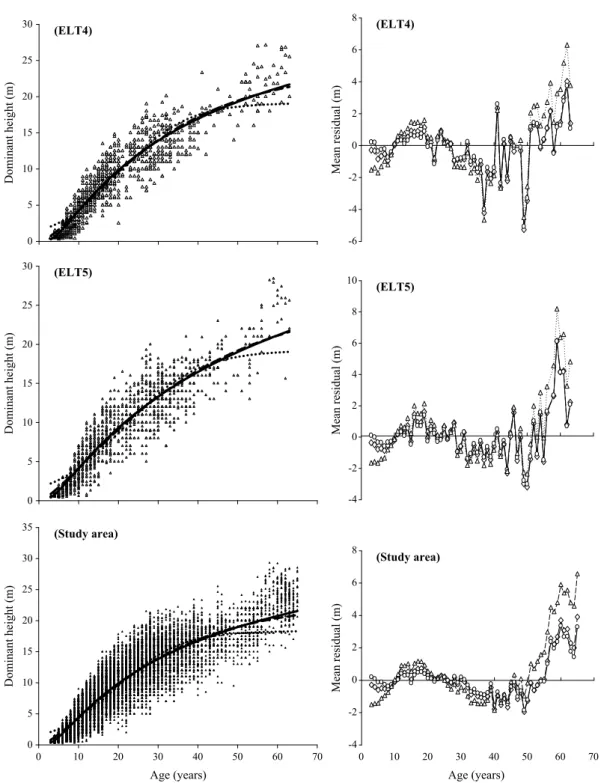
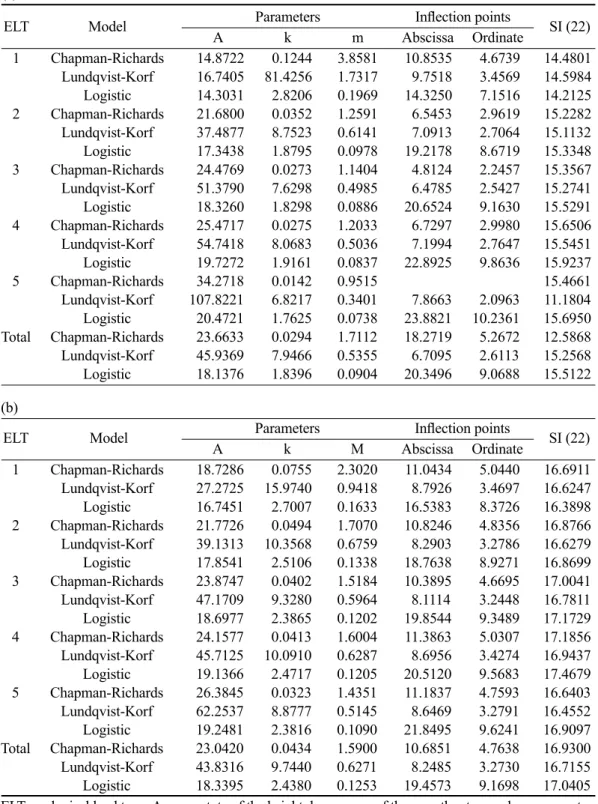
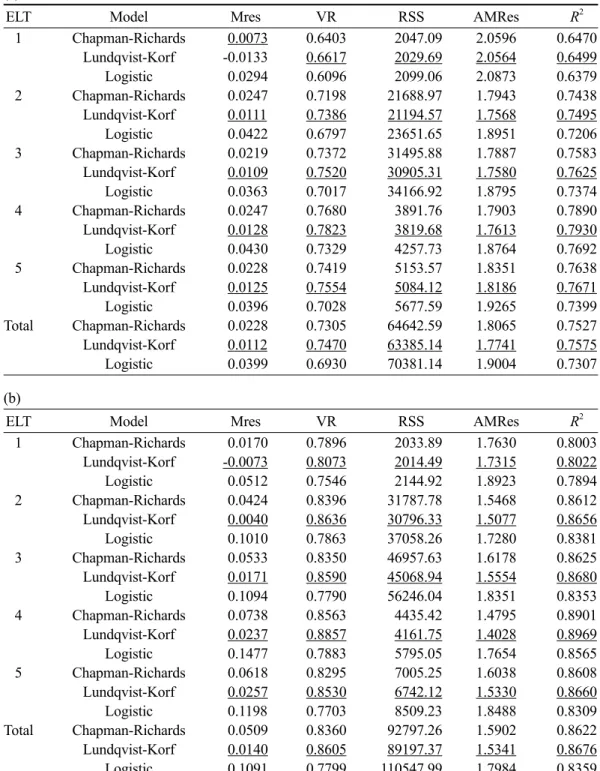
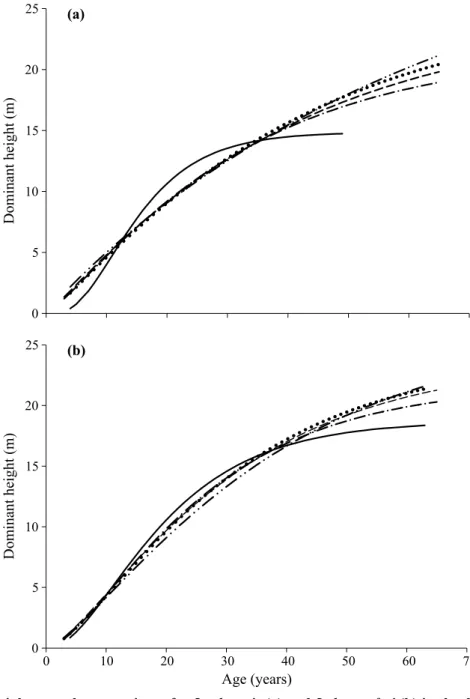
This study compared the growth of 2 larch plantations located in different land types in east- ern Liaoning Province, China based on forest inventory data and mathematical models. Results demonstrated that the Chapman-Richards function was the most suitable model for the study site.

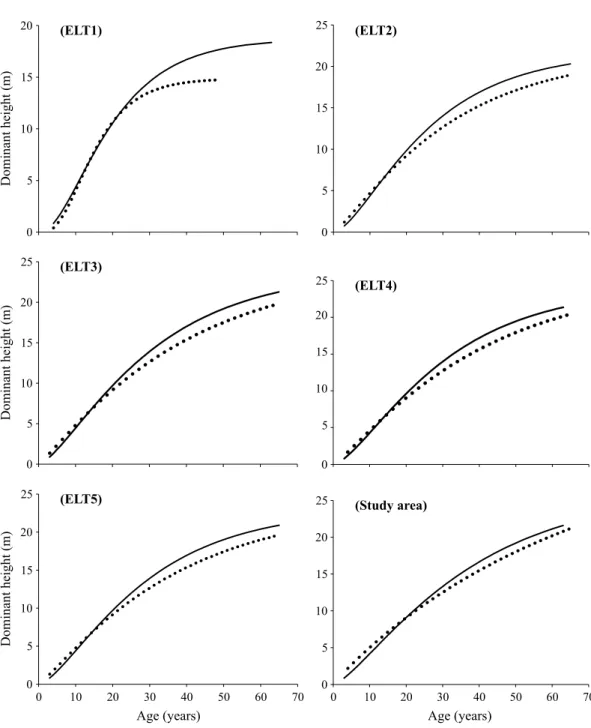
The ecological land type (ELT) classification system is an effective tool for larch plantation zoning.

Gentle slopes, including ELT2 and ELT3, were the best sites for larch plantations. Larix kaempferi showed greater growth than did L. olgensis. This research also indicated that species selection, such as L. kaempferi, was a key for forest plantation establishment and future stand development.

Thus, species and site selections are key components for consideration in forest management prac- tices.

Key words: Chapman-Richards function, forest inventory data, Larix kaempferi, Larix olgensis, mathematical models.

Gu HY. 2013. Modeling and comparing height growth of larch plantations in different land types in Eastern Liaoning Province, Northeast China. Taiwan J For Sci 28(2):67-81.

1)School of Forestry, Northeast Forestry Univ., Harbin 150040, China. 東北林業大學林學院,150040 黑龍江省哈爾濱市和興路26號。

2)Corresponding author, e-mail:ghuiyan@nefu.edu.cn 通訊作者。

Received September 2012, Accepted May 2013. 2012年9月送審 2013年5月通過。

(2)

研究報告

中國遼寧東部不同土地類型落葉松人工林高生長比較

谷會岩

1,2)

摘 要

本文依據林業的二類調查數據,結合數學模型,比較了遼寧東部不同土地類型落葉松人工林的高 生長狀况,研究結果表明:Chapman-Richards function適合比較落葉松人工林高生長狀况,土地的ELT 分類系統適合落葉松人工林的立地區劃,緩坡最適合落葉松人工林高生長,日本落葉松比長白落葉松 高生長好,是更適合發展落葉松人工林的樹種。

關鍵詞:Chapman-Richards function、林葉二類調查數據、日本落葉松、長白落葉松、數學模型。

谷會岩。2013。中國遼寧東部不同土地類型落葉松人工林高生長比較。台灣林業科學28(2):67-81。

INTRODUCTION

Larch plantations have been developed throughout Northeast China, with a total area of 313 x 10

6

m

2

based on a 1994~1998 for- est inventory. Larch trees grow quickly and have relatively high economic value. Over the last few decades, many studies focused on the biology, physiology, and ecology of larch plantations in China (e.g., Wang and Zhang 1992, Li and Zhou 2000, Wang et al. 2000, Wu and Wang 2000, Wang et al. 2001, Sun et al. 2005). Among them, site productivity has been a central topic (Li et al. 1992, Liu 1995, Liu et al. 1998, Chen 2003, Weng and Chen 2004). Biological growth coupled with site quality has very rarely been considered (Hägglund 1981, Avery and Burkhart 1994).

Thus, we attempted to evaluate plantation tree growth under different site productivity conditions to provide further information for managing larch plantations in Northeast Chi- na. Larix olgensis, native to Liaoning, China, and L. kaempferi, introduced from Japan, are 2 common plantation species in the study region. Such regionally focused species-level

comparative studies exploring the genetic growth potentials of these 2 species and rela- tions to site productivity are rare in the litera- ture. Therefore, this study may provide new information on the productivities of these 2 commercial species in various ecological land types (ELTs) across the region.

MATERIALS AND METHODS Study area

The study sites were located in Benxi City in eastern Liaoning Province, China.

Benxi City is located at 123°34′~125°46′E and 40°49′~41°35′N, and occupies an approx- imate area of 8420 km

2

(Fig. 1). This region is in the transition zone from mountains to hills, and features a temperate continental climate with long, cold winters and short, warm sum- mers. The annual mean temperature is 7~8℃.

The average annual precipitation is 750 mm,

mainly falling in July and August. The veg-

etation types are pine and larch plantations

and secondary-growth forests.

(3)

ELTs

Ecological classification of forestlands has become an important step toward ecologi- cal management of forests. In North America, ecological classification has been widely used to pursue sustainable forest management (Hall 2001, Hirvonen 2001, Abella et al. 2003).

In Northeast China, ecological classification has been studied for mountain forest sustain- ability (Dai et al. 2003, Tang et al. 2006).

ELTs are a basic component of the ecological classification system and can be used in forest management planning. In this study, we ad- opted this classification system to divide our study into 5 ELTs: bottomlands, dry-gentle slopes, mesic-gentle slopes, dry-steep slopes, and mesic-steep slopes (Table 1).

Data

Forest inventory data were provided

by the Benxi Forestry Bureau. In summary, the forest inventory plots were surveyed in May~September 1990 and 1991 on 1773 ha of larch plantations. Table 2 shows selected data from larch plantations, and Figs. 2 and 3 plot height vs. age of larch trees. These data were used for initial model selection and parameter estimation for all ELTs and study areas.

Growth model candidates

Three mathematical functions were cho- sen to model tree growth: the Chapman-Rich- ards function, the Lundqvist-Korf function, and the logistic function. All 3 are S-shaped curves and are widely used to model domi- nant height growth (Bertalanffy 1949, 1957, Lundqvist 1957, Richard 1959, Rennolls 1995, Amaro 1998, Duan and Zhang 2004).

They have the following forms:

Fig. 1. Map of the study area showing the location of the study.

Table 1. Ecological land type (ELT) classification system in eastern Liaoning Province, China

Aspect (Azimuth) Slope (°) ELT no. Description

- ≤ 5 1 Bottomlands

135~315 5~25 2 Dry-gentle slopes

≤ 135 or ≥ 315 5~25 3 Mesic-gentle slopes

135~315 ≥ 25 4 Dry-steep slopes

≤ 135 or ≥ 315 ≥ 25 5 Mesic-steep slopes

(4)

Chapman-Richards function

H = A(1 – e

-kt

)

m

; (1)

Lundqvist-Korf function

H = Ae ; and (2)

Logistic function

H = A/[1 + e

(k – mt)

]; (3) where A is the asymptote of the height, k is a measure of the growth rate, m is a shape pa- rameter, and t is the age of the stand of trees (yr).

Growth in different ELTs of the study area was modeled using these functions. All parameters in Eqs. 1~3 were estimated by a least-squares technique in SPSS 10.0 (SPSS, Chicago, IL, USA). A number of graphical and statistical methods are used to perform model validation (Reynolds et al. 1988, Mayer and Butler 1993, Janssen 1995, Soares et al. 1995). The mean residual (Mres), vari- ance ratio (VR), residual sum of squares (RSS), absolute mean residual (AMRes), and Table 2. Characteristics of Larix olgensis (a) and L. kaempferi (b) based on forest inventory data used in the model selection and parameter estimation procedures

(a)

ELT Number of plots Measured variable Average (minimum~maximum) Standard deviation

1 285 Stand age (yr) 21.55 (4~49) 10.21

Dominant height (m) 9.72 (0.4~22.3) 4.52

2 4195 Stand age (yr) 22.98 (3~65) 11.45

Dominant height (m) 9.69 (0.3~24.8) 4.49

3 6257 Stand age (yr) 23.91 (3~65) 11.71

Dominant height (m) 10.04 (0.3~27.3) 4.56

4 749 Stand age (yr) 24.80 (4~65) 12.69

Dominant height (m) 10.27 (0.3~27.1) 4.97

5 990 Stand age (yr) 24.49 (4~65) 12.13

Dominant height (m) 10.26 (0.4~24.5) 4.70

Total 12,476 Stand age (yr) 23.64 (3~65) 11.71

Dominant height (m) 9.94 (0.3~27.3) 4.58

(b)

ELT Number of plots Measured variable Average (minimum~maximum) Standard deviation

1 368 Stand age (yr) 20.00 (4~63) 11.37

Dominant height (m) 9.31 (0.5~24.4) 5.27

2 7266 Stand age (yr) 18.21 (3~65) 12.42

Dominant height (m) 8.02 (0.2~29.2) 5.61

3 10243 Stand age (yr) 19.44 (3~65) 12.90

Dominant height (m) 8.57 (0.3~29.3) 5.77

4 1199 Stand age (yr) 17.79 (3~63) 12.76

Dominant height (m) 7.71 (0.3~27.1) 5.80

5 1559 Stand age (yr) 19.16 (3~63) 12.53

Dominant height (m) 8.10 (0.4~28.4) 5.68

Total 20,635 Stand age (yr) 18.90 (3~65) 12.69

Dominant height (m) 8.30 (0.2~29.3) 5.71

ELT, ecological land type.

(5)

Fig. 2. Model comparisons of Larix olgensis using sub-compartment data (triangles) based

on the Chapman-Richards function (long dashed line), Lundqvist-Korf function (solid line),

logistic line (dotted line), and mean residuals (short dashed line with diamonds for the

Chapman-Richards function, solid line with circles for the Lundqvist-Korf function, and

dotted line with triangles for the logistic line).

(6)

Fig. 2. Model comparisons of Larix olgensis using sub-compartment data (triangles) based

on the Chapman-Richards function (long dashed line), Lundqvist-Korf function (solid line),

logistic line (dotted line), and mean residuals (short dashed line with diamonds for the

Chapman-Richards function, solid line with circles for the Lundqvist-Korf function, and

dotted line with triangles for the logistic line).

(7)

Fig. 3. Model comparisons of Larix kaempferi using sub-compartment data (triangles) based

on the Chapman-Richards function (long dashed line), Lundqvist-Korf function (solid line),

logistic line (dotted line), and mean residuals (short dashed line with diamonds for the

Chapman-Richards function, solid line with circles for the Lundqvist-Korf function, and

dotted line with triangles for the logistic line).

(8)

Fig. 3. Model comparisons of Larix kaempferi using sub-compartment data (triangles) based

on the Chapman-Richards function (long dashed line), Lundqvist-Korf function (solid line),

logistic line (dotted line), and mean residuals (short dashed line with diamonds for the

Chapman-Richards function, solid line with circles for the Lundqvist-Korf function, and

dotted line with triangles for the logistic line).

(9)

coefficient of determination (R

2

) were com- puted (Amaro et al. 1998). These are all based on a comparison of observed and estimated values.

RESULTS AND DISCUSSION Model comparison and selection

Table 3 shows estimates of all of the parameters, and computations of Mres, VR, RSS, AMRes and R

2

are given in Table 4.

Parameter k in the Lundqvist-Korf function for L. olgensis in ELT1 was designated the origin. The asymptote of the Lundqvist-Korf function ranged 16.74~107.82 and was the largest of the 3 functions for the same species cultivated in the same ELT. Growth curves of these 3 functions showed similar trends, except for differences in the young (< 10 yr) and old (> 40 yr) plantations. Also, the mean residual increased as the age increased (Figs.

2, 3). All R

2

values of these functions for the 2 larch plantations were > 0.6.

Based on R

2

values, the Lundqvist-Korf function gave the best fit, and the logistic function gave the worst fit of the 3 func- tions. There was no inflection point of the Chapman-Richards function for L. olgensis in ELT5, because the shape parameter was

< 1 (Liu and Li 2003). The high accuracy of the Lundquist-Korf function was related to the relatively low inflection point (Duan and Zhang 2004). The observed respective maxi- mum heights of L. olgensis and L. kaempferi were 27.3 and 29.3 m (Table 1). Although the Lundquist-Korf function gave the best overall fit, the estimated asymptote was too large to agree with the observed data. Model selection is a compromise between biological and statistical considerations (Amaro et al.

1998, Anta and Aranda 2005). The Chapman- Richards function was chosen to describe the growth of the 2 larch plantations.

Height growth comparisons of different species

In all ELTs and in the entire study area, L. kaempferi showed greater growth than L.

olgensis (Fig. 4). This result is consistent with findings of Yao et al. (1989), whose study was also based on a young larch plantation.

Although L. kaempferi’s height growth was faster than the native species, determining whether to choose this species for a wide- spread plantation species in this region de- pends on its ecological impacts, which need further study.

Height growth comparisons of differing ELTs Upon comparing the growth between different ELTs (Fig. 5), there was only a sig- nificant difference for ELT1. According to Li et al. (1992), the steepness of the slope of the land has the greatest effect on the growth of L.

olgensis, at least in Liaoning Province, China.

No significant difference between mesic and dry slopes of the same gradient is built into the ELT classification scheme. An azimuth of 135°~315° is considered a dry slope; a dry- mesic slope was not considered, according to the ELT classification system. The average height after 40 yr of growth was also com- puted, since most larch plantations are logged at this age. Heights after 40 yr did not signifi- cantly differ among ELT2, ELT3, ELT4, and ELT5 (Table 3). The study area can therefore be divided into 2 zones: a low-productivity zone of ELT1, and a high-productivity zone composed of ELT2, ELT3, ELT4, and ELT5.

Based on these results, all of the study zone

is suitable for larch plantations, except for

bottomlands. Steep slopes, including ELT4

and ELT5, tend to suffer water and soil loss

and should be designated an ecological for-

est zone (Zhang et al. 2006). Gentle slopes,

including ELT2 and ELT3, should be used as

the main larch plantation zone.

(10)

Table 3. Estimated parameters, inflection points, and SI (40) (height of larch at age 40) of Larix olgensis (a) and L. kaempferi (b) in the model functions

(a)

ELT Model Parameters Inflection points SI (22)

A k m Abscissa Ordinate

1 Chapman-Richards 14.8722 0.1244 3.8581 10.8535 4.6739 14.4801 Lundqvist-Korf 16.7405 81.4256 1.7317 9.7518 3.4569 14.5984 Logistic 14.3031 2.8206 0.1969 14.3250 7.1516 14.2125 2 Chapman-Richards 21.6800 0.0352 1.2591 6.5453 2.9619 15.2282 Lundqvist-Korf 37.4877 8.7523 0.6141 7.0913 2.7064 15.1132 Logistic 17.3438 1.8795 0.0978 19.2178 8.6719 15.3348 3 Chapman-Richards 24.4769 0.0273 1.1404 4.8124 2.2457 15.3567 Lundqvist-Korf 51.3790 7.6298 0.4985 6.4785 2.5427 15.2741 Logistic 18.3260 1.8298 0.0886 20.6524 9.1630 15.5291 4 Chapman-Richards 25.4717 0.0275 1.2033 6.7297 2.9980 15.6506 Lundqvist-Korf 54.7418 8.0683 0.5036 7.1994 2.7647 15.5451 Logistic 19.7272 1.9161 0.0837 22.8925 9.8636 15.9237

5 Chapman-Richards 34.2718 0.0142 0.9515 15.4661

Lundqvist-Korf 107.8221 6.8217 0.3401 7.8663 2.0963 11.1804 Logistic 20.4721 1.7625 0.0738 23.8821 10.2361 15.6950 Total Chapman-Richards 23.6633 0.0294 1.7112 18.2719 5.2672 12.5868 Lundqvist-Korf 45.9369 7.9466 0.5355 6.7095 2.6113 15.2568 Logistic 18.1376 1.8396 0.0904 20.3496 9.0688 15.5122 (b)

ELT Model Parameters Inflection points SI (22)

A k M Abscissa Ordinate

1 Chapman-Richards 18.7286 0.0755 2.3020 11.0434 5.0440 16.6911

Lundqvist-Korf 27.2725 15.9740 0.9418 8.7926 3.4697 16.6247

Logistic 16.7451 2.7007 0.1633 16.5383 8.3726 16.3898

2 Chapman-Richards 21.7726 0.0494 1.7070 10.8246 4.8356 16.8766

Lundqvist-Korf 39.1313 10.3568 0.6759 8.2903 3.2786 16.6279

Logistic 17.8541 2.5106 0.1338 18.7638 8.9271 16.8699

3 Chapman-Richards 23.8747 0.0402 1.5184 10.3895 4.6695 17.0041

Lundqvist-Korf 47.1709 9.3280 0.5964 8.1114 3.2448 16.7811

Logistic 18.6977 2.3865 0.1202 19.8544 9.3489 17.1729

4 Chapman-Richards 24.1577 0.0413 1.6004 11.3863 5.0307 17.1856

Lundqvist-Korf 45.7125 10.0910 0.6287 8.6956 3.4274 16.9437

Logistic 19.1366 2.4717 0.1205 20.5120 9.5683 17.4679

5 Chapman-Richards 26.3845 0.0323 1.4351 11.1837 4.7593 16.6403

Lundqvist-Korf 62.2537 8.8777 0.5145 8.6469 3.2791 16.4552

Logistic 19.2481 2.3816 0.1090 21.8495 9.6241 16.9097

Total Chapman-Richards 23.0420 0.0434 1.5900 10.6851 4.7638 16.9300

Lundqvist-Korf 43.8316 9.7440 0.6271 8.2485 3.2730 16.7155

Logistic 18.3395 2.4380 0.1253 19.4573 9.1698 17.0405

ELT, ecological land type; A, asymptote of the height; k, measure of the growth rate; m, slope parameter.

(11)

Table 4. Evaluation of the functions from statistics for Larix olgensis (a) and L. kaempferi (b).

The underlined data are the best value based on the statistical analysis (a)

ELT Model Mres VR RSS AMRes R

2

1 Chapman-Richards 0.0073 0.6403 2047.09 2.0596 0.6470

Lundqvist-Korf -0.0133 0.6617 2029.69 2.0564 0.6499

Logistic 0.0294 0.6096 2099.06 2.0873 0.6379

2 Chapman-Richards 0.0247 0.7198 21688.97 1.7943 0.7438

Lundqvist-Korf 0.0111 0.7386 21194.57 1.7568 0.7495

Logistic 0.0422 0.6797 23651.65 1.8951 0.7206

3 Chapman-Richards 0.0219 0.7372 31495.88 1.7887 0.7583

Lundqvist-Korf 0.0109 0.7520 30905.31 1.7580 0.7625

Logistic 0.0363 0.7017 34166.92 1.8795 0.7374

4 Chapman-Richards 0.0247 0.7680 3891.76 1.7903 0.7890

Lundqvist-Korf 0.0128 0.7823 3819.68 1.7613 0.7930

Logistic 0.0430 0.7329 4257.73 1.8764 0.7692

5 Chapman-Richards 0.0228 0.7419 5153.57 1.8351 0.7638

Lundqvist-Korf 0.0125 0.7554 5084.12 1.8186 0.7671

Logistic 0.0396 0.7028 5677.59 1.9265 0.7399

Total Chapman-Richards 0.0228 0.7305 64642.59 1.8065 0.7527

Lundqvist-Korf 0.0112 0.7470 63385.14 1.7741 0.7575

Logistic 0.0399 0.6930 70381.14 1.9004 0.7307

(b)

ELT Model Mres VR RSS AMRes R

2

1 Chapman-Richards 0.0170 0.7896 2033.89 1.7630 0.8003

Lundqvist-Korf -0.0073 0.8073 2014.49 1.7315 0.8022

Logistic 0.0512 0.7546 2144.92 1.8923 0.7894

2 Chapman-Richards 0.0424 0.8396 31787.78 1.5468 0.8612

Lundqvist-Korf 0.0040 0.8636 30796.33 1.5077 0.8656

Logistic 0.1010 0.7863 37058.26 1.7280 0.8381

3 Chapman-Richards 0.0533 0.8350 46957.63 1.6178 0.8625

Lundqvist-Korf 0.0171 0.8590 45068.94 1.5554 0.8680

Logistic 0.1094 0.7790 56246.04 1.8351 0.8353

4 Chapman-Richards 0.0738 0.8563 4435.42 1.4795 0.8901

Lundqvist-Korf 0.0237 0.8857 4161.75 1.4028 0.8969

Logistic 0.1477 0.7883 5795.05 1.7654 0.8565

5 Chapman-Richards 0.0618 0.8295 7005.25 1.6038 0.8608

Lundqvist-Korf 0.0257 0.8530 6742.12 1.5330 0.8660

Logistic 0.1198 0.7703 8509.23 1.8488 0.8309

Total Chapman-Richards 0.0509 0.8360 92797.26 1.5902 0.8622

Lundqvist-Korf 0.0140 0.8605 89197.37 1.5341 0.8676

Logistic 0.1091 0.7799 110547.99 1.7984 0.8359

ELT, ecological land type; Mres, mean residual; VR, variance ratio; RSS, residual sum of squares;

AMRes, absolute mean residual.

(12)

Fig. 4. Height growth comparisons of Larix olgensis (dotted line) and L. kaempferi (solid line) in different ecological land types (ELTs).

CONCLUSIONS

Based on both biological and statisti- cal considerations, the Chapman-Richards function was most suitable for describing the

height growth of both L. kaempferi and L.

olgensis. The ELT classification system is a

useful tool for deciding where to set up larch

plantations. In the present case, gentle slopes,

including ELT2 and ELT3, should be used

(13)

Fig. 5. Height growth comparisons for L. olgensis (a) and L. kaempferi (b) in the different ELTs (solid line for ELT1, dash-dot line for ELT2, long dash line for ELT3, dotted line for ELT4, dash-dot-dot line for ELT5).

as primary larch plantation areas. In all ELTs and in the overall study area, L. kaempferi showed greater growth than L. olgensis. Larix kaempferi should be widely planted according to the present growth analysis.

ACKNOWLEDGEMENTS

This research was supported by grants

from the Fundamental Research Funds for

Central Universities (DL09EA03-3), and

(14)

the National Natural Science Foundation of China (77373044). We are grateful to Limin Dai and Shunzhong Wang for their great help during the field investigation.

LITERATURE CITED

Abella SR, Shelburne VB, MacDonald NW.

2003. Multifactor classification of forest land- scape ecosystems of Jocassee Gorges, southern Appalachian Mountains, South Carolina. Can J Forest Res 33:1933-46.

Amaro A, Reed D, Tomé M, Themido I.

1998. Modelling dominant height growth: Eu- calyptus plantation in Portugal. For Sci 44:37- 46.

Anta MB, Aranda UD. 2005. Site quality of pedunculate oak (Quercus robur L.) stands in Galicia (northwest Spain). Eur J Forest Res 124:19-28.

Avery TE, Burkhart HE. 1994. Forest mea- surements, 4

th

edn. New York: McGraw-Hill.

408 p.

Bertalanffy LV. 1949. Problems of organic growth. Nature 163:156-8.

Bertalanffy LV. 1957. Quantitative laws in metabolism and growth. Q Rev Biol 32:217-31.

Chen LX. 2003. Relationship between soil organic phosphorus forms in larch planta- tions and tree growth. Chin J Appl Ecol 14(12):2157-61. [in Chinese].

Dai LM, Shao GF, Xiao BY. 2003. Ecological classification for mountain forest sustainability in Northeast China. For Chron 79(2):233-6.

Duan AG, Zhang JG. 2004. Modeling of dominant height growth and building of poly- morphic site index equations of Chinese fir plantation. Sci Silvae Sin 40(6):13-19. [in Chi- nese with English abstract].

Hägglund B. 1981. Evaluation of forest site productivity. For Abstr 42:515-27.

Hall JP. 2001. Criteria and indicators of sus- tainable forest management. Environ Monit

Assess 67(1-2):109-19.

Hirvonen H. 2001. Canada’s national eco- logical framework: an asset to reporting on the health of Canadian forests. For Chron 77(1):111-5.

Janssen PHM, Heuberger PSC. 1995. Cali- bration of process oriented models. Ecol Mod- el 83:55-66.

Li CY, Zhou XF. 2000. Status and future trends in plantation silviculture in China. AM- BIO 29(6):354-5.

Li SZ, Meng KM, Zhao B, Yang XQ. 1992.

Classification of artificial forest site of Larix olgensis in Liaoning Province. Acta Bot Sin 34(1):43-50. [in Chinese].

Liu SR. 1995. Nitrogen cycling and dynamic analysis of man-made larch forest ecosystem.

Plant Soil 168/169(1):391-7.

Liu SR, Li XM, Niu LM. 1998. The degra- dation of soil fertility in pure larch plantation in the northeastern part of China. Ecol Engin 10(1):75-86.

Liu ZG, Li FR. 2003. The generalized Chap- man-Richards function and applications to tree and stand growth. J For Res 14(1):19-26.

Lundquist B. 1957. On the height growth in cultivated stands of pines and spruce in north- ern Sweden. Medd Fran Statens Skogforsk Band 47(2):1-64.

Mayer DG, Butler DG. 1993. Statistical vali- dation. Ecol Model 68:21-32.

Rennolls K. 1995. Forest height growth mod- eling. For Ecol Manage 71:217-25.

Reynolds MR, Burk TM, Huang W. 1988.

Goodness of fit tests and model selection pro- cedures for diameter distributions models. For Sci 34:373-99.

Richards FJ. 1959. A flexible growth function for empirical use. J Exp Bot 10(29):290-300.

Soares P, Tome M, Skovsgaard JP, Vanclay

JK. 1995. Evaluating a growth model for for-

est management using continuous forest inven-

tory data. For Ecol Manage 71:251-65.

(15)

Sun XM, Zhang SG, Kong FB, Sun XJ.

2005. Analyzing parameters of height-age model for open-pollinated Japanese larch fami- lies. Sci Silvae Sin 41(1):78-84. [in Chinese].

Tang LN, Wang QL, Shao GF, Dai LM, Wang SZ, Li XF. 2006. Digitally determining forest inventory units with an ecological classi- fication system. Sci China (E) 49(Suppl):118- 27

Wang YH, Zhou GS, Jiang YL, Yang ZY.

2001. Estimating biomass and NPP of Larix forests using forest inventory data. Acta Phyto- ecol Sin 25(4):420-5. [in Chinese].

Wang Z, Zhang SY. 1992. Larch forest in China, 1

st

edn. Beijing: China Forestry Pub- lishing House. 45 p. [in Chinese].

Wang ZQ, Wu GS, Wang JB. 2000. Applica- tion of competition index in assessing intraspe- cific and interspecific spatial relations between

Manchurian ash and Dahurian larch. Chin J Appl Ecol 11(5):641-5. [in Chinese].

Weng GQ, Chen XF. 2004. Studies on stand dynamic growth model for larch in Jilin in China. J For Res l5(4):323-6.

Wu GS, Wang ZQ. 2000. Individual tree growth-competition model in mixed plantation of Manchurian ash and Dahurian larch. Chin J Appl Ecol 11(5):646-50. [in Chinese].

Yao GQ, Chi GQ, Dong ZQ, Guo DW. 1989.

A study on the growth and economic effec- tiveness of four kinds of planted larch forest.

J Shenyang Agric Univ. 20: 217-22. [in Chi- nese].

Zhang HM, Wang QL, Dai LM, Shao GF,

Tang LN, Wang SZ. 2006. Quantifying soil

erosion with GIS-based RUSLE under differ-

ent forest management options in Jianchang

forest farm. Sci China (E) 49(Suppl):160-6.

(16)

數據

Fig. 1. Map of the study area showing the location of the study.
Fig. 2. Model comparisons of Larix olgensis using sub-compartment data (triangles) based  on the Chapman-Richards function (long dashed line), Lundqvist-Korf function (solid line),  logistic line (dotted line), and mean residuals (short dashed line with di
Fig. 3. Model comparisons of Larix kaempferi using sub-compartment data (triangles) based  on the Chapman-Richards function (long dashed line), Lundqvist-Korf function (solid line),  logistic line (dotted line), and mean residuals (short dashed line with d
+6

參考文獻

相關文件

Application via internet: Please use the on-line application function in Work Permit Application Webpage for Foreign Professional, the address:

Application via internet: Please use the on-line application function in Work Permit Application Webpage for Foreign Professional, the address:

Application via internet: Please use the on-line application function in Work Permit Application Webpage for Foreign Professional, the address:

On the other hand Chandra and Taniguchi (2001) constructed the optimal estimating function esti- mator (G estimator) for ARCH model based on Godambes optimal estimating function

The first row shows the eyespot with white inner ring, black middle ring, and yellow outer ring in Bicyclus anynana.. The second row provides the eyespot with black inner ring

利用 determinant 我 們可以判斷一個 square matrix 是否為 invertible, 也可幫助我們找到一個 invertible matrix 的 inverse, 甚至將聯立方成組的解寫下.

Tseng, Growth behavior of a class of merit functions for the nonlinear comple- mentarity problem, Journal of Optimization Theory and Applications, vol. Fukushima, A new

Then, we tested the influence of θ for the rate of convergence of Algorithm 4.1, by using this algorithm with α = 15 and four different θ to solve a test ex- ample generated as