行政院國家科學委員會專題研究計畫 成果報告
利用電腦模擬系統建立肩關節肌肉生物力學模型(2/2)
計畫類別: 個別型計畫
計畫編號: NSC91-2320-B-006-047-
執行期間: 91 年 08 月 01 日至 92 年 07 月 31 日 執行單位: 國立成功大學醫學工程研究所
計畫主持人: 蘇芳慶
報告類型: 完整報告
處理方式: 本計畫可公開查詢
中 華 民 國 92 年 8 月 11 日
行政院國家科學委員會補助專題研究計畫 成 果 報 告 □期 中進度
報 告
利用電腦模擬系統建立肩關節肌肉生物力學模型 Biomechanical Modeling and Simulation for the Shoulder Using the Computer Gr aphics Model
計畫類別: 個別型計畫 整合型計畫 計畫編號:NSC 91-2320-B-006-047
執行期間: 91 年 8 月 1 日至 92 年 7 月 31 日
計畫主持人:蘇芳慶 共同主持人:趙以甦
計畫參與人員:吳佳慶、李真甄、李金育、林倩如
成果報告類型(依經費核定清單規定繳交):□精簡報告 完整報 告
本成果報告包括以下應繳交之附件:
□赴國外出差或研習心得報告一份
□赴大陸地區出差或研習心得報告一份
□出席國際學術會議心得報告及發表之論文各一份
□國際合作研究計畫國外研究報告書一份
處理方式:除產學合作研究計畫、提升產業技術及人才培育研究 計畫、列管計畫及下列情形者外,得立即公開查詢 □涉及專利或其他智慧財產權,□一年□二年後可公開 查詢
執行單位:國立成功大學醫學工程研究所
中 華 民 國 九 十 二 年 七 月 三 十 日
中文摘要
肩關節活動範圍相當大,但也相對的不穩定,容易造成傷害。由於肩關節盂並不 能提供足夠的關節穩定,肩關節的穩定大部分倚賴周圍的肌群及肌腱等軟組織,
所以肩關節之肌肉力學分析一直是研究者所感興趣的。但由於肩關節結構複雜及 動作範圍相當大,在以往文獻中很少有關於肩關節骨骼肌肉系統之動態電腦模 擬,而在以往動態肌肉力量的分析上,並不能觀察到肌肉力量方向及旋轉力臂的 改變,以致於所得結果並無法證實其準確性。運用電腦影像模擬在骨骼肌肉系統 的分析上,不僅可以幫助我們在建立模型過程中,驗證模型的正確性,並可以讓 使用者輕易的觀察到骨骼肌肉系統在運動過程中相對位置的改變及功能性角色 的轉變,能對骨骼肌肉系統的分析作直接的印證。而棒球投球需肌肉系統作高度 的配合,在以往並沒有肌肉力量的分析,因此以一準確的肌肉力學模型去預測肌 肉表現,以期能提供棒球選手資訊以避免運動傷害及進一步增進表現。因此,本 研究的目的為:
利用本實驗室發展之上肢生物力學模型,由動作分析系統所得之肢體活動資料以 求得肢體在空間中之運動學資料如速度、加速度及關節所承受之作用力及力矩,
並以電腦影像系統模擬骨骼肌肉系統之運動情形及受力情形。以肌肉之生理參數 及數值運算方法,求得肌肉在動態時為維持關節穩定之作用力。利用已發展之肌 肉生物力學模型,分析棒球投球過程中之肌肉作用力,以期進一步了解不同肌肉 之功能,以避免運動傷害。
ABSTRACT
The shoulder joint allows movements in all degrees of freedom and is inherently unstable. Dynamic stability is maintained by the shoulder musculature and rotator cuff during various strenuous extrinsic activities. Due to the complex anatomy and large range of bone and joint movement, few investigations had attempted to develop a dynamic graphics shoulder musculoskeletal model in the past. In the muscle force analysis, previous studies restricted to a static analysis in one position or could be used to determine the dynamic muscle and ligament forces, but no prevision was given to accommodate muscle orientation changes during motion. Furthermore, it was difficult to visualize the 3D musculoskeletal model for validation purpose. A computer-graphics based musculoskeletal analysis system, not only in displaying the geometry relationship during the motion, but also in validation of the results. Baseball pitching is a high demand athletic skill that requires a high level neuromuscular coordination of the muscles of the shoulder. There was no any study about muscle force analysis in the pitching. An accurate musculoskeletal model could apply more information about the function of muscle for preventing injuries, and optimizing performance in pitching activity. Therefore the purposes of this proposed study are to analyze three-dimensional kinematics and kinetics in upper extremity using the developed technique in this lab, and to animate the motion and display the force and moment during motion using the computer graphics model. To predict muscle contraction force in shoulder by using physiological parameters and optimization method. Apply the muscular model to predict muscle contraction forces during pitching for getting more knowledge about muscle function and injury prevention during pitching.
BACKGROUND AND SIGNIFICANCE
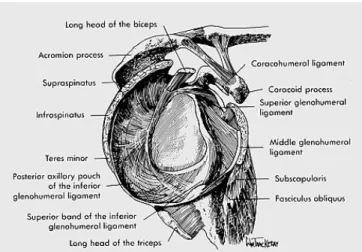
The glenohumeral joint is an inherently unstable joint. The arthrology consists of a large oval humeral head articulating with a small convex glenoid fossa, which represents a ball-and-socket-type joint. This type of joint geometry allows a tremendous amount of movement; however, stability is compromised. So the functional stability of the glenohumeral joint is accomplished by the shoulder dynamic stabilizing components during various strenuous activities. The dynamic stabilizers of the shoulder complex are the rotator cuff musculature, the long head of the biceps brachii, the deltoid, some of the scapulothoracic musculature and ligaments around the joint.
In general, the rotator cuff musculature is responsible for the dynamic stability of the glenohumeral joint. These muscles function to steer the humeral head and control humeral head displacement through a co-contraction of these muscles, which results in increased joint compression forces and contraction causing a tightening of the capsular insertions of the rotator cuff (the musculotendinous glenoid). The rotator cuff also functions as a fine tuner during strenuous activities, especially overhead motions such as throwing, tennis, or elevated work activities. Otherwise, the rotator cuff is one of primary movement, such as with external and internal rotation of the shoulder.
It is obvious that the glenohumeral joint must rely extensively on the shoulder musculature and rotator cuff for dynamic stability during different strenuous activities.
Therefore, the objective documentation of the strength, power and endurance of the shoulder musculature is necessary to predict adequately a return to injury-free sporting activities or strenuous activities.
Fig. 1. Osseous structure of glenohumeral joint; large convex humeral head in relatively small glenoid fossa. (Adopted from the athlete’s shoulder, 1994).
Fig. 2. Schematic drawing of right glenohumeral capsuloligamentous complex (Adopted from Sports injuries of the shoulder, 1994).
Computer graphic display of the musculoskeletal model could be used to visualize the 3-D anatomic relationships among the muscles, bones, and other soft tissue structures. Graphic based musculoskeletal models were developed for biomechanical analysis and preoperative planning for lower extremity (Delp et al., 1990) and wrist (Buford et al., 1990). Buford et al. (1990) developed a kinematic model of the hand that utilized interactive 3-D line drawings obtained from CT scans to facilitate the tendon placement in finger control. This computer model allows simultaneous visualization of the bone and joint surfaces, and the patterns of motion of the distal bone on the proximal bone while movements occurred about the axes of each joint motion. The users of the software were allowed to interactively control the joint angle and view the spatial position of the hand. Delp et al. (1990,1995) created an interactive computer graphic package to analyze the dynamics of the lower extremity. The software enabled modeling of different musculoskeletal joint systems using 3-D shaded computer graphic display and was able to compute the force and joint moment that each muscle can develop for any body position. It also allowed system parameters (muscle-tendon paths, joint motion, and musculotendon parameters) to be altered using a graphic interface. To our knowledge, there was no three-dimensional computer graphic model created in dynamic musculoskeletal shoulder analysis.
Fig. 3. The computer graphics model of lower extremity (Delp et al., 1990).
Due to the complex anatomy and large range of bone and joint movement, few investigations had attempted to develop an acceptable shoulder musculoskeletal model in the past. The first dynamic shoulder model was established by Inman et al in 1944. They used a simplified two-dimensional force analysis to allow solution of the forces across the joint by planar vector analysis. Deltoid and rotator cuff musculature were included in this model and assumed a straight line of muscled contraction action from the origin to the insertion. In 1973, DeLuca et al. located the instantaneous center of rotation of the shoulder on radiographs and calculated the moment arms of the supraspinatus and deltoid muscles. The cross-sectional areas of these muscles were measured from cadaveric specimens and maximal potential forces were estimated. Both of these models were two-dimensional models. They have been restricted to certain motion patterns and could not be useful in general analysis of working situations. Recently, three-dimensional musculoskeletal model about the shoulder had been presented. In 1992, Karlsson et al. constructed a three-dimensional biomechanical model of the shoulder to analyze the contraction force of every muscle, ligament and articular loading during static condition. In this model, the shoulder joint was treated as ball joint, and muscles were described as stretched strings following the shortest path between attachment points. Internal forces acting on the rigid bodies were divided into muscle forces acting along the strings representing the muscles, joint contact forces and ligament forces.
Mathematical optimization was utilized to resolve the indeterminate problem. The minimization of the sum of square muscle stress was used as the functional criteria.
The mechanical equilibrium equations were used as the first constraint. The lower limitation of the muscle force was constrained to zero and upper limitation was the multiplication of the maximum muscle stress and its physiological cross-sectional area. Although the results in this model are not thoroughly matched the EMG results, some muscle activities seemed to be reasonable in comparison with earlier studies.
In 1994, van Der Helm developed a finite element musculoskeletal model of the shoulder mechanism consisting of the thorax, clavicula, scapula and humerus in analysis of the kinematic and dynamic behavior. In the finite element model, each relevant morphological structure was represented by an appropriate element, each muscle was represented by one to six elements to model the mechanical effect adequately. Output variables of the model are the resultant orientations of clavicula, scapula and the muscle forces necessary to counterbalance the external load on the upper extremity (and internal load in the case of dynamic simulations). An optimization procedure was also used to obtain the solution. Four different optimization criteria were compared in this study (minimization of the sum of quadratic muscle forces, sum of quadratic muscle stresses, sum of quadratic muscle forces normalized to the maximal muscle force, maximal muscle stress in the entire mechanism). Nevertheless, no prevision was given to accommodate muscle orientation changes during motion. Furthermore, it was difficult to visualize the 3D musculoskeletal model for validation purpose.
Monte Carlo simulation techniques have also been used in shoulder muscle force calculation (Hughes et al, 1997). This study investigated the use of the Monte Carlo method to predict the statistical distribution of deltoid and rotator cuff muscle forces during static arm elevation. Muscle moment arms were modeled either as independent random variables or jointly distributed random variables. Chang et al (1998) also used Monte Carlo techniques, combined variability of neuromuscular parameters, such as physiological cross section area (PCSA), EMG signal and muscle moment arm, to predict the muscle force in shoulder. The results demonstrated the use of Monte Carlo techniques to describe the statistical distribution of muscle forces, and reduce the variability in anthropometric, geometric, and physiology measures within the population. However, these models simulated shoulder motion in the same plane and just for statistical analysis. This method could not applied in analysis of shoulder in the three dimensional motion.
SPECIFIC AIMS
Hypothesis
The computer-based software for three-dimensional geometric database of the human musculoskeletal system has been developed and available at Orthopaedic Biomechanics Laboratory, Johns Hopkins University. Using a computer graphics workstation, a user of the software can interactively display detailed information about the muscles, tendons, ligaments, bone, and joint anatomy. For the shoulder, although an interactive user-friendly graphics interface enables efficient use and interpretation of the shoulder motion, the integrated biomechanical model, which allow the calculation and display of the motion and forces of the joints, muscles, and tendons as well as moment arms of muscles, is not available. The main difficulty is due to the complexity of structure and function of the shoulder joint. Therefore, this study will use the Virtual, Interactive Musculoskeletal System to create a three-dimensional musculoskeletal model and use numerical analysis to estimate the muscle forces for the shoulder joint through collaboration with the Orthopaedic Biomechanics Laboratory at Johns Hopkins University. Thus this study has two hypotheses:
(1) A computer graphics based musculoskeletal analysis system can be used to quantify the orientation of each dynamic shoulder muscle and ligament. The accurate muscle and ligament orientations can be used to improve the accuracy of the muscle force calculation.
(2) Visualization of the dynamic force calculations within the visual interactive musculoskeletal system will be helpful to validate the model.
Specific Objectives
There are three specific objectives in this study:
(1) To develop a Virtual, Interactive Musculoskeletal System (VIMS) to integrate the skeletal and muscular systems, which will enable efficient use for animation and function analysis of the upper extremity and trunk.
(2) To create muscle force prediction model using a computer graphics based shoulder musculoskeletal model.
(3) To analyze the muscle forces, and joint constraint forces around the shoulder during the pitching motion using the shoulder musculoskeletal model.
RESEARCH DESIGN AND METHODS
Dynamic computer gr aphics musculoskeletal model Dynamic skeletal model
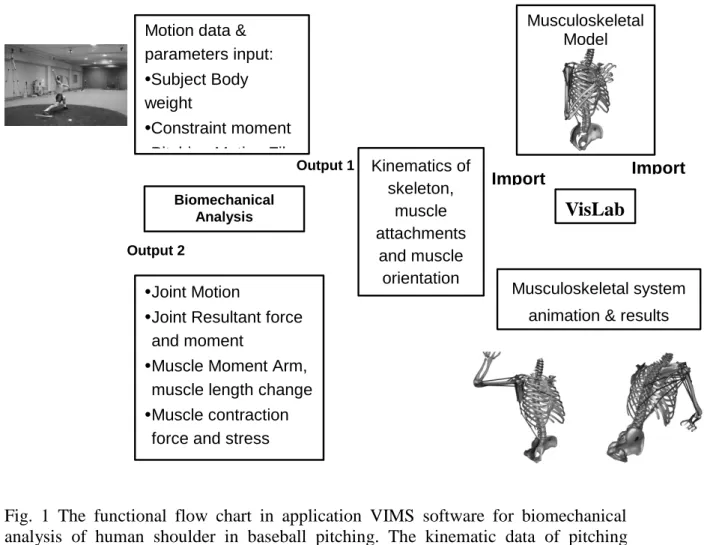
The VIMS is a graphic-based simulation software containing VIMS-Model, VIMS-Tools and VIMS-Lab for biomechanical analyses [20]. When it was applied to baseball pitching analysis, VIMS-Model provided the shoulder anatomic graphic models incorporating bone and soft tissues in different functional positions using animation software, VisLab® (EAI, Ames, IA). VIMS-Tools contained computational algorithms used to quantify the muscle moment arm and various biomechanical analyses. VIMS-Lab was used to study the shoulder biomechanics during the pitching motion in a virtual environment to visualize the model and data graphically as a function of time. The functional flowchart in application of VIMS software for the current study was shown in Figure 1.
Kinematic Data Measurement. To obtain the kinematic data of musculoskeletal movement during baseball pitching, the pitcher’s entire body motion was captured using a QualisysTM motion analysis system (Qualisys AB, Gutenberg, Sweden) at a sampling rate of 500 Hz. A college pitcher was studied in the biomechanics lab in the Nobuhara Hospital, Japan. Thirteen reflective markers were attached on pre-selected anatomic landmarks of the pitching hand, arm, trunk and pelvis of the subject (Fig. 2a). The pitcher threw the ball from a mound to a catcher located 18.44 meters away. A five-segment linkage system including the pitching hand, forearm, upper arm, trunk, and pelvis was adopted for the present study. Each bony segment was modeled as a rigid body and all joints were modeled as ball-and-socket joints. The shoulder joint movement during baseball pitching was divided into the “wind up”, the “early cocking” phase, the “late cocking” phase, the
“acceleration” phase, and the “follow through” phase (Fig. 2a).
Reference Coor dinate Systems for Shoulder Motion. In order to describe the relative motion of the arm and trunk in reference to the pelvis during the baseball pitching, five moving orthogonal coordinate systems were defined based on the positions of the reflective markers to specify the relative orientation of each segment and display it on the computer graphic model [21] (Fig. 2a). The z-axis of the humerus reference coordinate system was defined from the middle point of medial and lateral epicondyle of the elbow to the acromion angle. The x-axis was defined as
the unit vector of the cross-product of the vector from the acromion angle to the lateral epicondyle and the z-axis. The y-axis was the cross-product of the z- and x-axes. This coordinate system is fixed to the center of the humeral head and it will move with the humerus for the convenience to define muscle line of action with its insertion on the humerus. In calculating muscle moment arm, this humerus fixed coordinate system was used for each muscle during pitching action. In the neutral position, the motion of the humerus with respect to its x-axis is define as abduction/adduction, about the y-axis is flexion/extension, and about the z-axis is internal/external rotation which matches the commonly accepted anatomic definition for shoulder motion. However, when the humerus moves to its extreme positions during baseball pitching, the inherent moment arm definition used for biomechanical analysis does not follow the common shoulder motion reference.
For the forearm, the y-axis was defined as the unit vector from the ulnar to the radial styloids. The x-axis was defined as the unit vector of the cross-product of the vector from the middle point of the medial and lateral epicondyle to the ulnar styloid process and the y-axis. The z-axis was defined as the unit vector of the cross-product of the x- and y-axes. The z-axis of the trunk reference coordinate system was the unit vector from the processus xiphoideus to the sternal notch. The y-axis was the unit vector of the cross-product of the vector from the spinous process of the 7th cervical vertebra to the sternal notch and z-axis. The x-axis was the unit vector of the cross-product of the y- and z-axes. For simplicity, the reference system for the hand and pelvis are not discussed here.
To quantify the shoulder motion using the two-axes system, the humerus was rotated using a z-x’-z” Euler angle (the two-axes system) rotation sequence [22]. The first rotation specified as the anterior-posterior rotation, defined the elevation plane from the neutral position of the shoulder through either external or internal rotation about the z-axis of the humerus. The second rotation gave the humerus elevation or depression about the x’ axis. The third rotation was considered the humerus internal/external rotation about the z’’ axis. The selection of this convention was to avoid the singularity problem due to the large elevation motion involved at the shoulder during baseball pitching. It is important to note that such finite rotation definition is always referred back to the neutral position of the shoulder and following the motion sequence defined.
Since the motion of the scapula could not be measured using skin markers, the constrained motion of the scapula with respect to the trunk as a function of humerus motion was adopted from the database in a cadaver study [16]. In that study, an ellipsoidal surface was fit to the surface of the glenoid. The major and minor axes of the ellipsoid defined the z- and x-axes, respectively for the scapula, with the z-axis
oriented superiorly and the x-axis oriented posteriorly. The three-axes Eulerian angle rotation system was used to quantify scapula protraction (z rotation), lateral rotation (x’ rotation), and backward tilt (y’’ rotation) with respect to the trunk.
Musuloskeletal Model Development. The graphic model in current study was constructed and displayed interactively using animation software, VisLab®. The three-dimensional skeleton surface model of the pitching hand and arm plus the trunk and pelvis from the VIMS-Model library was used for the muscle line of action and moment arm analysis during baseball pitching. This surface model was reconstructed from Computed Tomography (CT) data using “marching cubes” surface generation algorithm [23]. The geometric models are in the form of three dimensional meshes, which are stored as arrays of surface nodes with an associated connectivity. The surface shape is fixed to the local coordinate system to facilitate rigid body motion analysis and animation. The surface nodes provided skeleton marker position which allowed determining muscle attachment accurately.
Ten major muscles were included in the glenohumeral (GH) joint model and the muscle attachment (origin/insertion) points were determined from the Visible Human dataset provided by the U.S. National Library of Medicine [24]. For muscles with broad attachment area, they were divided into different branches (the deltoid divided into anterior, middle, and posterior branches; the latissimus dorsi separated into thorax, lumbar, and iliac crest branches; the pectoralis major divided into sternal and clavicular branches) (Fig. 2b). All attachment points (Point) were expressed as the vector relative to the joint center (J_center) in its local coordinate system (Rlocal).
With segment movement in the pitching motion, muscle attachments were fixed in the same position.
) _
'*(Point J center R
vlocal = local −
(1)
Although muscle attachment points were easier to identify, the centroid of the broad origin area of the muscle or it branch was used to approximate its line of action in the present model. However, using straight line from origin to insertion to describe the muscle lines around the shoulder would not adequately represent the muscle path due to the complex morphology causing them to wrap around passive structures.
Therefore, “intermediate points” were introduced to constraint the muscle path (Fig.
3a). In the current study, humeral shaft was assumed to be cylinder, humeral head was treated as sphere. We used an object collision detection algorithm to determine when muscle line of action was in contact with bone surface [25] and combined with the interactive graphic model to visualize the modeling muscle path. The “intermediate points” were located using the “shortest distance” concept between the origin and
insertion points similar to some previous studies [10,25,26]. For the muscles connecting from trunk to humerus such as sternal branch of pectoralis major and latissimus dorsi, one or two more intermediate points would place to constraint the muscle path. These points were set on the most anterior/posterior rib cage, and located on the line between origin and insertion.
Since several muscles are attached to the scapula, the scapular movement was incorporated in the determination of the muscle line of action. The scapula motion with respect to the trunk as a function of humeral elevation angle and elevation plan were adopted from the previously established intrinsic relationship of the passive elevation study [16]. The relationship between three scapula rotational angles, lateral rotation (Scap_x), backward tilt angle (Scap_y) and protraction angle (Scap_z), and GH joint elevation plane rotation (Ele_plane) and elevation angle (Ele_ang) could be expressed as:
Scap_x= 17.5+ (1.793-0.025*Ele_plane-0.143*Ele_ang+ 0.003*(Ele_ang)2);
Scap_y= 13.3+ (0.208-0.043*Ele_plane-0.043*Ele_ang+ 0.001*(Ele_ang)2);
(2)
Scap_z= 35-(3.691-0.088*Ele_plane-0.025*Ele_ang+ 0.001*(Ele_ang)2);
Muscle Moment Ar m Deter mination. Vector analysis was used to determine the resultant moment arm of each muscle and with respect to the glenohumeral joint center using the humerus-fixed coordinate system as the rotational reference axes.
i i
i r
l v τv
×
= (3)
The unit vector of muscle line of action (τvi) was defined from the insertion to the nearest intermediate point or origin along the muscle path. rvi
is the position vector from the joint center of rotation to the muscle insertion.
Fig. 1 The functional flow chart in application VIMS software for biomechanical analysis of human shoulder in baseball pitching. The kinematic data of pitching motion from motion capture system was the input in VIMS software. Applying VIMS-Tool incorporated graphic model from VIMS-Model software to develop a graphic-based biomechanical analysis model in study baseball pitching in shoulder.
Joint motion, kinetics data, muscle moment arm, pitching motion animation and other biomechanical results could be quantified.
VIMS-Model VIMS-Tool
Biomechanical Analysis
Musculoskeletal Model
VisLab
Import
Musculoskeletal system animation & results
display Motion data &
parameters input:
•Subject Body weight
•Constraint moment
•Pitching Motion File
Kinematics of skeleton,
muscle attachments
and muscle orientation
•Joint Motion
•Joint Resultant force and moment
•Muscle Moment Arm, muscle length change
•Muscle contraction force and stress
•Joint constraint force Output 1
Output 2
Import
(a)
(b)
Fig. 2(a) The entire baseball pitching cycle is divided into five phases: the “wind up”;
the “early cocking”, the “late cocking”, the “acceleration”, and the “follow-through”
phases. The junction between early and late cocking phases defines the time point of foot contact, the late cocking and the acceleration phases mark the time point of maximum shoulder external rotation, and the connection between the acceleration and the follow-through phases defines the key time point of ball release. The surface markers used to define the local reference coordinate systems (C.S.) for the pitching hand and arm, the trunk and pelvis during baseball pitching to facilitate kinematic analysis was shown in the middle of this figure. (b) Ten major muscles and their
Wind up Early cocking Late cocking Acceleration Follow through
Foot contact Ball releasing
Upper arm C.S.
Forearm C.S.
Hand C.S.
Trunk C.S.
Global C.S.
Pelvic C.S.
X Z Y
Two branches of the Pectoralis Major Infraspinatus
Posterior Deltoid Triceps long head
Biceps long head Supraspinatus
Teres minor Middle Deltoid
Anterior Deltoid
Teres major Subscapularis
Max External rotation
Three branches of the Latissimus Dorsi
branches across the glenohumeral (GH) joint included for the biomechanical analysis.
The musculoskeletal model in different views helps to visualize the orientation of each muscle and its line of action. The intermediate points of muscles wrapping around the bone and trunk surfaces are also shown.
Muscle Force Analysis Using the inverse dynamic problem solution algorithm (Chao, 1971) and Newtonian analysis, the kinematics (linear and angular displacement, velocity, and acceleration) and kinetics (joint resultant force and moment) data at the shoulder joint could be quantified.
The muscles acting about a joint was modeled as force vectors applied the muscle centroid lines throughout the kinematic range. In VIMS-model, the key muscles and their properties related to each joint function during the baseball pitching are documented to facilitate the dynamic analysis formulation. The internal moment, which is produced by muscle forces and joint constraint forces (ligamentous forces) is required to balance the external moment and inertial moment acting about glenohumeral joint according to the following equations:
i J P
m
i M
i ô F F
Fr r r r
= +
∑
⋅=1
; (1)
∑
=
= +
×
m ⋅
i
P J i
i M
i (r ô ) M M
F
1
r r r
r r
; (2)
where m is the number of muscles included; FriM
represents the muscle force of ith
muscle, τri
represents the unit force vector of ith muscl, Mr P represent intersegmental moment due to external force system, rvi
represents the location of the insertion of the ith muscles with respect to the joint center of rotation. The joint force and moment produced from ligament tension and other soft tissues are lumped within the joint constraint force and moment, FvJ
and Mr J
(Kaufman et al., 1991 (a)).
Quantifying the individual muscle forces is an indeterminate problem, since there are more unknowns than equations. Therefore, numeric optimization technique was combined with the equations of motion to rationally select a set of feasible muscle forces. The nonlinear criterion, which minimizes the sum of squared muscle stresses, was used in the calculation. A proper muscle force solution also required imposition of a muscle constraint. Muscles only exert force in tension so each individual muscle must have a force greater than or equal to zero and less than an upper limit. This could
be expressed as:
Min
∑
(FiM /PCSA)20≤FiM ≤ PCSA*σ i = 1, m (3)
The upper bounded solution space for the muscle force FiM was determined by the physiological cross sectional area (PCSA) (Wood et al., 1989), and the maximum stress in the muscles was set at 115.97 Nm-2(Chang et al., 2000). Sequential quadratic programming search method was used for optimization algorithm.
Results
Baseball pitching motion was as the example in results presentation. In the early cocking phase, the angular displacement at the shoulder was small. At the end of the cocking phase, the humerus rotated externally up to a maximum value of 120°
accompanied with large elevation. In the acceleration phase, the humerus changed from external rotation to internal rotation, and reached maximum elevation angle before ball release. After ball release, the follow through phase began which involved primarily internal rotation and depression (opposite to elevation) of the humerus (Fig.
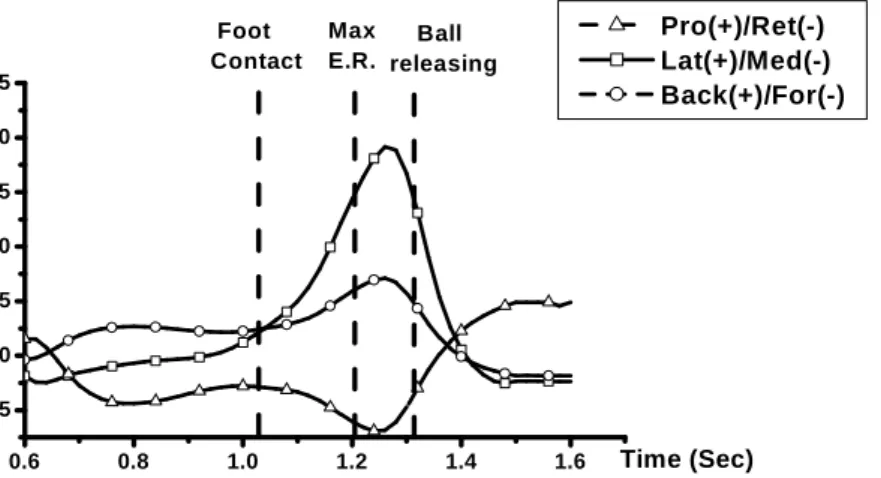
3a). Based on linear regression relationship derived from the existing database between the humerus and scapula [16], the scapula lateral rotation increased and reached its maximum value of approximately 22° in the late cocking phase. Retraction and backward tilting of the scapula were relatively small during the acceleration phase of the pitching cycle (Fig. 3b).
0.6 0.8 1.0 1.2 1.4 1.6
-100 -50 0 50 100 150
Foot contact
Max E.R.
Ph as e I II III IV B all releas in g
Shoulder Joint Angle
A nt(+)/Po s(-) Elev (+)/Dep (-) Int(+)/Ext(-)
Angle (degrees)
Tim e (Sec )
(a)
0.6 0.8 1.0 1.2 1.4 1.6 -5
0 5 10 15 20 25
Fo o t Co n tac t
Max E.R.
Ph as e I II III IV B all releas in g
Scapula Movement
Pro (+)/Ret(-) L at(+)/Med(-) B ack (+)/Fo r(-)
Angle (degrees)
Tim e (Sec)
(b)
Fig. 3(a) The three shoulder joint rotations defined by the 2-axes Eulerian angle system during baseball pitching motion. Ant/Pos represents anterior/posterior rotation about the z-axis defining the plane of elevation. Elev/Dep represents elevation/depression about the x’-axis. Int/Ext represents internal/external rotation about the z’’-axis. (b) The three scapula rotations in reference to a locally fixed coordinate axes to the scapula.
The joint resultant force and moment plots were with the loads expressed in terms of the humerus acting upon the glenoid. In the beginning of early cocking phase, the external joint resultant forces and moments at the shoulder were of moderate magnitudes. At the end of late cocking phase, the external joint resultant force at shoulder joint increased in the centripetal direction and reached its maximum value (851 N) near the instant of ball release. After ball release, the centripetal force was reduced to a value similar to the early cocking phase. The magnitudes of anterior-posterior and superior-inferior shear forces were much lower than the centripetal force during pitching motion except there was a large inferior force occurred just after ball releasing (479 N) (Fig. 4a). The rotation moment changed from internal rotation moment to the external rotation from the late early cocking phase to the late cocking phase and reached its maximum external moment just prior to the instant of maximum external rotation. Elevation moment dramatically increased from the acceleration phase and decreased to depression moment after ball releasing.
Another peak horizontal abduction and internal rotation moment occurred beyond the instant of ball release (Fig. 4b).
0 200 400 600 800
I: ear ly c o c k in g II: lat e c o c k in g III: ac c ler at io n IV: f o llo w th r o u g h J o i n t R es u l t an t Fo r c e i n Sh o u ld er A n t(+)/Po s (-)
Su p (+)/In f (-) CP(+)/CF(-)
Joint Resultant Force (N)
Fig. 4a
Fig. 4b
Fig. 4 The joint resultant force (4a) and moment (4b) during the entire pitching motion. The three directions of the joint resultant force and moment were shown in the legend.
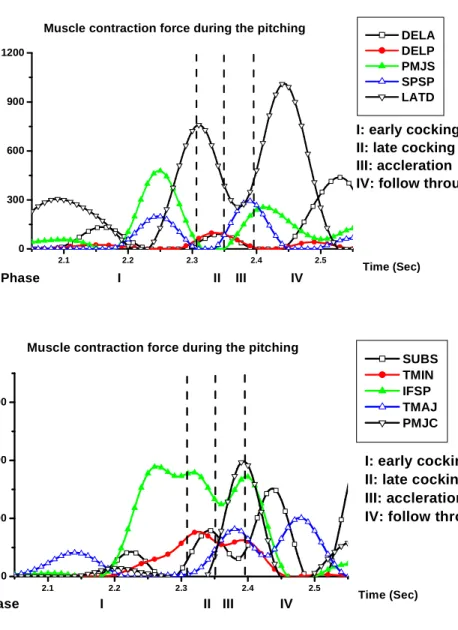
In the beginning of early cocking phase, all muscle contraction forces were small except for the latissimus dorsi (max: 300 N). The sternal branch of the pectoralis major (max: 478 N) and infraspinatus (max: 379 N) didn’t have significant activities until at the end of the early cocking. In the late cocking phase, latissimus dorsi (max:
759 N) and infraspinatus (max: 341 N) had largest contraction force among all muscles. In the acceleration phase, muscle contraction forces of the latissimus dorsi (max: 349 N), clavicle branch of pectoralis major (max: 396 N), supraspinatus (max:
295 N), and infraspinatus (max: 344 N) were significant larger than others. All of them had their maximum value just around ball release. After ball release, the latissimus dorsi reached its maximum force around 1010 N and subscapularis (max:
302 N) was also active in the follow through phase (Fig. 5).
2.1 2.2 2.3 2.4 2.5
-100 -50 0 50 100
I: early cocking II: late cocking III: accleration IV: follow through
Phase I II III IV
Join t Resu ltan t Force in Sh ould er Ho r A dd (+)/A b d(-) Int(+)/Ext(-) Elev(+)/Dep (-)
Joint Resultant Force (N)
Tim e (Sec)
2.1 2.2 2.3 2.4 2.5 0
300 600 900 1200
I: early cocking II: late cocking III: accleration IV: follow through
Phase I II III IV
DELA DELP PMJS SPSP LATD Muscle contraction force during the pitching
Muscle contraction Force (N)
Time (Sec)
2.1 2.2 2.3 2.4 2.5
0 200 400 600
I: early cocking II: late cocking III: accleration IV: follow through
Phase I II III IV
SUBS TMIN IFSP TMAJ PMJC Muscle contraction force during the pitching
Muscle contraction Force (N)
Time (Sec)
Fig. 5 Muscle contraction forces in shoulder during the pitching motion.
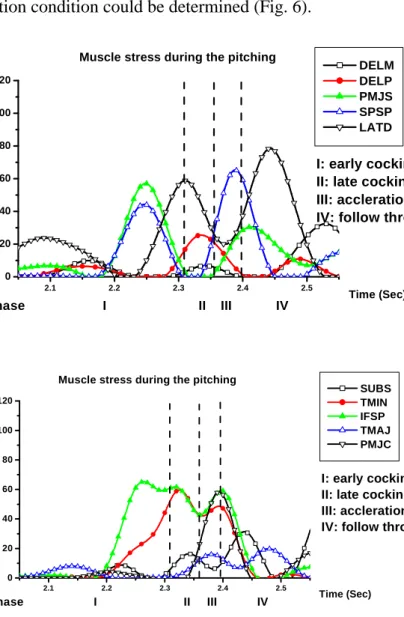
To show the muscle loadings, muscle stress was calculated by taking each muscle force divided by its PCSA. In the beginning of early cocking, muscles stresses were low in magnitude except in latissimus dorsi. At the end of early cocking phase and in late cocking phase, latissimus dorsi, sternal branch of pectoralis major, supraspinatus, infraspinatus, and teres minor were the primary movers whereas the rotator cuff was relatively quiescent. At the end of late cocking and in acceleration phase, supraspinatus, clavicle branch of pectoralis major, teres minor, infraspinatus, and latissimus dorsi had dominant stresses. After ball release, the latissimus dorsi, teres minor, infraspinatus, and sternal branch of the pectoralis major were all still active.
When the humerus depressed, all muscle contractions were reduced. No muscle reached its maximal constraint during the entire pitching cycle. Combined the muscle stresses performance and muscle length change, the maximum muscle stress and
muscle contraction condition could be determined (Fig. 6).
2.1 2.2 2.3 2.4 2.5
0 20 40 60 80 100 120
I: early cocking II: late cocking III: accleration IV: follow through
Phase I II III IV
DELM DELP PMJS SPSP LATD Muscle stress during the pitching
Muscle stress (N/cm2 )
Time (Sec)
2.1 2.2 2.3 2.4 2.5
0 20 40 60 80 100 120
I: early cocking II: late cocking III: accleration IV: follow through
Phase I II III IV
SUBS TMIN IFSP TMAJ PMJC Muscle stress during the pitching
Muscle stress (N/cm2 )
Time (Sec)
Fig. 6 The muscle stress in the pitching motion.
Discussion
Since the main objective of this study was to develop a model for the subsequent biomechanical analysis of the GH joint, only those muscles with attachments on the humerus were included. To further facilitate the inverse dynamic problem solution based on measured baseball pitching kinematics, free-body diagrams, thus the muscle moment arms, were defined based on a locally fixed coordinate system to the humerus for Newtonian formulation. All the data were validated by examining the virtual interactive model which has the required anatomic and dimensional accuracy.
Although this model is generic in nature, it serves the purpose of providing the baseline data for the ensuing biomechanical analysis.
Due to the large range of humerus elevation during baseball pitching, appropriate reference coordinate systems and sequences of rotation are important to define the finite rotations at the shoulder. In this study, the orientation of the humerus with respect to the trunk was calculated using Euler rotations based on a z-x’-z” rotation sequence. In this sequence of rotations, the only discontinuity plane that could produce the singularity problem or the “gimble lock” effect occurs when the humerus moves from abduction to adduction across the frontal plane or abduction beyond 180 degrees. Fortunately, these positions would not occur in most of the normal glenohumeral joint motion including that in baseball pitching. Except for these discontinuity points, all shoulder joint motion can be uniquely defined using the current finite rotation definition [22].
In the current study, our skeleton surface model was reconstructed from CT scan which made it possible to visualize the geometric relations among the muscles and bones in baseball pitching motion. Computer graphics can be used to animate the baseball pitching motion and observe motion from any perspective angle, and manipulate the model into various configurations. Moreover, using “marching cubes”
surface generation algorithm to reconstruct the geometry surface model provides more accurate muscle attachments boundaries in some critical areas.
Determine accurate musculotendon path is very important when developing the musculoskeletal model. Several approaches have been proposed to describe the musculotendon paths. Some investigators assumed the musculotendon path as a straight line between an effective origin and insertion point [27], however, it is not matched the realistic musculoskeletal system. Using a circular arc approach once a certain “critical” joint position is reached [28], it were simplified the musculoskeletal structure and restrict to 2-D analysis. More recently, 3-dimensional mathematical models are provided to predict the musculotendon path from the model geometry [2,10,26]. Delp et al. set “via points” on the fixed segment position to represent the
muscle path. But this method was constrained to certain joint motion. The “via point”
had to be manually determined at every instant joint motion, they did not generate the general algorithm to determined the points [2]. In van der Helm [10] and Charlton [26] study, the musculotendon path was determined by the shortest path from origin to insertion around the interfering structure which described adequately as simple geometric shapes such as sphere and cylinders. The advantage of these models was easy applied in all kinds of joint motion. Similar method was applied in the current study. Intermediate points were used to constrain the muscle line of action while taking into account the scapula rotations in order to redirect the muscles during motion. The graphic model showed that none of the muscle paths pass through bone or other muscles during the pitching motion after using the intermediate point approach to redirect the muscle line of action. Without graphics display, any inaccuracies are difficult to detect. Including scapula movement with the aid of the interactive graphic model also allowed investigation of the “zero position” in baseball pitching more accurately. At the instant of ball release, with the humerus elevated to 135 degrees and 15 degrees anterior to the frontal plane, the long axis of the humerus was well aligned with the scapula spine, which has been referred to as the “zero position” [29]. In addition, without incorporating scapula movement, the pitching motion would have produced impingement of the humerus on the glenoid as visualized from the animation results based on the measured kinematic data.
Direct measurement of muscular forces is invasive and currently impractical. A proper biomechanical model is helpful in understanding the status of muscle contraction from external loading on the body. The VIMS model provided a graphic based musculoskeletal model to predict muscle contraction forces during body movement in pitching.
The patterns of the joint resultant force and moment in this study were similar to those published in the literature (Feltner et al., 1986 and Fleisig et al., 1995). However, the maximum compression force of 851 N was smaller than the previous studies (890 N – 1090 N in the analyses by Feltner et al., 1986; Fleisig et al., 1995). This may be due to the subject not pitching as hard as in the previous studies (ball speed was 33.5 m/sec, compared to 38 m/sec in the analysis by Dillman et al., 1993; Fleisig et al., 1995).
Although in vivo validation of the theoretical results is not feasible, the previous study on electromyography (EMG) analysis provides some information about muscle activities during pitching (Gowan et al., 1987; Glousman, 1993; Hancock et al., 1996).
Those data showed that the deltoid experienced peak activity in early cocking, and diminished in the late cocking, however, we found pectoralis major and latissimus dorsi had more significant activity in the cocking phase. Previous data showed that the
supraspinatus acted in cocking when the arm was abducted and most prone to subluxation, which was consistent with our result. The sternal branch of the pectoralis major, subscapularis, supraspinatus, and latissimus dorsi functioned together as internal rotators and the posterior deltoid acted as the horizontal abductor of the shoulder during acceleration phase in the previous EMG study. These activities were observed in our computed results, except subscapularis did not have a significant activity in the acceleration phase. The magnitudes of muscle stresses were between 50-80 N/cm2 also not as large as expected. In the follow through phase, the subscapularis, posterior deltoid and pectoralis major demonstrated the highest levels of all the glenohumeral muscles in the EMG reports, however, the posterior deltoid didn’t show significant activity in our results. Teres minor had a smaller contraction force but still had a large muscle stress in this phase due to its small PCSA. Some muscles didn’t show significant activities may results from its smaller PCSA and its function replaced by other muscles, which have larger PCSA. Furthermore, Gowan et al. also showed that different level pitchers had different EMG records, and different pitching motion will result different muscle activities pattern.
During activities such as running and jumping, it has been observed that muscles behave as if they were capable of storing and transmitting elastic energy (Komi, 1984).
Cavagna (1977) pointed out muscles were in eccentric-concentric contractions, they would show a surprising increase in force and power of the contraction. In this study, we found that the latissimus dorsi, middle deltoid and teres major contracted eccentrically before ball releasing and changed to concentric contraction during acceleration phase. That could represent that in pitching motion, pitchers also used this kind of muscle mechanism, stored energy in the cocking phase and transformed the power in the acceleration and follow through phase, thereby they could generate larger contraction force and had better performance.
Numerical analysis methods have been broadly applied in solving the indeterminate musculoskeletal problems (Kaufman et al., 1991; Karlsson et al., 1992; van der Helm et al., 1994). The reliability of the predicted results is dependent upon the accuracy of the anatomical and physiological parameters. Our consideration of scapula motion in defining muscle attachment and use of intermediate and wrapping points to constrain the muscle line of action improved the accuracy of the biomechanical model.
Quantification of muscle orientations and moment arms based on this graphic anatomic model gave a better model of the real musculoskeletal system (Lin et al., 2001).
The muscle activation criterion, which is assumed to correspond with the muscle control strategy used by the human body, was used to assess the level of effort required to perform the pitching motion. In this study, minimization of the sum of
squared muscle stresses was used as optimization criterion, although many different optimization criteria have been used in the previous studies. Using minimization of the sum of squared muscle stresses as a criterion has given a closer approximation of real muscle activity in some of the studies (Karlsson et al., 1992; van der Helm et al., 1994). The differences in the calculated of muscle stresses could also be affected by other factors. One major factor is the PCSA, which affects the calculation of muscle stress limit. If a muscle has a larger cross-sectional area, it will be capable of producing larger force. The PCSA of every muscle in this study was adopted from a cadaver study (Wood et al., 1989), and these values probably underestimated the PCSA from the pitcher. Another factor may come from the physiological stress capability of the muscle. The value used in this study was based on the prediction that the experimentally measured joint torque should be equal to or close to the theoretically predicted joint moment (Chang et al., 2000). Other investigators have used lower limits in the past (70 N/cm2 in Karlsson et al., 1992 and 100 N/cm2 in Kaufman et al., 1991(b)) and have reported feasible solutions to the indeterminant problem. However, a simple motion was tested in their studies instead of a complex motion of the joint. Another limitation was that not all the muscles around the shoulder were included especially those muscles attached on the trunk and play important role during pitching, like serratus anterior and rhomboideus. Moreover, the muscle length-tension and velocity-tension relationship were not considered in the current model was its drawback. The present study provided the first attempt to quantitate individual muscle contraction during baseball pitching.
This dynamic shoulder model also could apply in improper muscle co-contraction simulation. If muscle is injured and lost the capacity of muscle contraction, we still could use our model to simulate the muscle contraction situation and find out the compensation of musculoskeleton system.