Cytotoxic Agents with Pharmacophore Modeling and ChemGPS-NP Prediction as Topo II Inhibitors
Chia-Lin Lee
1,2., Ying-Ting Lin
3., Fang-Rong Chang
4,5*, Guan-Yu Chen
2, Anders Backlund
6, Juan- Chang Yang
4, Shu-Li Chen
4, Yang-Chang Wu
1,2,4,7*
1 School of Chinese Medicine, China Medical University, Taichung, Taiwan, 2 Natural Medicinal Products Research Center, China Medical University Hospital, Taichung, Taiwan,3 Department of Biotechnology, Kaohsiung Medical University, Kaohsiung, Taiwan, 4 Graduate Institute of Natural Products, Kaohsiung Medical University, Kaohsiung, Taiwan,5 Cancer Center, Kaohsiung Medical University Hospital, Kaohsiung, Taiwan, 6 Division of Pharmacognosy, Department of Medicinal Chemistry, BMC, Uppsala University, Uppsala, Sweden,7 Center for Molecular Medicine, China Medical University Hospital, Taichung, Taiwan
Abstract
In a structure-activity relationship (SAR) study, 3-methoxy-1,4-phenanthrenequinones, calanquinone A (6a), denbinobin (6b), 5-OAc-calanquinone A (7a) and 5-OAc-denbinobin (7b), have significantly promising cytotoxicity against various human cancer cell lines (IC
500.08–1.66 mg/mL). Moreover, we also established a superior pharmacophore model for cytotoxicity (r = 0.931) containing three hydrogen bond acceptors (HBA1, HBA2 and HBA3) and one hydrophobic feature (HYD) against MCF-7 breast cancer cell line. The pharmacophore model indicates that HBA3 is an essential feature for the oxygen atom of 5-OH in 6a–b and for the carbonyl group of 5-OCOCH
3in 7a–b, important for their cytotoxic properties. The SAR for moderately active 5a–b (5-OCH
3), and highly active 6a–b and 7a–b, are also elaborated in a spatial aspect model.
Further rational design and synthesis of new cytotoxic phenanthrene analogs can be implemented via this model.
Additionally, employing a ChemGPS-NP based model for cytotoxicity mode of action (MOA) provides support for a preliminary classification of compounds 6a–b as topoisomerase II inhibitors.
Citation: Lee C-L, Lin Y-T, Chang F-R, Chen G-Y, Backlund A, et al. (2012) Synthesis and Biological Evaluation of Phenanthrenes as Cytotoxic Agents with Pharmacophore Modeling and ChemGPS-NP Prediction as Topo II Inhibitors. PLoS ONE 7(5): e37897. doi:10.1371/journal.pone.0037897
Editor: Kamyar Afarinkia, Univ of Bradford, United Kingdom
Received February 14, 2012; Accepted April 28, 2012; Published May 29, 2012
Copyright: ß 2012 Lee et al. This is an open-access article distributed under the terms of the Creative Commons Attribution License, which permits unrestricted use, distribution, and reproduction in any medium, provided the original author and source are credited.
Funding: This work was supported by the grants from National Science Council, Taiwan awarded to YW (NSC 99-2113-M-039-003) and the Department of Health, Executive Yuan, Taiwan awarded to KMU (DOH99-TD-C-111-002). The funders had no role in study design, data collection and analysis, decision to publish, or preparation of the manuscript.
Competing Interests: The authors have declared that no competing interests exist.
* E-mail: [email protected] (YCW); [email protected] (FRC) .These authors contributed equally to this work.
Introduction
Natural phenanthrenes are probably generated from photo- chemical cyclization of stilbenes [1]. More than 270 phenan- threnes have been isolated from natural products, especially the family Orchidaceae, and some of them possess various biological activities, including cytotoxicity, antiplatelet aggregation, anti- inflammatory, antimicrobial, spasmolytic, anti-allergic activities and phytotoxicity [1]. In our previous study, calanquinone A [5- hydroxy-3,6,7-trimethoxy-1,4-phenanthrenequinone (5-hydroxy- 3,6,7-trimethoxy-1,4-PQ)] (Figure 1), a new PQ isolated from Calanthe arisanensis in 2008, showed significant cytotoxic activity against human lung (A549), prostate (PC-3 and DU145), colon (HCT-8), breast (MCF-7), nasopharyngeal (KB), and vincristine- resistant nasopharyngeal (KBVIN) cancer cell lines with EC
50values of 0.03–0.45 mg/mL [2,3]. Calanquinone A is related in structure to other naturally occurring cytotoxic PQs, including denbinobin (Figure 1) (5-hydroxy-3,7-dimethoxy-1,4-PQ), sphe- none A (3,6,7-trimethoxy-1,4-PQ), densiflorol B (7-hydroxy-2- methoxy-1,4-PQ), and annoquinone A (3-methoxy-1,4-PQ) [1].
Denbinobin, first isolated from Dendrobium nobile in 1981, is the only 1,4-PQ that has been studied in terms of the cytotoxic
mechanisms of human colon (HCT-116 and COLO 205), lung adenocarcinoma (A549), myelogenous leukemia (K562), and pancreatic adenocarcinoma (BxPC-3) cancer cell lines [4–11].
The data implied that denbinobin could be a potential antican- cer lead compound.
In our preliminary results of cytotoxic structure-activity re- lationship (SAR) studies, calanquinone A (6a) displayed an up to 7-fold greater cytotoxic activity than denbinobin (6b), which is known as a potent cytotoxic agent [4–11], toward human liver (HepG2 and Hep3B), oral (Ca9-22), lung (A549) and breast (MEA-MB-231 and MCF7) cancer cell lines. Up to now, the SAR of PQs and phenanthrenes has only rarely been reported and is worthy of further study. In this research, calanquinone A (6a), denbinobin (6b) and their derivatives were synthesized [3,12,13]
and evaluated for cytotoxic activity. In addition, employing
a ChemGPS-NP based model provides the prediction for
cytotoxicity mode of action (MOA) of calanquinone A (6a) and
denbinobin (6b).
Results and Discussion Chemistry
Eleven natural phenanthrene analogs (CA-1-11) (Figure 2) were isolated from C. arisanensis, and calanquinone A (CA-1) exhibited the highest potency against human cancer cell lines [2,3].
According to the previous results [3], calanquinone A (CA-1) was selected as a lead compound and its derivatives were then synthesized for this study.
We modified the synthetic procedure of Dr. Kraus and his co- workers [12,13] to synthesize all phenanthrene derivatives. As shown in Figure 3, 2-aldehyde-1,4-quinone was prepared by DDQ oxidation of commercially available 2,5-dihydroxybenzaldehyde.
The quinone was coupled with 3,4,5-trimethoxytoluene and 3,5- dimethoxytoluene in the presence of 1 equivalent of trifluoroacetic acid to produce 1a and 1b, respectively. Compounds 1a and 1b were methylated with Me
2SO
4in the presence of K
2CO
3(acetone, 60uC, 5 h) to give the desired 2a and 2b. Cyclization of 2a and 2b with P
4-tBu (benzene, 110 or 140uC, 19–29 h) gave phenanthrenes 3a and 3b, which were oxidized with AgO (6 N HNO
3, acetone, 50uC, 2–3 min) to phenanthrenequinone 4a, 4b and 4c. Addition of methanol to 4a, 4b and 4c catalyzed by ferric sulfate [14] gave 5a–f, respectively (Figure 4). Compounds 7a and 7b were obtained by treatment of 5a and 5b with TMSI (CH
2Cl
2, RT or 60uC, monitored by TLC) to give calanquinone A (6a; CA-1) and denbinobin (6b), followed by treatment with Ac
2O (pyridine, RT, overnight) to selectively remove the methyl group and incorporate an acetyl group at C-5, respectively (Figure 5). It is a characteristic feature of the angular arrangement of 1,4-phenanthrenequinones which led to remarkable selectivity in the cleavage of sterically hindered methyl ether at C-5 even in preference of that at C-3.
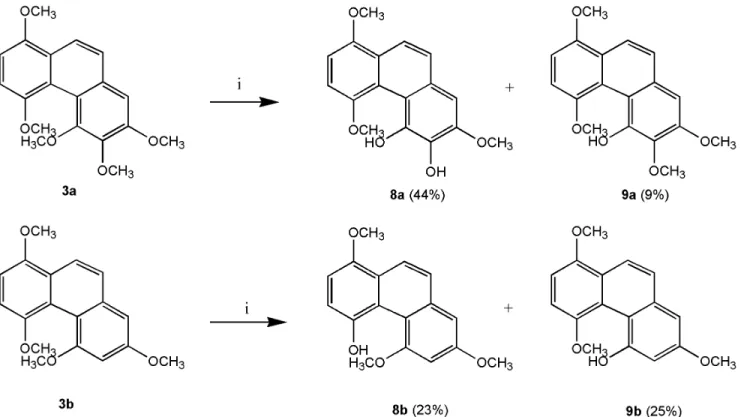
However, applying TMSI to remove the methyl groups in phenanthrenes 3a and 3b was unsuccessful. Finally, cleavage of the methyl ether groups in 3a and 3b with AlCl
3generated compounds 8a & 9a and 8b & 9b, respectively (Figure 6). The excess AlCl
3regioselectively cleaved the methyl ethers only at C-4 and C-5 or C-6 in order to release the steric strain.
Cytotoxicity
The cytotoxic assay of 11 naturally occurring and 19 synthesized phenanthrenes was carried out on a diverse set of
human liver (HepG2 and Hep3B), oral (Ca9-22), lung (A549) and breast (MEA-MB-231 and MCF7) cancer cell lines, and a human fetal lung fibroblast (MRC-5) cell line (Tables 1 and 2).
Doxorubicin was used as a positive control and an IC
50.4 mg/
mL was considered inactive.
Among the 11 naturally occurring compounds [2], calanqui- none A (CA-1) (5-OH, 6-OCH
3) and calanquinone B (CA-2) (5- OCH
3, 6-OH) simply have reversed placements of the OH and one OCH
3group, but CA-2 was much less potent than CA-1 (Figure 2 and Table 1). The SAR results of CA-1 and CA-2 could possibly be explained by intramolecular hydrogen bonding between C = O (C-4) and OH (C-5) groups in 3-methoxy-1,4- PQs that may be a necessary moiety for cytotoxicity. To set up SAR correlations and identify active phenanthrene analogs, calanquinone A (CA-1) was selected as a lead compound for further studies.
Accordingly, 19 analogues including calanquinone A (6a; CA- 1) were synthesized and tested in cytotoxicity assays. As shown in Table 2, calanquinone A (6a) and denbinobin (6b) exhibited significant potency against all cancer cell lines (IC
500.08–
1.06 mg/mL). PQs 7a and 7b also showed very high potency against five cancer cell lines (IC
500.16–1.66 mg/mL), not including HepG2. Conversely and interestingly, PQs 5d and 5e were active only against the HepG2 cancer cell line with IC
50values of 1.49 and 1.24 mg/mL, respectively. PQs 4a, 4b, 4c and phenanthrene 8a displayed selective activity toward the Ca9-22 cancer cell line with IC
50values of 2.17, 3.45, 1.90 and 3.91 mg/mL, respectively. The SAR study of cytotoxicity suggested that the skeleton of 1,4-PQ is preferable to that of phenanthrene. To evaluate a potential SAR of the intramolecular hydrogen bond between C-4 and C-5, 3-methoxy-1,4-PQs 5a–b, 6a–b and 7a–b were designed. Compounds 6a and 6b, with OH at C-5 and C = O at C-4, can form an intramolecular hydrogen bond. However, the hydrogen donors of 5a–b and 7a–b have been replaced with OCH
3and OAc groups, respectively. Among the six 3-methoxy-1,4-PQs, 6a and 6b exhibited the most significant potency, especially 6a (IC
500.08–
0.89 mg/mL). Compounds 5a and 5b showed marginal activities against all human cancer cell lines. Surprisingly, the new 7a and 7b, with OAc at C-5 and C = O at C-4, were active toward five human cancer cell lines (IC
500.16–1.66 mg/mL), but not HepG2. These data also represent the first time we have found this phenomenon in a cytotoxic assay of PQ derivatives. To expand upon the SAR study, all natural and synthesized compounds were used for the 3D pharmacophore model building.
3D Pharmacophore Modeling
To further identify the critical structural features of the phenanthrene analogs, 29 compounds (Figure 2) were used for pharmacophore modeling with Catalyst HypoGen. In this spatial aspect model, the phenanthrene structures and their cytotoxicity toward MCF-7 cancer cell line showed some interesting in- formation.
The best pharmacophore model was established as a result of thirty runs with various parameters and characterized by a best correlation coefficient (0.931), the lowest total cost value (109.366), the highest cost difference (42.417), and the lowest RMS (0.790) (for details see Tables S1, S2 and Figure S1; Text S1). As shown in Figure 7, four essential features, three hydrogen bond acceptors (HBA1, HBA2 and HBA3) and one hydrophobic feature (HYD) were defined. All mutual distances of the four features can be measured. The distances between HBA1 and HBA2 or HBA3 were found to be 5.13 and 7.40 A ˚ , respectively. The distances
Figure 1. Structures of calanquinone A and denbinobin.doi:10.1371/journal.pone.0037897.g001
Phenanthrenes as Cytotoxic Agents
Figure 2. Structural sets used in the pharmacophore study. CA-1,CA-11 and 3a-9b are noted as natural and synthesized compounds, respectively.
doi:10.1371/journal.pone.0037897.g002
between HBA2 and HBA3 or HYD were found to be 5.95 and 5.92 A ˚ , respectively. The distances between HYD and HBA1 or HBA3 were found to be 3.83 and 4.78 A ˚ , respectively. The distance between HBA2 and HBA3 is especially critical for the MCF-7 cytotoxic effect in this model.
The mappings of the best model with all compounds show fit values ranging from 6.18 to 8.57 (Table S3; Text S1).
Calanquinone A (6a) mapped to the best hypothesis model with the fit value of 8.57 reveals significant features in Figure 8A.
Obviously, the HBA1 links to the carbonyl group of quinone ring at C-1, HBA2 links to the oxygen atom of the methoxyl group at C-3, HBA3 links to the oxygen atom of the hydroxyl group at C-5, and HYD aligns to the aromatic ring (B-ring). Compound 6b has a similar alignment as 6a, with a high fit value of 7.95 (Figure 8B and Table S3). As shown in Figures 8C and 8D, 7a and 7b,
which are highly toxic to MCF-7 cells, also match against all features of the best hypothesis in which 7a was originally designed to remove the intramolecular hydrogen bond and was previously speculated to be less cytotoxic. The main difference in structure between 7a–b and 6a–b is the carbonyl group of the acetoxyl substituent at C-5. Consequently, the conserved distance between HBA2 and HBA3 explains why 7a and 7b, with OCOCH
3at C-5 and C = O at C-4 but without the same intramolecular hydrogen bonds as 6a and 6b, can still possess significant cytotoxicity, in contrast to our previous speculation. For less MCF-7 cytotoxic compounds, mismatching one hydrogen bond in the triad and thus disrupting the structures of 5a and 5b results in moderate inhibition, one order higher in mg/mL. The oxygen atom of the methoxyl group at C-6, the carbonyl group at the C-4 position, and the aromatic atom at C-9 of 5a fit into the HBA2, HBA3 and
Figure 3. Synthetic procedure of phenanthrene derivatives. Reagents and conditions: (i) DDQ, benzene, RT. (ii) TFA, ether, RT. (iii) Me2SO4, K2CO3, acetone, reflux. (iv) P4-tBu, benzene, 140uC. (v) AgO, 6 N HNO3, acetone, 60uC.doi:10.1371/journal.pone.0037897.g003
Phenanthrenes as Cytotoxic Agents
HYD, respectively. However, they do not fit into HBA1 (Figure 8E). Also, the carbonyl group at C-1, the oxygen atom of the methoxyl group at C-3, and the aromatic atom at C-9 of 5b match against HBA1, HBA2 and HYD features, but are not linked to HBA3 (Figure 8F).
Thus, HBA1, 2 and 3 complete the triad of the hydrogen acceptor feature and clearly explain the MCF-7 cytotoxic variation of 5a–b, 6a–b and 7a–b. In addition, the hydrophobic feature HYD indicates a pharmacophore anchor for a three-ring core as in phenanthrene and PQ derivatives in the series. The hydropho- bic feature links to all compounds and the HBA feature always
Figure 4. Synthesis of methoxy-phenanthrenequinones. Reagents and conditions: (i) MeOH, Fe2(SO4)3, PTSA, 70uC.doi:10.1371/journal.pone.0037897.g004
Figure 5. Selective demethylation and acetylation of phenanthrenequinones. Reagents and conditions: (i) TMSI, CH2Cl2, RT or 60uC. (ii) Ac2O, pyridine, RT.
doi:10.1371/journal.pone.0037897.g005
links to the carbonyl group at C-1 or C-4 of the quinone ring in all PQs. As a whole, a pharmacophore and explicit SAR were established herein.
ChemGPS-NP Analysis of Calanquinone A (6a) and Denbinobin (6b)
ChemGPS-NP (chemical global positioning system for natural products) is a computational model based on principal component analysis of physical-chemical properties. Such properties can be
estimated directly from structure data, and by performing score prediction in the ChemGPS-NP model, this provides a versatile tool for charting and navigating the biologically relevant chemical space [15]. In a previous study ChemGPS-NP has successfully been used to chart a set of known anticancer agents with different cytotoxic mechanisms. The resulting map has been used as a tool to predict the anticancer Mode of Action (MOA) for new and previously unstudied lead compound [16]. As shown in Figure 9, the two most potent cytotoxic compounds, calanquinone A (6a)
Figure 6. Demethylation of phenanthrenes. Reagents and conditions: (i) AlCl3, benzene, 70uC.doi:10.1371/journal.pone.0037897.g006
Table 1. Cytotoxicity data of natural phenanthrenes isolated from C. arisanensis.
IC50(mg/mL)/Cell line
Compd HepG2 Hep3B Ca9-22 A549 MCF-7 MDA-MB-231 MRC-5
CA-1 0.2160.01 0.2260.00 0.1760.01 0.1160.00 0.0960.00 0.6460.06 0.6560.00
CA-2 14.4760.43 11.9460.55 14.6460.11 18.5060.29 11.9060.08 .20 .20
CA-3 19.7660.16 6.0260.12 12.5560.76 .20 13.2560.00 11.9060.02 .20
CA-4 .20 11.0560.73 15.1260.14 .20 14.3060.18 19.8360.45 .20
CA-5 17.8060.40 9.8760.09 12.1760.03 .20 12.7060.07 11.6660.13 .20
CA-6 .20 11.5060.76 14.5660.31 .20 .20 .20 .20
CA-7 .20 .20 .20 .20 14.6260.34 .20 .20
CA-8 .20 .20 .20 .20 .20 .20 .20
CA-9 .20 12.8960.32 12.9960.42 18.1160.26 10.2560.27 19.4860.58 .20
CA-10 7.5260.00 7.2460.18 6.1160.51 7.4660.32 6.7760.12 7.5660.03 16.3960.36
CA-11 7.1760.35 6.2860.26 5.8660.06 7.4060.01 4.8460.89 7.4260.03 13.1760.33
Doxoa 0.2260.04 0.4960.00 0.1660.02 0.8160.04 0.6760.03 0.7460.01 1.9460.02
aDoxorubicin (Doxo) was used as the positive control.
doi:10.1371/journal.pone.0037897.t001
Phenanthrenes as Cytotoxic Agents
and denbinobin (6b), were predicted in the model. Evaluating their resulting position on the chemical space map, it can be concluded that these phenanthrene derivatives do not unambig- uously belong to any of the well defined groups representing alkylating agents, antimetabolites, proteasome inhibitions, tyrosine kinase inhibitors, topoisomerase I, and tubulin inhibitors except topoisomerase II inhibitors. The preliminary result of this ChemGPS-NP analysis indicates that calanquinone A (6a) and denbinobin (6b) might be members of a topoisomerase II inhibitor, which however, still remains to be further elucidated.
Topoisomerase II Assay
From the ChemGPS-NP analysis, it seems that the MOA for 3-methoxy-1,4-PQs might processes cytotoxicity as a topoisome- rase II inhibitor. In the previous study [17], 1,4-benzoquinone has been found to poison human topoisomerase IIa. According to these results, we chose the most potential calanquinone A (6a) and its moderate compound 5a to test the DNA cleavage assay, in which known etoposide (VP-16) was used as the positive control. As shown in Figure 10, compound 6a showed the inhibition on Topo IIa in the result of the appearance of supercoided DNA instead of the relaxed one at the concentration of 100 mmol/L. Additionally, compound 5a also had the similar effect at higher concentration (200 mmol/L). Moreover, both compounds induced the formation of linear DNA, suggesting that they could possibly trap Topo IIa into DNA cleavage complex. Our data proved PQs inhibit hTopoII in vitro with inducing DNA strand breaks and protein covalently bound to DNA, ultimately leading to cell cycle arrest and death.
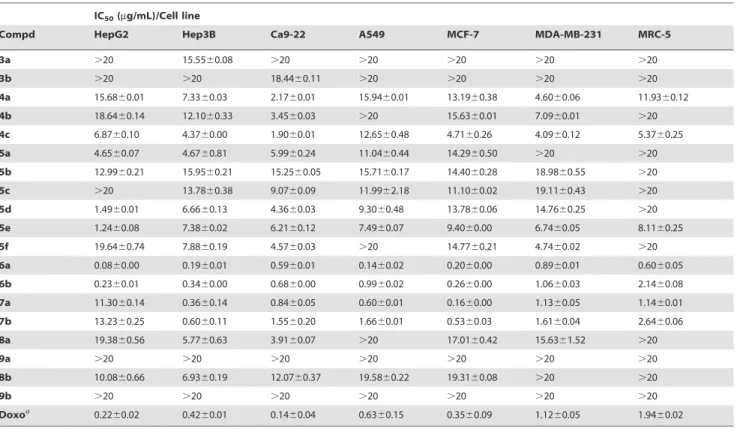
Table 2. Cytotoxicity data of synthesized phenanthrenes.
IC50(mg/mL)/Cell line
Compd HepG2 Hep3B Ca9-22 A549 MCF-7 MDA-MB-231 MRC-5
3a .20 15.5560.08 .20 .20 .20 .20 .20
3b .20 .20 18.4460.11 .20 .20 .20 .20
4a 15.6860.01 7.3360.03 2.1760.01 15.9460.01 13.1960.38 4.6060.06 11.9360.12
4b 18.6460.14 12.1060.33 3.4560.03 .20 15.6360.01 7.0960.01 .20
4c 6.8760.10 4.3760.00 1.9060.01 12.6560.48 4.7160.26 4.0960.12 5.3760.25
5a 4.6560.07 4.6760.81 5.9960.24 11.0460.44 14.2960.50 .20 .20
5b 12.9960.21 15.9560.21 15.2560.05 15.7160.17 14.4060.28 18.9860.55 .20
5c .20 13.7860.38 9.0760.09 11.9962.18 11.1060.02 19.1160.43 .20
5d 1.4960.01 6.6660.13 4.3660.03 9.3060.48 13.7860.06 14.7660.25 .20
5e 1.2460.08 7.3860.02 6.2160.12 7.4960.07 9.4060.00 6.7460.05 8.1160.25
5f 19.6460.74 7.8860.19 4.5760.03 .20 14.7760.21 4.7460.02 .20
6a 0.0860.00 0.1960.01 0.5960.01 0.1460.02 0.2060.00 0.8960.01 0.6060.05
6b 0.2360.01 0.3460.00 0.6860.00 0.9960.02 0.2660.00 1.0660.03 2.1460.08
7a 11.3060.14 0.3660.14 0.8460.05 0.6060.01 0.1660.00 1.1360.05 1.1460.01
7b 13.2360.25 0.6060.11 1.5560.20 1.6660.01 0.5360.03 1.6160.04 2.6460.06
8a 19.3860.56 5.7760.63 3.9160.07 .20 17.0160.42 15.6361.52 .20
9a .20 .20 .20 .20 .20 .20 .20
8b 10.0860.66 6.9360.19 12.0760.37 19.5860.22 19.3160.08 .20 .20
9b .20 .20 .20 .20 .20 .20 .20
Doxoa 0.2260.02 0.4260.01 0.1460.04 0.6360.15 0.3560.09 1.1260.05 1.9460.02
aDoxorubicin (Doxo) was used as the positive control.
doi:10.1371/journal.pone.0037897.t002
Figure 7. The mutual distances of the hydrogen bond triad and the distances between hydrogen bonds and hydrophobic group in the best HypoGen pharmacophore model. The pharmacophore features are colored with green, as are the hydrogen- bond acceptors (HBA1, HBA2 and HBA3). The hydrophobic aromatic feature (HYD) is denoted in cyan. Distances between features are in A˚ ngstro¨m units.
doi:10.1371/journal.pone.0037897.g007
Figure 8. The best HypoGen pharmacophore model mapping onto calanquinone A (6a) and its derivatives. The light and dark green represent active and inactive features, respectively. The models mapped with the compounds6a (A), 6b (B), 7a (C), 7b (D), 5a (E) and 5b (F) are shown here. Pharmacophore features are colored as in Figure 7.
doi:10.1371/journal.pone.0037897.g008
Phenanthrenes as Cytotoxic Agents
Conclusion
In summary, a series of phenanthrene derivatives, including the new derivatives (3a, 4c, 5c–f, 7a, 8a–b and 9a–b), were synthesized in this investigation. On the basis of our SAR studies, 3-methoxy-1,4-PQs 6a (calanquinone A), 6b (denbinobin), 7a (5- OAc-calanquinone A) and 7b (5-OAc-denbinobin) were identified as highly potent cytotoxic agents.
A best ligand-based pharmacophore model against the MCF-7 cancer cell line was successfully established. It explains the SAR of 3-methoxy-1,4-PQs 5a–b (5-OCH
3), 6a–b (5-OH) and 7a–b (5- OCOCH
3) in a spatial aspect model. Highly active 6a, 6b, 7a and 7b possess three hydrogen bond acceptors forming a hydrogen bond triad combined with one hydrophobic group as a pharma- cophore that can interact with a potential target. The revealed pharmacophore model provides a bona fide basis for further design and synthesis of promising phenanthrene structures in vitro to study their anti-breast cancer properties. On the basis of
ChemGPS-NP prediction and TopoII assay assessment, 1,4-PQs were suggested as the topoisomerase II inhibitors. This is the first time to apply ChemGPS-NP to previously untested cytotoxic compounds for MOA prediction. In the future, ChemGPS-NP could be used to effectively find the most possible MOA in the new drug discovery, as suggested by Rose´n and co-workers [16].
Overall, our data demonstrate that PQs could be promising lead compounds for the further development of anti-cancer.
Materials and Methods General
Melting points were determined on a YanacoH digital micro melting point apparatus model MP-500D without correction.
NMR spectra were recorded on Varian Unity-plus 400 MHz FT- NMR and Varian Mercury-plus 400 MHz FT-NMR instruments.
Chemical shift (d) values are in ppm (parts per million) with CDCl
3as the internal standard, and coupling constants (J) are in Hz.
Figure 9. ChemGPS-NP analysis of calanquinone A (6a) and denbinobin (6b). Score plot of the three dimensions (principal components 2–
4) consisting of PC2 (yellow; aromaticity etc.), PC3 (green; lipophilicity etc.) and PC4 (orange; flexibility/rigidity), from analysis of most potent compounds6a and 6b as medium seagreen cubes in the ChemGPS-NP model addressed by Rose´n et al. in 2009 for prediction of MOA. A reference set of known anticancer agents includes alkylating agents (red), anti-metabolites (lime), proteasome inhibitions (cyan), tyrosine kinase inhibitors (orange), topoisomerase I (blue), topoisomerase II (magenta), and tubulin inhibitors (black).
doi:10.1371/journal.pone.0037897.g009
HRESI-MS and ESI-MS measurements were performed on a Bruker Daltonics APEX II 30e mass spectrometer. TLC was performed on Kieselgel 60, F 254 (0.25 nm, Merck), and spots were viewed under ultraviolet light at 254 and 356 nm. For column chromatography, silica gel (Kieselgel 60, 70–230, and 230–400 mesh, Merck) and a BiotageH SP system apparatus were used.
Cytotoxicity ASSAY
Compounds were tested against human liver (HepG2 and Hep3B), oral (Ca9-22), lung (A549), breast (MEA-MB-231 and MCF7) cancer cell lines, and the human fetal lung fibroblast (MRC-5) cell line using an established colorimetric MTT assay protocol [18]. The absorbance was measured at 550 nm using a microplate reader. The IC
50is the concentration of agent that reduced cell growth by 50% under the experimental conditions.
3D Pharmacophore Model
The pharmacophore modeling with Catalyst HypoGen was performed via Discovery Studio 2.1 (Accelrys, San Diego, CA, USA) [19]. Twenty-nine phenanthrene derivatives were collected from the natural plant, C. arisanensis, and from chemical synthesis (Figure 2). Cytotoxicity against MCF-7 cells was determined by the MTT assay and the concentration (mg/mL) of test compound which inhibited 50% of the cancer cells (IC
50) was used in the generation of the pharmacophore model. An IC
50value of .20 mg/mL was defined as 20 mg/mL. All experimental IC
50values spanned about 2–3 orders of magnitude from 0.09 to 20 mg/mL. The 2D/3D structures of compounds were generated using ChemBioOffice 2008 (Cambridge Scientic Computing, Cambridge, Massachusetts, USA) and then optimized in a Dreid- ing force field. The conformational ensemble of each compound was generated using the best conformational analysis method based on a CHARMM force field with a 20 kcal/mol energy threshold above the global minimum. A maximum limit of 255 conformations was used to cover maximum conformational space.
The best 3D arrangements of chemical functionalities should explain the activity variations among the 29 compounds. Thirty runs with different parameters were performed for the best pharmacophore hypothesis. Four chemical features, including hydrogen-bond acceptor (HBA), hydrogen-bond donor (HBD), hydrophobic (HYD), and aromatic ring (AR) features, were also tested during the building of pharmacophore hypotheses (Table S1; Text S1). The best hypotheses were selected via a correlation and a cost analysis in Catalyst HypoGen.
Three costs including the total cost (the sum of weight, error and configuration cost), the null cost and the fixed cost will be evaluated. A total cost that is similar to the fixed cost and far from the null cost indicates statistically significant pharmacophore hypotheses. A difference between the total cost and null cost ranging from 40 to 60 indicates a true correlation of the pharmacophore hypothesis with 75–90% high probability. The true correlation represents ,50% probability when it is less than 40. Generally, the configuration cost should be smaller than 17 in a standard HypoGen model. According to the total cost (109.366), fixed cost (99.558), null cost (151.783), RMS value (0.790), and correlation coefficient (0.931) (Table S2), the best pharmacophore hypothesis, run 22, containing three hydrogen-bond acceptors (HBA1, HBA2, HBA3) and one hydrophobic feature (HYD) was selected (Figure 7).
ChemGPS-NP
The PCA-based model ChemGPS-NP (http://chemgps.bmc.
uu.se) is a tool for navigation in biologically relevant chemical space. It has eight principal components (PC; dimensions), derived from 35 molecular descriptors describing physical-chemical properties such as size, shape, polarizability, lipophilicity, polarity, flexibility, rigidity, and hydrogen bond capacity for a reference set of compounds. The ChemGPS-NP descriptors were calculated for compounds 6a and 6b on the basis of their structure information as simplified molecular input line entry specification (SMILES) using the software DRAGON Professional. Compounds 6a and
Figure 10. Topoisomerase II DNA cleavage assay. An in vitro assay was used to assess the effect of compounds 6a and 5a on the DNA cleavage activity of human TopoII. Etoposide was the positive control. Control lane: TopoIIa+ plasmid DNA. DMSO lane: TopoIIa + plasmid DNA + DMSO.doi:10.1371/journal.pone.0037897.g010
Phenanthrenes as Cytotoxic Agents
6b were then mapped onto ChemGPS-NP using interpolation in terms of PCA score together with a reference set of known anticancer agents with previously studied Mode of Action (MOA) (Anticancer Agent Mechanism Database; http://dtp.nci.nih.gov/
docs/cancer/searches/standard_mechanism.html). Principal com- ponent and PCA score prediction were calculated employing the software SIMCA-P+, with the training set ChemGPS-NP. Prior to PCA determination, all data were centered and scaled to unit variance [16].
Topoisomeras II Assay
Topoisomerase II assay was performed by using a Topo II Drug Screening Kit (TopoGEN, Inc.). In brief, 0.1 mg of pHOT plasmid DNA was incubated with 2 units of topoisomerase IIa in 20 mL assay buffer at 37 uC for 40 min in the presence of tested compounds (6a, 5a) and control drug, etoposide, respectively.
2 mL of 10% SDS and 2.5 mL of 10 mg/mL proteinase K were added into the reaction sample and then incubated for 30 min at 37 uC to digest topoisomerase IIa. The samples were mixed with 2 mL of loading buffer and cleaned up by adding an equal volume of phenol:chloroform:isoamyl alcohol (25:24:1) according to the description. The sample was mixed by vortex and centrifuge for 10 sec. An aliquot (10 mL) of the upper aqueous part was analyzed by electrophoresis with 2% agarose gel containing 0.5 mg/mL of ethidium bromide [20].
3,6-Dihydroxy-29,39,49-trimethoxy-69-methyl-biphenyl-2- carbaldehyde (1a). 2,5-dihydroxybenzaldehyde (3.01 g, 21.79 mmol) and DDQ (9.18 g, 40.42 mmol) were dissolved in dry benzene. The mixture was stirred at RT overnight, and the benzene was then evaporated. The crude product reacted with equimolar amounts of 3,4,5-trimethoxytoluene and trifluoroacetic acid in Et
2O at RT for 24 h or for an extended reaction time to obtain the best yield. The crude product was poured onto ice water and extracted three times with EtOAc. The EtOAc layer was washed once with brine and dried with Na
2SO
4. The product was chromatographed on silica gel and eluted with CH
2Cl
2to give compound 1a (2.14 g, 31.16%).
1H NMR (CDCl
3): d 2.01 (s, 3 H), 3.65 (s, 3 H), 3.87 (s, 3 H), 3.91 (s, 3 H), 4.65 (s, OH), 6.68 (s, 1 H), 6.95 (d, 1 H, J = 8.8 Hz), 7.23 (d, 1 H, J = 8.8 Hz), 9.45 (s, 1 H), 11.38 (s, OH);
13C NMR (CDCl
3): d 19.9, 56.0, 61.0, 61.1, 109.7, 116.2, 117.8, 118.2, 125.2, 125.5, 133.9, 140.5, 145.6, 152.2, 154.4, 156.9, 196.7.
3,6-Dihydroxy-29,49-dimethoxy-69-methyl-biphenyl-2- carbaldehyde (1b). 2,5-dihydroxybenzaldehyde (771.46 mg, 5.59 mmol), DDQ (2.54 g, 11.17 mmol), 3,5-dimethoxytoluene (850 mg, 5.59 mmol), and trifluoroacetic acid were used with the method described for 1a to yield 1b (842.40 mg, 52.69%).
1H NMR (CDCl
3): d 1.91 (s, 3 H), 3.62 (s, 3 H), 3.72 (s, 3 H), 3.85 (s, 3 H), 3.88 (s, 3 H), 3.91 (s, 3 H), 6.58 (s, 1 H), 6.98 (d, 1 H, J = 8.8 Hz), 7.15 (d, 1 H, J = 8.8 Hz), 9.98 (s, 1 H);
13C NMR (CDCl
3): d 19.9, 55.8, 56.1, 56.4, 60.5, 60.9, 108.6, 111.4, 117.0, 120.7, 124.5, 130.4, 132.1, 139.8, 151.0, 151.0, 152.8, 154.6, 191.6.
3,6,29,39,49-Pentamethoxy-69-methyl-biphenyl-2-
carbaldehyde (2a). The hydroquinone 1a (2.15 g, 6.76 mmol) and K
2CO
3(10.25 g, 74.16 mmol) were dissolved in acetone and then dimethyl sulfate (2.13 g, 16.89 mmol) was added. The mixture was stirred at reflux for 5 h, and the K
2CO
3was then removed by filtration through Celite. The crude product was chromatographed on silica gel and eluted with EtOAc/n-hexane (1:2) to yield 2a (1.88 g, 80.57%).
1H NMR (CDCl
3): d 2.03 (s, 3 H), 3.70 (s, 3 H), 3.86 (s, 3 H), 4.58 (s, OH), 6.44 (d, 1 H, J = 2.4 Hz), 6.52 (d, 1 H, J = 2.4 Hz), 6.92 (d, 1 H, J = 8.8 Hz), 7.21 (d, 1 H, J = 8.8 Hz), 9.39 (s, 1 H), 11.35 (s, OH);
13C NMR
(CDCl
3): d 20.2, 55.4, 55.7, 96.5, 107.2, 110.5, 117.9, 125.2, 125.8, 140.8, 145.6, 156.8, 158.0, 159.0, 161.6, 197.0.
3,6,29,49-Tetramethoxy-69-methyl-biphenyl-2-
carbaldehyde (2b). Compound 1b (8.57 mg, 29.76 mmol), K
2CO
3(41 g, 296.65 mmol), and dimethyl sulfate (11.20 g, 88.80 mmol) were used with the method described for 2a to yield 2b (6.23 g, 66.28%).
1H NMR (CDCl
3): d 1.96 (s, 3 H), 3.65 (s, 3 H), 3.69 (s, 3 H), 3.83 (s, 3 H), 3.91 (s, 3 H), 6.37 (d, 1 H, J = 2.4 Hz), 6.44 (d, 1 H, J = 2.4 Hz), 6.96 (d, 1 H, J = 8.8 Hz), 7.14 (d, 1 H, J = 8.8 Hz), 9.85 (s, 1 H);
13C NMR (CDCl
3): d 20.2, 55.2, 55.7, 56.1, 56.7, 96.0, 106.4, 111.3, 115.3, 117.3, 124.7, 131.0, 138.9, 151.2, 154.3, 157.8, 160.2, 192.0.
1,4,5,6,7-Pentamethoxy-phenanthrene (3a). Compound 2a (1.18 g, 3.41 mmol) and P
4-tBu (1 M, 5.50 mL, 5.45 mmol) were placed under N
2in benzene and heated to 140 uC for 29 h.
The solvent was evaporated and the crude product was chromatographed on silica gel eluting with EtOAc/n-hexane (1:2) to yield 3a (1.06 g, 95.04%). Pale yellowish gum;
1H NMR (CDCl
3): d 3.71 (s, 3 H), 3.94 (s, 3 H), 3.99 (s, 3 H), 4.00 (s, 3 H), 4.01 (s, 3 H), 6.91 (d, 1 H, J = 8.8 Hz), 6.98 (d, 1 H, J = 8.8 Hz), 7.00 (s, 1 H), 7.52 (d, 1 H, J = 8.8 Hz), 8.01 (d, 1 H, J = 8.8 Hz);
13
C NMR (CDCl
3): d 56.0, 56.2, 56.5, 60.9, 61.3, 103.09, 105.8, 107.9, 116.8, 119.7, 120.6, 124.3, 126.0, 130.6, 142.2, 149.3, 151.7, 152.5, 152.7; HRESIMS m/z 351.1207 (calculated for C
19H
20O
5Na, 351.1209).
1,4,5,7-Tetramethoxy-phenanthrene (3b). Compound 2b (2.81 g, 8.89 mmol) and P
4-tBu (1 M, 11.50 mL, 11.56 mmol) were placed under N
2in benzene and heated to 110uC for 19 h.
The solvent was evaporated and the crude product was chromatographed on silica gel and eluted with EtOAc/n-hexane (1:7) to yield 3b (3.59 g, 62.93%). Pale orange gum;
1H NMR (CDCl
3): d 3.95 (s, 3 H), 3.96 (s, 3 H), 3.98 (s, 3 H), 4.00 (s, 3 H), 6.72 (d, 1 H, J = 2.4 Hz), 6.85 (d, 1 H, J = 2.4 Hz), 6.90 (d, 1 H, J = 8.4 Hz), 7.01 (d, 1 H, J = 8.4 Hz), 7.53 (d, 1 H, J = 8.8 Hz), 8.07 (d, 1 H, J = 8.8 Hz);
13C NMR (CDCl
3): d 55.4, 55.8, 56.2, 56.3, 98.9, 99.8, 105.5, 108.3, 114.1, 120.7, 121.0, 124.3, 126.0, 135.5, 149.4, 151.5, 158.9, 159.1; ESIMS m/z 321 [M+Na]
+.
5,6,7-Trimethoxy-1,4-phenanthrenequinone (4a) and 5,6,7,59,69,79-hexamethoxy-[8,89]bi-1,4-
phenanthrenequinone (4c). Compound 3a (1.46 g, 4.45 mmol) and AgO (2.20 g, 17.76 mmol) were dissolved in acetone. Oxidation was initiated by addition of 3.70 mL of 6 N HNO
3. The reaction was allowed to stir at 50 uC until the grey suspension disappeared (about 2–3 min). The reaction was quenched immediately with H
2O and CH
2Cl
2. The CH
2Cl
2layer was dried over Na
2SO
4and chromatographed on silica gel and eluted with EtOAc/n-hexane (1:3) to yield 4a (385.46 mg, 29.76%) and 4c (393.85 mg, 14.93%).
Data for 4a: Red solid; mp 134uC;
1H NMR (CDCl
3): d 3.96 (s, 3 H), 4.01 (s, 3 H), 4.04 (s, 3 H), 6.81 (d, 1 H, J = 10.4 Hz), 6.96 (s, 1 H), 7.05 (d, 1 H, J = 10.4 Hz), 7.86 (d, 1 H, J = 8.4 Hz), 7.97 (d, 1 H, J = 8.4 Hz);
13C NMR (CDCl
3): d 56.1, 60.9, 61.2, 102.7, 120.2, 121.4, 130.8, 131.7, 133.3, 134.7, 135.2, 140.3, 143.8, 150.3, 155.7, 184.8, 186.7; ESIMS m/z 321 [M+Na]
+.
Data for 4c: Red solid; mp 100 uC;
1H NMR (CDCl
3): d 3.71 (s, 6 H), 3.99 (s, 6 H), 4.19 (s, 6 H), 6.83 (d, 2 H, J = 10.0 Hz), 7.11 (d, 2 H, J = 10.0 Hz), 7.30 (d, 2 H, J = 8.4 Hz), 7.78 (d, 1 H, J = 8.4 Hz);
13C NMR (CDCl
3): d 60.8, 61.1, 61.4, 119.6, 121.5, 122.1, 130.2, 131.5, 133.7, 134.0, 135.3, 140.4, 146.9, 151.1, 154.6, 184.7, 187.0; HRESIMS m/z 617.1421 (calcd for C
34H
26O
10Na, 617.1424).
5,7-Dimethoxy-1,4-phenanthrenequinone
(4b). Compound 3b (30.45 mg, 0.11 mmol), AgO (48.41 mg,
0.39 mmol), and 0.08 mL 6 N HNO
3were used with the method
described for 4a and 4c. The crude product was chromatographed on silica gel and eluted with EtOAc/n-hexane (1:7) to yield 4b (8.14 mg, 28.80%). Red needles; mp 121uC;
1H NMR (CDCl
3):
d 3.92 (s, 3 H), 3.94 (s, 3 H), 6.69 (d, 1 H, J = 2.4 Hz), 6.76 (d, 1 H, J = 2.4 Hz), 6.78 (d, 1 H, J = 10.4 Hz), 7.03 (d, 1 H, J = 10.4 Hz), 7.85 (d, 1 H, J = 8.8 Hz), 8.01 (d, 1 H, J = 8.8 Hz);
13C NMR (CDCl
3): d 55.6, 55.9, 99.1, 101.9, 116.9, 122.6, 130.4, 131.7, 134.1, 135.0, 139.4, 140.3, 158.3, 161.1, 184.8, 186.7; ESIMS m/z 291 [M+Na]
+.
3,5,6,7-Tetramethoxy-1,4-phenanthrenequinone (5a). p- Toluenesulfonic acid (126.70 mg, 0.67 mmol) and ferric sulfate (276.31 mg, 0.69 mmol) were added into the solution of 4a (97.80 mg, 0.33 mmol) in 23 mL MeOH [14]. The mixture was heated at 70uC for 2 h and poured into water as well as extracted with CH
2Cl
2. The CH
2Cl
2layer was dried over Na
2SO
4and chromatographed on silica gel and eluted with CH
2Cl
2to yield 5a (93.09 mg, 86.48%). Yellow solid; mp 174uC;
1H NMR (CDCl
3):
d 3.93 (s, 3 H), 3.94 (s, 3 H), 4.01 (s, 3 H), 4.08 (s, 3 H), 6.02 (s, 1 H), 6.96 (s, 1 H), 7.87 (d, 1 H, J = 8.4 Hz), 8.00 (d, 1 H, J = 8.4 Hz);
13C NMR (CDCl
3): d 56.0, 56.5, 60.8, 61.1, 102.6, 106.3, 120.3, 121.4, 131.2, 132.1, 132.2, 134.4, 143.8, 150.1, 155.4, 163.0, 182.0, 184.7; ESIMS m/z 351 [M+Na]
+.
3,5,7-Trimethoxy-1,4-phenanthrenequinone (5b) and 3,3,5,7-tetramethoxy-2,3-dihydro-1,4-
phenanthrenequinone (5c). Compound 4b (202.92 mg, 0.76 mmol), p-toluenesulfonic acid (295 mg, 1.55 mmol), ferric sulfate (618 mg, 1.55 mmol) and 40 mL MeOH were used with the method described for 5a. The crude product was chromato- graphed on silica gel and eluted with CH
2Cl
2to yield 5b (183.71 mg, 81.42%) and 5c (11.51 mg, 4.60%).
Data for 5b: Orange solid; mp 179uC;
1H NMR (CDCl
3): d 3.92 (s, 3 H), 3.93 (s, 6 H), 5.99 (s, 1 H), 6.69 (d, 1 H, J = 2.4 Hz), 6.76 (d, 1 H, J = 2.4 Hz), 7.87 (d, 1 H, J = 8.4 Hz), 8.04 (d, 1 H, J = 8.4 Hz);
13C NMR (CDCl
3): d 55.6, 55.9, 56.5, 99.1, 101.9, 106.2, 116.9, 122.6, 130.8, 132.3, 132.7, 139.0, 158.1, 160.8, 162.9, 181.8, 184.6; ESIMS m/z 321 [M+Na]
+.
Data for 5c: Pale yellowish solid; mp 149 uC;
1H NMR (CDCl
3):
d 3.29 (s, 2 H), 3.44 (s, 6 H), 3.92 (s, 3 H), 3.95 (s, 3 H), 6.67 (d, 1 H, J = 2.4 Hz), 6.81 (d, 1 H, J = 2.4 Hz), 7.84 (d, 1 H, J = 8.8 Hz), 7.99 (d, 1 H, J = 8.8 Hz);
13C NMR (CDCl
3):
d 48.8, 50.3, 50.3, 55.6, 55.7, 99.5, 101.2, 101.5, 116.7, 123.2, 131.0, 132.3, 137.5, 139.6, 157.6, 161.4, 191.8, 196.9; HRESIMS m/z 353.0999 (calculated for C
18H
18O
6Na, 353.1001).
3,5,6,7,39,59,6,79-Octamethoxy-[8,89]bi-1,4,19,49-
phenanthrenequinone (5d), 3,5,6,7,39,39,59,6,79- nonamethoxy-2939-dihydro-[8,89]bi-1,4,19,49-
phenanthrenequinone (5e), and 3,5,6,7,19,59,69,79- octamethoxy-[8,89]bi-1,4,59,69-phenanthrenequinone (5f). Compound 4c (196.33 mg, 0.33 mmol), p-toluenesulfonic acid (277.8 mg, 1.46 mmol), ferric sulfate (531.90 mg, 1.33 mmol) and 20 mL MeOH were used with the method described for 5a.
The crude product was chromatographed on silica gel and eluted with EtOAc/n-hexane (1:2) to yield 5d (107.54 mg, 49.70%), 5e (33.57 mg, 14.80%) and 5f (20.32 mg, 9.40%).
Data for 5d: Orange solid; mp 268 uC;
1H NMR (CDCl
3): d 3.71 (s, 6 H), 3.97 (s, 6 H), 3.98 (s, 6 H), 4.22 (s, 6 H), 6.04 (s, 2 H), 7.31 (d, 1 H, J = 8.8 Hz), 7.81 (d, 1 H, J = 8.8 Hz);
13C NMR (CDCl
3): d 56.7, 60.7, 61.1, 61.4, 106.4, 119.7, 121.5, 122.2, 130.8, 132.0, 132.4, 133.8, 146.9, 150.8, 154.3, 163.0, 182.3, 184.4; HRESIMS m/z 677.1639 (calcd for C
36H
30O
12Na, 677.1635).
Data for 5e: Orange solid; mp 124 uC;
1H NMR (CDCl
3): d 3.32 (s, 2 H), 3.50 (s, 3 H), 3.51 (s, 3 H), 3.69 (s, 3 H), 3.71 (s, 3 H), 3.96 (s, 3 H), 3.97 (s, 6 H), 4.20 (s, 3 H), 4.22 (s, 3 H), 6.04 (s,
1 H), 7.24 (d, 1 H, J = 8.8 Hz), 7.30 (d, 1 H, J = 8.8 Hz), 7.72 (d, 1 H, J = 8.8 Hz), 7.81 (d, 1 H, J = 8.8 Hz);
13C NMR (CDCl
3):
d 49.0, 50.4, 50.5, 56.7, 60.5, 60.7, 60.8, 61.1, 61.2, 61.3, 101.7, 106.4, 119.6, 120.0, 121.5, 122.0, 122.2, 122.3, 129.3, 130.8, 132.0, 132.4, 133.3, 133.7, 134.1, 137.5, 146.2, 146.9, 150.3, 150.8, 154.3, 154.9, 163.0, 182.3, 184.4, 191.8, 197.7; HRESIMS m/z 709.1901 (calculated for C
37H
34O
13Na, 709.1897).
Data for 5f: Orange solid; mp 146 uC;
1H NMR (CDCl
3): d 3.69 (s, 3 H), 3.70 (s, 3 H), 3.96 (s, 3 H), 3.97 (s, 3 H), 3.98 (s, 3 H), 3.99 (s, 3 H), 4.19 (s, 3 H), 4.22 (s, 3 H), 5.87 (s, 1 H), 6.04 (s, 1 H), 7.27 (d, 1 H, J = 8.8 Hz), 7.32 (d, 1 H, J = 8.8 Hz), 7.61 (d, 1 H, J = 8.8 Hz), 7.82 (d, 1 H, J = 8.8 Hz);
13C NMR (CDCl
3):
d 56.7, 57.1, 60.7, 61.1, 61.2, 61.3, 101.3, 106.5, 119.5, 119.7, 120.4, 121.5, 122.1, 124.2, 130.9, 131.1, 131.8, 132.0, 132.4, 132.5, 132.7, 133.8, 146.9, 147.0, 150.5, 150.8, 154.0, 154.3, 163.0, 169.2, 182.3, 184.4, 185.0, 186.7; HRESIMS m/z 677.1639 (calculated for C
36H
30O
12Na, 677.1635).
5-Hydroxy-3,6,7-trimethoxy-1,4-phenanthrenequinone;
calanquinone A (6a). Compound 5a (115.02 mg, 0.35 mmol) was dissolved in 5 mL CH
2Cl
2and iodotrimethylsilane (112.23 mg, 0.56 mmol) was added to the solution in portions.
The mixture was stirred at 60 uC overnight (TLC monitoring) and then MeOH was added to quench the reaction. The solvent was evaporated and the residue extracted with Et
2O/H
2O. The Et
2O layer was dried over Na
2SO
4. The mixture was chromatographed on silica gel and eluted with EtOAc/n-hexane (1:2) to yield 6a (15.72 mg, 14.28%). Black solid; mp 187 uC;
1H NMR (CDCl
3):
d 3.96 (s, 3 H), 4.01 (s, 3 H), 4.02 (s, 3 H), 6.14 (s, 1 H), 6.85 (s, 1 H), 8.03 (d, 1 H, J = 8.4 Hz), 8.08 (d, 1 H, J = 8.4 Hz), 10.73 (s, OH);
13C NMR (CDCl
3): d 55.9, 56.9, 60.8, 101.2, 107.2, 118.5, 121.7, 128.1, 132.8, 134.8, 136.9, 140.1, 148.1, 155.0, 161.5, 184.4, 186.0; HRESIMS m/z 313.0648 (calculated for C
17H
14O
6-H, 313.0712).
5-Hydroxy-3,7-dimethoxy-1,4-phenanthrenequinone;
denbinobin (6b). Compound 5b (67.56 mg, 0.23 mmol) and iodotrimethylsilane were used with the method described for 6a.
The crude product was chromatographed on silica gel and eluted with CH
2Cl
2to yield 6b (6.0 mg, 10%). Black solid; mp 215uC [21];
1H NMR (CDCl
3): d 3.93 (s, 3 H), 3.96 (s, 3 H), 6.15 (s, 1 H), 6.82 (d, 1 H, J = 2.8 Hz), 6.93 (d, 1 H, J = 2.8 Hz), 8.06 (d, 1 H, J = 8.8 Hz), 8.12 (d, 1 H, J = 8.8 Hz), 11.00 (s, OH);
13C NMR (CDCl
3): d 55.5, 56.9, 101.8, 107.3, 108.7, 117.2, 122.6, 128.6, 132.4, 137.4, 139.9, 156.4, 160.8, 161.2, 184.4, 186.5;
HRESIMS m/z 307.0584 (calculated for C
16H
12O
5Na, 307.0582).
5-Acetoxy-3,6,7-trimethoxy-1,4-phenanthrenequinone (7a) and 5-acetoxy-3,7-dimethoxy-1,4-phenanthrenequinone (7b). Compounds 6a (3.29 mg, 0.01 mmol) and 6b (2.03 mg, 0.007 mmol) were each dissolved in pyridine and excess Ac
2O was added to the two solutions. The mixture was stirred at RT overnight and the pyridine was evaporated. The crude material was chromatographed on silica gel and eluted with EtOAc/n- hexane (1:2) to afford 7a (4.65 mg, 124.66%) and 7b (2.80 mg, 120.10%), respectively.
Data for 7a: Yellow green solid; mp 196 uC;
1H NMR (CDCl
3):
d 2.36 (s, 3 H), 3.93 (s, 3 H), 3.99 (s, 3 H), 4.03 (s, 3 H), 6.05 (s, 1 H), 7.15 (s, 1 H), 7.97 (d, 1 H, J = 8.8 Hz), 8.07 (d, 1 H, J = 8.8 Hz);
13C NMR (CDCl
3): d 20.8, 56.0, 56.6, 60.8, 106.0, 106.4, 119.4, 121.6, 130.2, 132.1, 133.1, 134.1, 139.7, 144.2, 154.9, 162.7, 168.4, 181.8, 184.4; HRESIMS m/z 379.0791 (calculated for C
19H
16O
7Na, 379.0794).
Data for 7b: Yellow solid; mp 201 uC;
1H NMR (CDCl
3): d 2.32
(s, 3 H), 3.93 (s, 3 H), 3.96 (s, 3 H), 6.06 (s, 1 H), 7.10 (d, 1 H,
J = 2.4 Hz), 7.15 (d, 1 H, J = 2.4 Hz), 8.00 (d, 1 H, J = 8.4 Hz),
Phenanthrenes as Cytotoxic Agents8.11 (d, 1 H, J = 8.4 Hz);
13C NMR (CDCl
3): d 21.1, 55.8, 56.6, 105.3, 106.5, 116.3, 118.2, 122.6, 131.0, 131.6, 133.3, 138.8, 148.0, 159.6, 162.5, 168.8, 181.9, 184.4; HRESIMS m/z 349.0686 (calculated for C
18H
14O
6Na, 349.0688).
5,6-Dihydroxy-1,4,7-trimethoxy-phenanthrene (8a) and 5- hydroxy-1,4,6,7-tetramethoxy-phenanthrene
(9a). Compound 3a (109.39 mg, 0.33 mmol) was dissolved in benzene, and AlCl
3(987 mg, 7.40 mmol) was added to the solution in portions. The mixture was stirred at 70 uC overnight (TLC monitoring) and poured into 50 mL of ice-water along with 5 mL concentrated hydrochloric acid [14]. The suspension was extracted with CH
2Cl
2and dried over Na
2SO
4. The crude material was chromatographed on silica gel and eluted with EtOAc/n-hexane (1:2) to yield 8a (44.49 mg, 44.47%) and 9a (9.33 mg, 8.91%).
Data for 8a: Pale brownish solid; mp 116uC;
1H NMR (CDCl
3):
d 3.94 (s, 3 H), 4.01 (s, 3 H), 4.06 (s, 3 H), 6.33 (s, OH), 6.95 (d, 1 H, J = 8.4 Hz), 6.98 (s, 1 H), 7.20 (d, 1 H, J = 8.4 Hz), 7.60 (d, 1 H, J = 9.6 Hz), 8.03 (d, 1 H, J = 9.6 Hz), 10.77 (s, OH);
13C NMR (CDCl
3): d 56.0, 56.1, 60.7, 101.6, 105.3, 113.2, 113.5, 117.8, 121.0, 124.7, 127.6, 127.7, 135.3, 140.6, 147.7, 147.8, 152.0; HRESIMS m/z 323.0894 (calculated for C
17H
17O
5Na, 323.0895).
Data for 9a: Pale yellowish solid; mp 124uC;
1H NMR (CDCl
3):
d 3.94 (s, 3 H), 3.99 (s, 3 H), 4.01 (s, 3 H), 4.03 (s, 3 H), 6.93 (s, 1 H), 6.96 (d, 1 H, J = 8.4 Hz), 7.21 (d, 1 H, J = 8.4 Hz), 7.59 (d, 1 H, J = 9 Hz), 8.10 (d, 1 H, J = 9 Hz), 10.52 (s, OH);
13C NMR (CDCl
3): d 55.8, 56.2, 60.3, 60.8, 101.1, 105.4, 113.7, 114.2, 119.4, 121.6, 124.5, 127.5, 131.1, 137.9, 147.7, 149.0, 151.9, 153.2; HRESIMS m/z 337.1054 (calculated for C
18H
18O
5Na, 337.1052).
4-Hydroxy-1,5,7-trimethoxy-phenanthrene (8b) and 5- hydroxy-1,4,7-trimethoxy-phenanthrene (9b). Compound 3b (91.65 mg, 0.32 mmol), AlCl
3(509.60 mg, 3.82 mmol), and benzene were used with the method described for 8a and 9a. The crude was chromatographed on silica gel and eluted with EtOAc/
n-hexane (1:7) to yield 8b (20.00 mg, 22.77%) and 9b (22.00 mg, 24.9%).
Data for 8b: Pale brownish solid; mp 71uC;
1H NMR (CDCl
3):
d 3.97 (s, 3 H), 3.99 (s, 3 H), 4.06 (s, 3 H), 6.85 (d, 1 H, J = 2.4 Hz), 7.00 (d, 1 H, J = 8.8 Hz), 7.01 (d, 1 H, J = 2.4 Hz), 7.16 (d, 1 H, J = 8.8 Hz), 7.55 (d, 1 H, J = 8.8 Hz), 8.21 (d, 1 H, J = 8.8 Hz), 9.12 (s, OH);
13C NMR (CDCl
3): d 55.6, 56.4, 58.2, 101.6, 103.4, 107.6, 114.3, 115.6, 119.8, 122.3, 124.1, 125.7,
136.2, 147.5, 149.1, 155.5, 158.3; HRESIMS m/z 307.0948 (calculated for C
17H
16O
4Na, 307.0946).
Data for 9b: Pale brownish solid; mp 70uC;
1H NMR (CDCl
3):
d 3.92 (s, 3 H), 3.94 (s, 3 H), 4.00 (s, 3 H), 6.89 (d, 1 H, J = 2.8 Hz), 6.92 (d, 1 H, J = 2.8 Hz), 6.94 (d, 1 H, J = 8.8 Hz), 7.20 (d, 1 H, J = 8.8 Hz), 7.61 (d, 1 H, J = 8.8 Hz), 8.13 (d, 1 H, J = 8.8Hz), 10.38 (s, OH);
13C NMR (CDCl
3): d 55.3, 56.1, 60.4, 102.5, 104.7, 105.4, 113.1, 114.2, 120.4, 121.8, 124.3, 127.8, 136.4, 147.6, 151.9, 156.4, 159.3; HRESIMS m/z 307.0947 (calculated for C
17H
16O
4Na, 307.0946).
Supporting Information
Figure S1 Pharmacophore of run 19 maps with 6a.
(TIF)
Table S1 The different parameters employed in each run.
(DOC)
Table S2 The pharmacophore results of the best hypothesis in each run.
(DOC)
Table S3 Experimental and predictive values of the compounds in the pharmacophore model.
(DOC)
Table S4 The values of molecular properties used to describe the effects of molecular solubility and transportation.
(DOC)
Text S1 Pharmacophore built with Catalyst HypoGen.
(DOC)
Acknowledgments
We are grateful to the National Center for High-performance Computing for computer time and facilities and also thank the Center for Resources, Research and Development of Kaohsiung Medical University for the ChemBioOffice technical supports.
Author Contributions
Conceived and designed the experiments: CLL FRC YCW. Performed the experiments: CLL GYC AB JCY SLC. Analyzed the data: CLL YTL GYC AB JCY. Contributed reagents/materials/analysis tools: CLL FRC GYC AB JCY YCW. Wrote the paper: CLL YTL.
References
1. Kova´cs A, Vasas A, Hohmann J (2008) Natural phenanthrenes and their biological activity. Phytochemistry 69: 1084–1110.
2. Lee CL, Chang FR, Yen MH, Yu D, Liu YN, et al. (2009) Cytotoxic phenanthrenequinones and 9,10-dihydrophenanthrenes from Calanthe arisanensis.
J Nat Prod 72: 210–213.
3. Lee CL, Nakagawa-Goto K, Yu D, Liu YN, Bastow KF, et al. (2008) Cytotoxic calanquinone A from Calanthe arisanensis and its first total synthesis. Bioorg Med Chem Lett 18: 4275–4277.
4. Yang KC, Uen YH, Suk FM, Liang YC, Wang YJ, et al. (2005) Molecular mechanisms of denbinobin-induced anti-tumorigenesis effect in colon cancer cells. World J Gastroenterol 11: 3040–3045.
5. Chen TH, Pan SL, Guh JH, Chen CC, Huang YT, et al. (2008) Denbinobin induces apoptosis by apoptosis-inducing factor releasing and DNA damage in human colorectal cancer HCT-116 cells. Naunyn-Schmied Arch Pharmacol 378: 447–457.
6. Kuo CT, Hsu MJ, Chen BC, Chen CC, Teng CM, et al. (2008) Denbinobin induces apoptosis in human hung adenocarcinoma cells via Akt inactivation, Bad activation, and mitochondrial dysfunction. Toxicol Lett 177: 48–58.
7. Kuo CT, Chen BC, Yu CC, Weng CM, Hsu MJ, et al. (2009) Apoptosis signal- regulating kinase I mediates denbinobin-induced apoptosis in human lung adenocarcinoma cells. J Biomed Sci 16: 43–57.
8. Huang YC, Guh JH, Teng CM (2005) Denbinobin-mediated anticancer effect in human K562 leukemia cells: role in tubulin polymerization and Bcr-Ab1 activity. J Biomed Sci 12: 113–121.
9. Sa´nchez-Duffhues G, Calzado MA, Garcı´a de Vinuesa A, Appendino G, Fiebich BL, et al. (2009) Denbinobin inhibits nuclear factor-kB and induces apoptosis via reactive oxygen species generation in human leukemic cells.
Biochem Pharmacol 77: 1401–1409.
10. Magwere T (2009) Escaping immune surveillance in cancer: is denbinobin the panacea? British J Pharmacol 157: 1172–1174.
11. Yang CR, Guh JH, Teng CM, Chen CC, Chen PH (2009) Combined treatment with denbinobin and Fas ligand has a synergistic cytotoxic effect in human pancreatic adenocarcinoma BxPC-3 cells. British J Pharmacol 157: 1175–1185.
12. Kraus GA, Hoover K, Zhang N (2002) Synthesis of phenanthrenes from formylbenzoquinone. Tetrahedron Lett 43: 5319–5321.
13. Kraus GA, Zhang N (2002) A direct synthesis of denbinobin. Tetrahedron Lett 43: 9597–9599.
14. Farin˜a F, Molina MT, Paredes MC (1986) Regiospecific addition of alcohols to 9-hydroxy- and 9-methoxy-1,4-anthraquinone. Synth Commun 16: 1015–1027.
15. Larsson J, Gottfries J, Muresan S, Backlund A (2007) ChemGPS-NP: Tuned for navigation in biologically relevant chemical space. J Nat Prod 70: 789–794.
16. Rose´n J, Rickardson L, Backlund A, Gullbo J, Bohlin L, et al. (2009) ChemGPS- NP mapping of chemical compounds for prediction of anticancer mode of action. QSAR Comb Sc 28: 436–446.
17. Lindsey RHJ, Bromberg KD, Felix CA, Osheroff N (2004) 1,4-Benzoquinone is a topoisomerase II poison. Biochemistry 43: 7563–7574.
18. Mosmann T (1983) Rapid colorimetric assay for cellular growth and survival:
application to proliferation and cytotoxicity assays. J Immunol Methods 65:
55–63.
19. Chen CYC (2009) Pharmacoinformatics approach for mPGES-1 in anti- inflammation by 3D-QSAR pharmacophore mapping. J Taiwan Inst Chem Engrs 40: 155–161.
20. Sadiq AA, Patel MR, Jacobson BA, Escobedo M, Ellis K, et al. (2010) Anti- proliferative effects of simocyclinone D8 (SD8), a novel catalytic inhibitor of topoisomerase II. Invest New Drugs 28: 20–25.
21. Krohn K, Loock U, Paavilainen K, Hausen B, Schmalle HW, et al. (2001) Synthesis and electrochemistry of annoquinone-A, cypripedin methyl ether, denbinobin and related 1,4-phenanthrenequinones. ARKIVOC I: 88–130.
Phenanthrenes as Cytotoxic Agents