Chapter 4
Silicon Microring Resonators for Biochemical Sensing Application
This chapter, we use the four different radius of the microring which we designed to distinguish four different concentration analysis. We show the use of our device as a biosensor.
In this chapter, based on our designed radius as chapter 3 mentioned, we will use those parameters of this microring to simulate and analyze the expanding structure for four wavelengths. With different input wavelengths, we will get the unique output wavelength in our design structure. As a result of the excellent stable laser characteristics of Fabry-Pérot resonance, we focus our attentions on the sensitivity of our microring resonators for biochemical sensing.
This chapter is organized as follows: Section 4-1 introduces the sensing mechanics of microring sensors. In the section 4-2 we will introduce the sensing techniques of microring sensors.
The sensitivity of microring resonators is presented in Section 4-3. In section 4-4, we simulate and analyze the expand structure based on designed microring. Finally, we give the summary and discussion in section 4-5.
4-1 Introduction of the Microring Sensors’ Sensing
Mechanisms
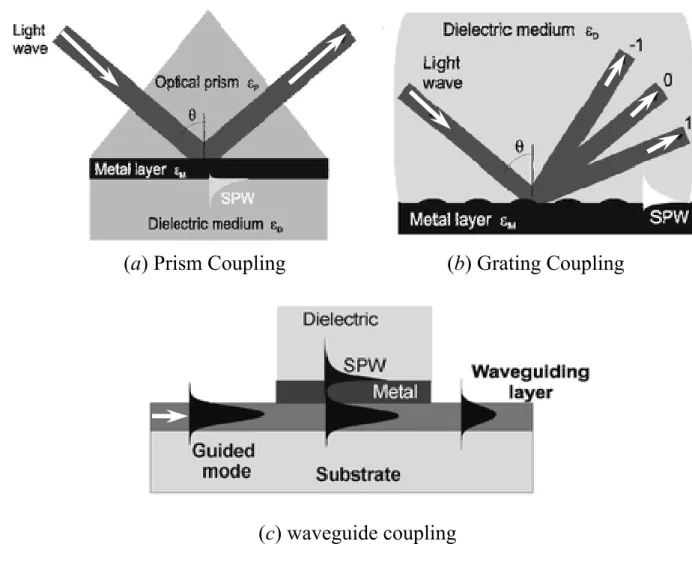
Bio sensors have been used in the applications of biomolecule detection, environmental monitoring, medical diagnostics, food safety, and industrial process control. Within these decades, planar optical sensors are emerging due to several advantages, such as good robustness, easy handling, easy patterning of reagents, simple incorporation of different materials, and high integration capability with photonic and electronic devices. Planar optical sensors include channel waveguide sensors [42], surface plasmon resonance sensors [43], directional coupler sensors [44], interferometric sensors, grating-coupled planar waveguide sensors [45], and micro-resonator sensors [46]. Among different types of planar optical sensors, micro-resonator sensors possess several unique advantages, including compactness, easy integration, long effective interaction length, coherent intensity build-up, and reduced amount of analyze needed. To utilize rnicroring sensors, there are three sensing approaches. The first method is fluorescence sensing [47]. It works using the interaction between the evanescent waves and the fluorophore-labeled analyze that are in close proximity to the device surfaces. The evanescent waves can excite fluorophores to emit fluorescence. The fluorescent intensity is proportional to the amount of analyze. By measuring the fluorescence intensity, the analyze can be detected. However, it requires labeling analytes with fluorophore molecules. The second approach is absorption sensing [48].
The output intensity of a microring at resonance depends on the absorption in a microring, which is highly related to the round-trip attenuation factor.
The detection of analyze can be performed by monitoring the intensity change at a specific resonance. However, it can only detect the analyzes
that can absorb the propagating light. For typical biomolecules, their absorption lies in the ultra-violet (UV) regime, which is not suitable for waveguide sensors because very small waveguides are desired. The third method is effective-index sensing. It utilizes the evanescent wave to interrogate the analytes and relies on accurate measurement of the effective refractive index change of the guided mode inside the waveguides caused by the presence of biomolecules either adsorbed on the sensor surface, or in close vicinity of the device surfaces. The effective index change can be obtained by monitoring the resonant wavelength shift or the intensity variation. In the effective-index sensing, there are two sensing mechanisms, the homogeneous sensing and the surface sensing, which will be described in detail as follows.
4-1-1 Homogeneous Sensing
Homogeneous sensing scheme is used to detect the concentration of analytes in a solution, e.g., glucose in blood. The presence of analytes modifies the refractive index of the solution. Higher concentration leads to larger refractive index. When the solution is introduced onto a waveguide device and serves as the upper-cladding layer of the waveguide structure, different solution index due to different concentrations changes the effective refractive index of the guided mode. According to equation
eff 2
c
n R
m
λ = × π (4-1) When the changes the effective refractive index, the change in the effective index shifts the resonant wavelength. By monitoring the change of
optical properties in microrings, such as the resonant wavelength or the output intensity, a relationship between the analyze concentration and the measured optical parameter can be established. Such relationship can be employed to determine the concentration of analyzes. In this scheme, those molecules in the solution can contribute to the index change.
4-1-2 Surface Sensing
Surface sensing scheme is to intentionally create binding sites on the waveguide surfaces to attract specific analyzes existing in a solution. For example, if antibody molecules are bound on the surface, they are able to attach specific antigen molecules.
The amount of analyzes attached on the sensor surface determines the variation magnitude of optical properties of a microring resonator. This provides a way to selectively detect specific analyzes and enables integration of multiple sensors on a chip that can detect various analyzes simultaneously. An example using a microring resonator is illustrated in Fig. 4-2. In this case, the binding sites can only attach those biomolecules represented by triangles and no fluorescent labels are required.
4-1-3 The Evanescent Wave
Evanescent wave (EW) is one kind of surface physical phenomenon that produce the standing wave (standing wave) which energy declines.
It occurs when light is incident from an optically dense medium onto a less dense medium, total internal reflection takes place as soon as the
emergent angle θ2 reaches 90°.
The total internal reflection will happen from the viewpoint of the requirements of the boundary condition on the border. Since the wave is totally reflected back into the denser medium, no field is supposed to be present inside the less dense medium.
Take wave guide of optic fiber as an example, when the total reflection happens, according to the electromagnetic wave theory, incidence light will all reflect to the high refracting rate core layer and produce the standing wave.
But in fact, electric field energy is not totally confined to the core storey, and some energy will be entered and perpendicular to the medium storey of low refracting rate of axis direction of optic fiber such as fiber clothing layer, air or the liquid environment of awaiting measuring and pierce through the distance between about one wavelength.
Based on the Maxwell’s equations and Fresnel’s reflection equations, we can know that the amplitude of the wave won’t totally disappear in the less dense medium.
In order to understand the principle of EW and its characteristic, we need to adopt basic electromagnetic wave theory derive.
As the Fig.4-1 shows, we suppose one incidence light wave vector ki with the incidence angle θi incident the interface with unsatisfied total reflection condition, k will be divided into pierced through wave vector
kt and reflection wave vector kr partly.
According to Fresnel’s equations, we considering the electric field is
perpendicular to the horizontal electromagnetic wave of the incidence surface (TEM) , such as the following mathematics representative:
0 0
cos cos
cos cos
r i i t t
i i i t t
E n n
r E n n
θ θ
θ θ
⊥
⊥
−
= = + (4-2)
2
2 *
0 0 r i
R E r r r
E ⊥ ⊥ ⊥ ⊥
= = =
(4-3)
where R is the Reflectance,
r⊥ represent the reflection coefficient of interface.
When the total reflection condition is satisfied, it means that the pierce through wave vector exist yet, reflection wave at this moment pierce through wave and reflection wave are unable to satisfied with the boundary condition. It means that θt doesn’t exist when the sin
( )
θt > . 1 Therefore, it can’t calculate the equation (3-1).For above reason, we take a sample transfer about the θt by Snell's
law: sin t i sin i
t
n
θ = n θ
. Thus kt become analytical at this moment and have physics meanings.
We can rewritten the cosθt as :
2
2 2
cos t 1 sin t 1 i sin i
t
n Negative number j
θ = − θ = − n θ = = ± β
(4-4)
Put the equation (4-4) to the equation (4-2) and equation (4-3), and get:
2 2
0 0 2
2
cos 1 sin
cos 1 sin
i
i i t i
r t
i i
i i t i
t
n n n
E n
r E n
n n
n
θ θ
θ θ
⊥
⊥
− −
= =
+ −
(4-5)
2 0 *
0
cos cos
cos cos 1
r i i t i i t
i i i t i i t
E n j n n j n
R r r
E n j n n j n
θ β θ β
θ β θ β
⊥ ⊥
⊥
− +
= = = + − = (4-6)
Therefore the interface will totally reflect the power base on the theory. It applies that Ir =It and It =0, consequently, the evanescent wave don’t have any power.
Next we start from the equation (4-4) and neglect the divergent term jβ
+ which don’t have physics meaning and keep the decay term −jβ. We can derive the mathematics representative that the decrease of electric field energy according to the progressively distance:
( ) ( ) ( )
t , , 0exp exp t i sin i
t
E x z t E z i k n x wt
β n θ
= − −
(4-7) Besides, the effective depth ξ of the penetration of the evanescent wave, which is defined as the depth where the amplitude decays to 1
e of that on the boundary is graphically represented in Fig. 4-2 and the definition is as follow:
0 0
2 2 2 2 2
2 ni sin i nt 2 ni sin i sin c
λ λ
ξ ≡ π θ − = π θ − θ (4-8)
where sin c t
i
n θ = n
4-2 Sensing Techniques of Microring Sensors
In sensing applications, optical properties of a rnicroring resonator are modified by the presence of analyzes. For a microring sensor, there are two approaches to link the amount of analyzes with the measurable optical parameters, including the resonant wavelength shift scheme and the intensity variation scheme.
4-2-1 Resonant Wavelength Shift Scheme
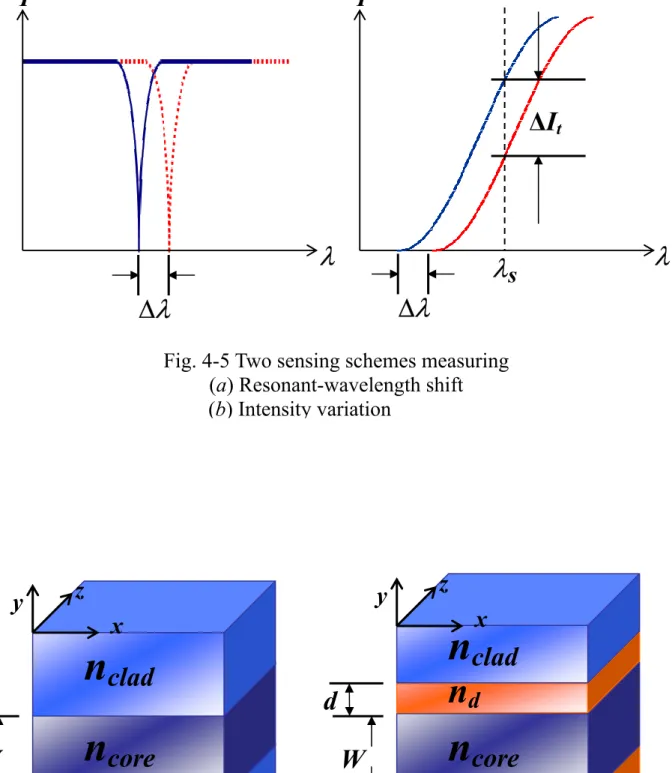
As mentioned previously, analyzes affect the refractive index of upper-cladding in waveguide structure in the homogeneous sensing, while they change the effective index of guided mode within a microring resonator in the surface sensing. According to equation (4-1), both cases result in the shift of a resonant wavelength, as shown in Fig.4-1(a). Such technique is applicable to a large range of concentration detection as long as the resonance shift can be distinguished and within one FSR. However, this scheme needs spectrum measurement that may complicate the experimental setup. As for a microring resonator with a moderate Q-factor, it is not simple to distinguish the resonance shift if the shift is too small.
This means that the detection capability is limited by the Q-factor of microring resonator. Thus, this technique is not suitable for detection of tiny amount of analyzes unless the Q-factors can be greatly enhanced.
4-2-2 Intensity Variation Scheme
Intensity variation scheme is to measure the output intensity of a rnicroring at a fixed wavelength, as shown in Fig. 4-1(b). Microring resonators possess steep slopes near resonance. The steep slope can convert
a small shift of the resonant wavelength into a quite measurable intensity variation. Based on this property, this scheme should be more sensitive than the resonance shift monitoring. In addition, it requires simpler equipment, including a single-wavelength source and a photodetector. This limits the detection range to small amount of analyze. It should be noted that these two schemes could also be applied using the drop port of a rnicroring resonator.
4-3 Design Considerations for Microring Resonators Used in Sensing Applications
In the previous design, air cladding is used. However, in the sensing applications, typically analytes are dissolved in solutions such as water.
During the sensing process, the analyte solution covers the entire microring resonators and this solution simultaneously serves as the upper-cladding layer of the waveguide structure. To facilitate sensing in such aqueous environment, the waveguide should be designed accordingly.
Another important aspect is the size of detected analytes. Microring sensors rely on the evanescent wave to detect analytes. The decaying tail of the evanescent wave in the upper-cladding layer depends on the waveguide structure, and is typically 100 – 300 nm. The longer tail is used to detect larger analyzes, such as bacteria, while shorter tail is used to detect smaller analytes, such as biomolecules (glucose, biotin, etc.). The former requires less confined waveguide structures, which have higher resonator loss. In this thesis, detection of small biomolecules is pursued and therefore,
waveguides with good optical confinement are desired.
According to the simulation results of waveguides with OptiFDTD 4.0 software, the following waveguide parameters could provide single mode operation and good optical confinement: W = 0.3 µm, Gap = 0.1 µm.
In aqueous environments, the refractive index between two coupled waveguides increases. This leads to longer evanescent tail extending into the water cladding. Longer evanescent tail causes more overlapping between the modes guided in two waveguides, and thus stronger crosscoupling can be obtained. As a result, ring geometry could provide sufficient coupling.
In the waveguide design, the waveguide width is intentionally widened to ensure much better optical confinement for the fundamental mode, which yields higher Q-factors. This could also allow weak guidance of the second-order mode.
4-4 The Kind of Bio-Molecular DNA
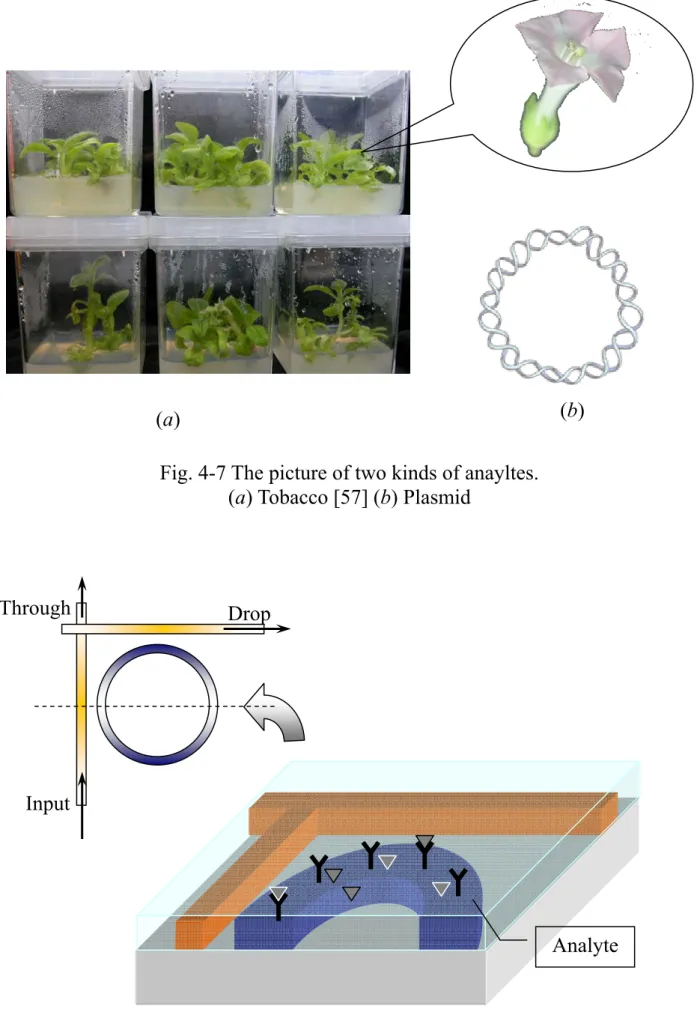
Plasmids are typically circular double-stranded DNA molecules separate from the chromosomal DNA (Fig. 4-7) and capable of autonomous replication [49]. They usually occur in bacteria, sometimes in eukaryotic organisms (e.g., the 2-micrometre-ring in Saccharomyces cerevisiae). Their size varies from 1 to over 400 kilobase pairs (kbp). There are anywhere from one copy, for large plasmids, to hundreds of copies of the same plasmid present in a single cell, or even to thousands of copies for certain artificial plasmids selected for high copy number [50] of plasmids.
We take two kinds of bio-molecular DNA to be the testing anaylte.
One kind is the plasmid, the other is tobacco which pictures are showed in Fig. 4-7.
4-5 Sensitivity of Microring Resonators
4-5-1 Classification of Sensitivity
From the previous two sections, there are two sensing mechanisms, the homogeneous sensing and the surface sensing, and two sensing schemes, the resonant wavelength shift monitoring and the intensity variation monitoring. We define the sensitivity as the ratio of the change in the measured optical parameter to the change in the waveguide parameter that is affected by the analytes. Accordingly, these mechanisms and schemes can lead to four different combinations. The microring sensitivity defined can be divided into two categories, device sensitivity, Sd, and waveguide sensitivity, Sw. The former depends on the optical characteristics of the microrings, while the latter is only related to the waveguide structure adopted. The device sensitivity is defined as the ratio of the change in the measured optical parameter to the effective index change of the guided mode. Based on this definition, it implies that the device sensitivity is determined by the sensing schemes [51]. With different schemes, the measured parameter is different: the resonant wavelength, ie in the resonant wavelength shift monitoring and the output intensity in the intensity variation monitoring. As for the waveguide sensitivity, it is defined as the ratio of the effective index change to the change in the
waveguide parameter modified by analytes. Thus, it is determined by the sensing mechanisms. With different mechanisms, the waveguide parameter is different: the bulk refractive index of the upper-cladding material λc, in the homogeneous sensing and the equivalent thickness of the attached film d in the surface sensing. The device sensitivity can be improved with optimal microring configuration, and the waveguide sensitivity could be enhanced with optimal waveguide geometry.
4-5-2 Device and waveguide Sensitivity
The device sensitivity is basically the change of the measured parameter with respect to the effective index change, ∆neff and is determined by the sensing schemes. For the resonant wavelength shift monitoring, the detected optical parameter is the resonant wavelength.
Therefore, the device sensitivity is defined as [52]:
( )
d RWS c c 2eff eff
S R
n n m
λ λ π
≡ ∂ = =
∂ (4-2) with the use of equation (4-1). From this definition, the detectable change of effective refractive index could be calculated as follows [53]:
eff
eff c c
c
n m
n L
δ δλ δλ
= λ = (4-3)
Clearly, the detectable index change is limited by the resolving power of spectra, δλc. Also, noise fluctuation can create some errors. According to this equation, higher detection capability can be achieved using a larger
resonant wavelength and a smaller effective refractive index. However, the effective index cannot be too small because it may compromise the optical confinement of the waveguide. The less-confined light has more loss and this broadens the resonant bandwidth. Ideally without any noise, the resonance shift can be detected whatever a Q-factor a microring has.
However, in reality, noise can interfere with the spectrum measurement.
Thus, a sharper resonance has better resolving power. From equation (4-3), it implies that, roughly speaking, δneff is inversely proportional to the
Q-factor [54] ( c c
c
Q λ λ
δλ δλ
= ∝ ) for a nearly constant n . Hence, there is a eff
trade-off on choosing the effective refractive index.
4-5-3 Waveguide Sensitivity S
wFor homogeneous sensing, the waveguide sensitivity is defined as
eff c
n n
∂
∂ .Using the basic waveguide theory and the effective-index method, the waveguide sensitivity can be calculated for both TE and TM polarizations, respectively, as [55]
( )
, 2 22 2
1 2 tan
2
1 tan sec
2 2 2
c x x
clad core
w h TE
eff clad c x x x
core x
k k W
n n
S n n k W k W k W
n k
γ γ
+
= ×
+ +
(4-4)
and
( )
1 2
, 1 tan sec
2 2 2
eff c x c x
w h TM
clad x
n k W W k W
S n k
γ γ −
= + + (4-5)
where W is the waveguide width.
4-6 Analysis of Waveguide Sensitivity
To gain more insight, our designed microring resonator is taken for example with Wcore = 4 µm (thickness of the waveguide core) and Wclad = 4.5µm (thickness of the under-cladding). This microring is assumed to detect analytes in water that has the refractive index of 1.33 near the wavelength of 1550 nm. With the 2-D waveguide approximation, the equivalent core index ncore, and the equivalent cladding index nclad can be calculated. For the designed ridge waveguide structure, ncore is equal to nclad in most cases.
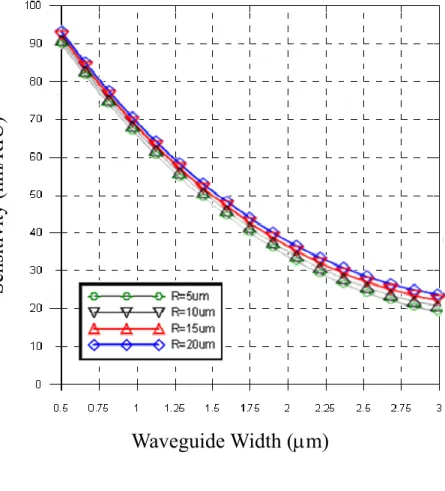
In the homogeneous sensing scheme [56], the waveguide sensitivity is calculated and plotted in Fig. 4-9 (a) and Fig. 4-9 (b) for the TE and TM fundamental mode respectively. In each figure, three curves are plotted with different waveguide width, W.
It is obvious that the waveguide sensitivity is higher for narrower waveguides in both TE and TM modes through the entire sensing range.
The narrower waveguide has less optical confinement and longer evanescent tail extending into the cladding region. The more extended wave possesses more overlapping with anayltes because analyte molecules are uniformly distributed in the solution in the homogeneous sensing. Thus, narrower waveguides could result in higher waveguide sensitivities.
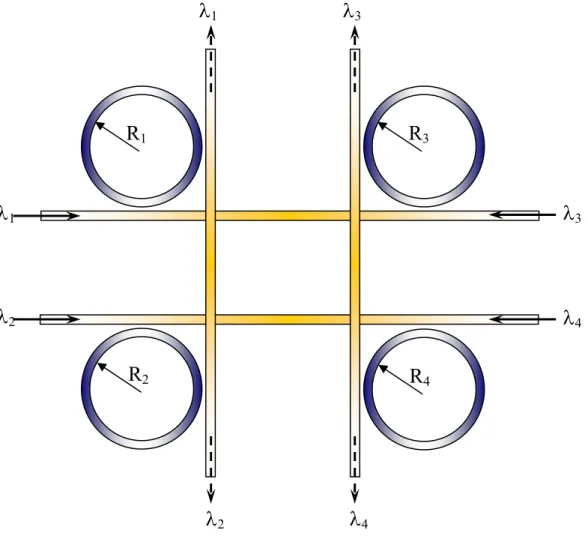
Fig. 4-10 shows the design idea of four kinds of biosensor array using laterally coupled microring resonator and Fig. 4-11 shows the structure of
four kinds of biosensor using different radius coupled microring resonator.
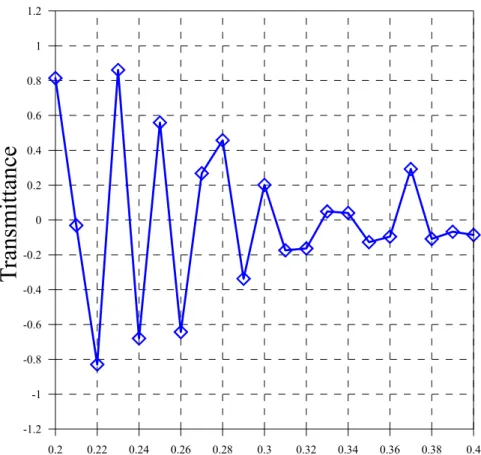
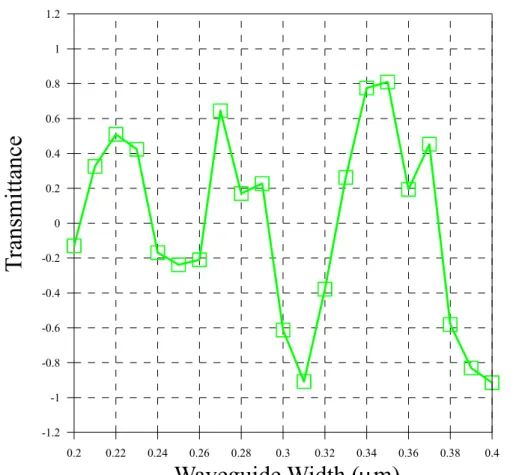
We can see with the suitable radius for four wavelengths, we can detect the four anayltes by the variation of intensity at the output port. The transmittance with different waveguide width of four different wavelengths at 1538.38nm, 1541.46nm, 1544.78nm and 1547.86nm are shown in Fig.
4-12 to Fig. 4-15. We can find the suitable waveguide width at these four different wavelengths.
4-7 Conclusions
Microring sensors can be used to detect biomolecules attached to the device surfaces (surface sensing) and those distributed in the solution surrounding the device (homogeneous sensing). In the demonstration of the homogeneous sensing, small molecules (glucose) can be detected by monitoring the resonant wavelength shift or the intensity variation.
Although we did not use microrings to detect larger biomolecules, we believe that microring sensors should function as well.
In the surface sensing, the experiment not only demonstrates surface sensing of bound biomolecules, but also shows that such SOI (Silicon-on-Insulator) microrings are capable of detecting both small molecules (such as biotin) and large biomolecules (such as proteins) without using fluorescent labels. If we can produce the microring resonator has a Q factor more than 10,000 and the resolvable wavelength shift is two tenth of the resonant bandwidth. This is a very promising value from this preliminary experiment in comparison with other planar optical biosensors.
This work shows that a microring resonator is an excellent candidate for
label-free biosensing. The device can have a higher sensitivity compared to other label-free detection methods, such as surface plasma resonance, quartz microbalance, and microcantilever sensors. Its simple device configuration lends itself to easy construction of multiple-channel sensor arrays which we shown in Fig. 4-3. The multiple-channel sensor can significantly improve the throughput of analyte detections as compared with other technologies. With a proper design of microfluidic channels to interface with the microring sensors, detection only requires very small sample volumes. With these capabilities, microring resonator sensors can potentially be used in many areas such as drug discovery, disease diagnostics, chemical analysis and environmental monitoring.
Fig. 4-1 The graphically represented Evanescent wave (
n
i >n
t ) Range of incident angles graterthan the critical angle θ
Incident Light Ei Reflected Light
n
in
tEt
Et Evanescent wave
Fig. 4-2 Three major approaches to optical excitation of SPW (a) Prism Coupling
(c) waveguide coupling
(b) Grating Coupling
Fig. 4-3 (a) Transmitted ports which has a spectrum of periodic-notch resonance.
(b) Drop port which has a complementary periodic peak resonance spectrum trans
in
I I
λ FSR
λ
drop in
I
I FSR
Fig. 4-4 Two sensing mechanisms.
(a) Homogeneous Sensing:
The analytes exist in the surrounding aqueous medium that serves as the top cladding.
(b) Suface Sensing:
The analyte molecules adsorb on a sensor surface modeled as an ultra-thin film.
(a) (b)
Claddin
Core Core
Cladding Cladding
Fig. 4-5 Two sensing schemes measuring (a) Resonant-wavelength shift (b) Intensity variation
I
λ
∆ λ
I
λ
∆ λ
∆I
tλ s
n clad n core n clad
W
y x
z
W
n clad n core n clad n clad
n d n d
d
d
Fig. 4-6 Two kinds of equivalent waveguide structures (a) Homeogeneous sensing
(b) Surface sensing
y x
z
Through Drop
Input
Fig. 4-8 Laterally coupled microring resonator and waveguides.
Analyte Fig. 4-7 The picture of two kinds of anayltes.
(a) Tobacco [57] (b) Plasmid
(a) (b)
Fig. 4-9 Sensitivity of homogeneous sensing plotted as a function of W and R (a) TE fundamental modes (b) TM fundamental modes
Waveguide Width (µm)
Sensitivity (nm/RIU)
Waveguide Width (µm)
Sensitivity (nm/RIU)
Fig. 4-11 Four kinds of biosensor array using laterally coupled microring resonator with four kinds of testing analyze
Fig. 4-10 Four kinds of biosensor array using laterally coupled microring resonator R1
R2
R3
R4
λ1
λ2
λ3
λ4
λ1 λ3
λ2 λ4
0.2 0.22 0.24 0.26 0.28 0.3 0.32 0.34 0.36 0.38 0.4 -1.2
-0.8 -0.4 0 0.4 0.8 1.2
-1 -0.6 -0.2 0.2 0.6 1
0.2 0.22 0.24 0.26 0.28 0.3 0.32 0.34 0.36 0.38 0.4
-1.2 -0.8 -0.4 0 0.4 0.8 1.2
-1 -0.6 -0.2 0.2 0.6 1
Waveguide Width (µm)
Waveguide Width (µm)
Fig. 4-12 Transmittance with different waveguide width at 1538.38nm
Fig. 4-13 Transmittance with different waveguide width at 1541.46nm
T ransmittance T ransmittance
0.2 0.22 0.24 0.26 0.28 0.3 0.32 0.34 0.36 0.38 0.4 -1.2
-0.8 -0.4 0 0.4 0.8 1.2
-1 -0.6 -0.2 0.2 0.6 1
0.2 0.22 0.24 0.26 0.28 0.3 0.32 0.34 0.36 0.38 0.4
0.4 0.5 0.6 0.7 0.8 0.9
0.45 0.55 0.65 0.75 0.85
Waveguide Width (µm)
Waveguide Width (µm)
Fig. 4-14 Transmittance with different waveguide width at 1544.78nm
Fig. 4-15 Transmittance with different waveguide width at 1547.86nm