VIII. Figures and Tables
1. Figure
Fig.1. The CIP derived EGFP (B. E.) in TG fish is the same as wild type (A. D.) in bright filed and green fluorescence filter under microscope at 28℃. After cold shock treatment, EGFP can be seen under microscope. (F.) (Chang TL, 2006)
A. B. C.
D E F WT, 28℃ Transgenic, 28℃ Transgenic, 16℃, 5 hrs
Fig.2. Effect of cold shock treatment on expression of zebrafish hsc70. Animals were transferred from 28℃to 24/20/16℃, exposed to this temperature for the time indicated on the bottom. Representative RT-PCR performances: The slight upregulation was observed in 24/20oC cold shock treatment. In 16oC cold shock treatment, a massive induction occurred after 5hrs treatment. (Chang TL, 2006)
N 1 2 3 4 5
N 1 2 3 4 5 HSC70
β-actin
HSC70 β-actin
20℃
16℃
N 1 2 3 4 5 HSC70
β-actin 24℃
28℃
HSC70 β-actin
N 1 2 3 4 5
Fig.3. The promoter and multiple cloning sequence of the pGEM®-T Easy Vectors. (A)The top strand of the sequence shown corresponds to the RNA synthesized by T7 RNA polymerase. The bottom strand corresponds to the RNA synthesized by SP6 RNA Polymerase;(B)pGEM®-T Easy Vector circle map and sequence reference points.
A B
Fig.4. Restriction Map and Multiple Cloning Site (MCS) of pEGFP-1. All restriction sites shown are unique. The Not I site follows the EGFP stop codon. The Xba I site (*) is methylated in the DNA provided by BD Biosciences. If you wish to digest the vector with this enzyme, you will need to transform the vector into a dam– host and make fresh DNA.
Fig.5. Restriction Map and Multiple Cloning Site (MCS) of pEGFP-C1. All restriction sites shown are unique. The Xba I and Bcl I sites (*) are methylated in the DNA provided by BD Biosciences Clontech. If you wish to digest the vector with these enzymes, you will need to transform the vector into a dam– host and make fresh DNA.
Fig.6. The PCR amplification and plasmid digested performances. (A) The PCR amplification of three promoters. Lane 1:
CMV promoter, Lane 2: CIP promoter, and Lane 3: M3CK promoter; (B) The pGEMT vector digested by NotI. Lane 1: CIP promoter, Lane 2: M3CK promoter, Lane 3: carp CKM1, and Lane 4: carp CKM3.
3000bp 2000bp
1000bp
M 1 2 3 A
3000bp 2000bp
1000bp
M 1 2 3 4 B
Fig.7.The demonstration of the pM3CKPro and pM3CKPro-EGFP reporter vector. We sequenced pM3CKPro by T7/Sp6 primer and pM3CKPro-EGFP by MP1321.
Amp
pGEM-T
LacZ f1 ori
Amp
LacZ f1 ori Enz. Digestion
T4 Ligation
Enz. Digestion T4 Ligation
MCKpro
pUC ori
Kan/Neo
pM3CKPro-EGFP MCKpro
f1 ori SV40
ori
EGFP
SV40 poly A HSV TK
poly A pUC ori
Kan/Neo
pEGFP-1
f1 ori SV40 ori
EGFP
SV40 poly A HSV TK
poly A Enz. Digestion T4 Ligation pM3CKPro
Fig.8. There have muscle specific transcription factors binding domains such as MEF, MEF2, E-box and Muscle TATA box, and a cold inducible transcription factor binding domain, C/EBPβ on the M3-CK promoter region.
Fig.9. The M3CK promoter derived EGFP in bright field (A), Green fluorescence filter (B), GFP can be seen at muscle fiber in enlarge the picture (C1, C2, C3), and the RT-PCR result of different tissues (D).
A
B
M: 1kb Maker E: Eye B: Brain Mu: Muscle H: Heart L: Liver S: Skin I: Intestine Sb: Swim bladder O: Ovary D
C1
C2
C3
Fig.10. The demonstration of the pEGFP-C1 and pEGFP-C1-P-MCK reporter vector. We constructed a dual functional expression vector that constitutively expressed the transgene and a GFP marker gene. The CMV promoter drove the GFP marker and the CMV promoter, cold-inducible promoter and carp M3-CK promoter drove the carp MCK transgene, respectively.
Enz. Digestion T4 Ligation pUC ori
Kan/Neo
pEGFP-C1
f1 ori SV40 ori
EGFP
SV40 poly A
MCS CMV
HSV TK poly A
pUC ori
Kan/Neo
f1 ori SV40
ori EGFP
SV40 poly A HSV TK
poly A
CMV
CKM1 CKM3 CMV CIP MP
pEGFP-C1-P-MCK
STOP codon
Fig.11. The pEGFP-C1-P digested results and differentiated varieties of vectors by Table. 6.
M A1 B1 B2 E1 E2 H1 H2
Fig.12. The pEGFP-C1-P-MCK digested results and differentiated varieties of vectors by Table. 6.
(A) pEGFP-C1-CMV-M1CK digested results. (D) pEGFP-C1-CMV-M3CK digested results.
(B) pEGFP-C1-CIP-M1CK digested results. (E) pEGFP-C1-CIP-M3CK digested results.
(C) pEGFP-C1-M3CKpro-M1CK digested results. (F) pEGFP-C1-M3CKpro-M3CK digested results.
M B1 C3 C4 C5 C6 M E1 F3 F4 F5 F6 M H1 I3 I4 I5 I6
M B1 D3 D4 D5 D6 M E1 G3 G4 G5 G6 M H1 J3 J4 J5 J6
A B C
D E F
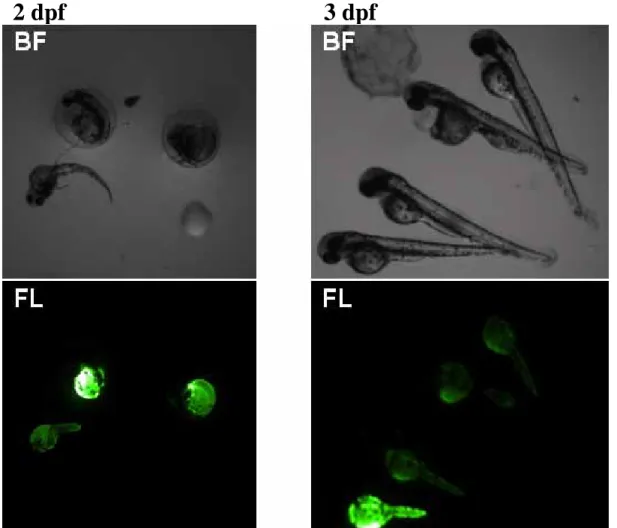
Fig. 13. Screening of transgenic zebrafish embryo by EGFP fluorescence. Green fluorescence could be detected in transgenic zebrafish embryo, not in wild type.
2 dpf 3 dpf
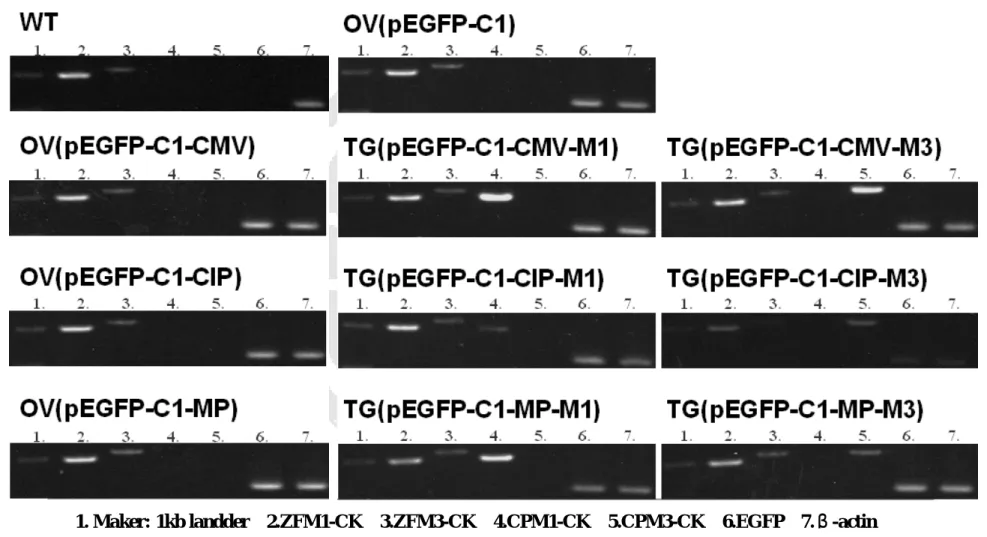
Fig. 14. RT-PCR performance of wild type, and only vector control and transgenic zebrafish.
1. Maker: 1kb landder 2.ZFM1-CK 3.ZFM3-CK 4.CPM1-CK 5.CPM3-CK 6.EGFP 7.β-actin
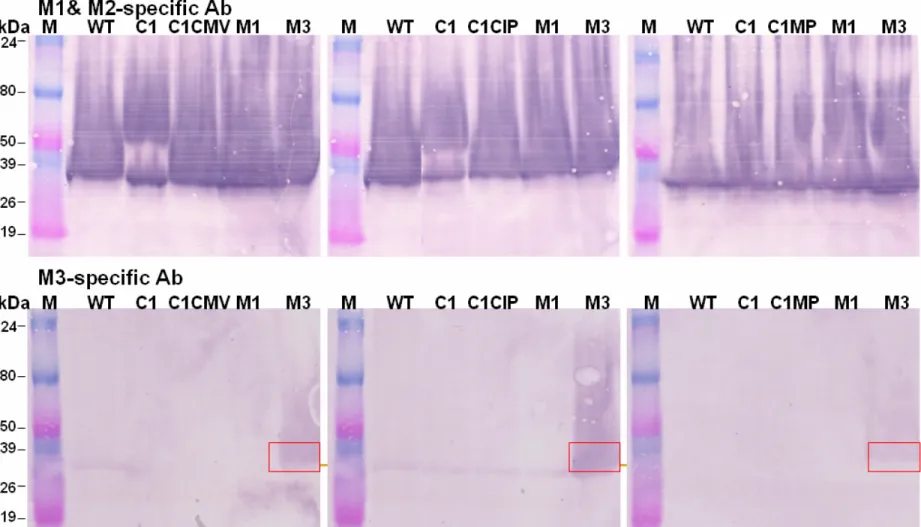
Fig. 15. Western blotting of wild type, only vector control and transgenic zebrafish. The blots were incubated with the carp CK-M1+M2 antibody and the carp CK-M3 antibody, respectively.
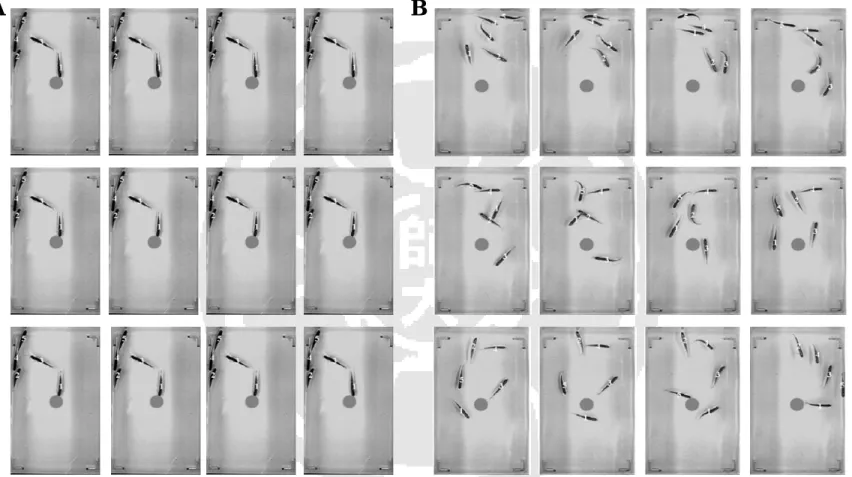
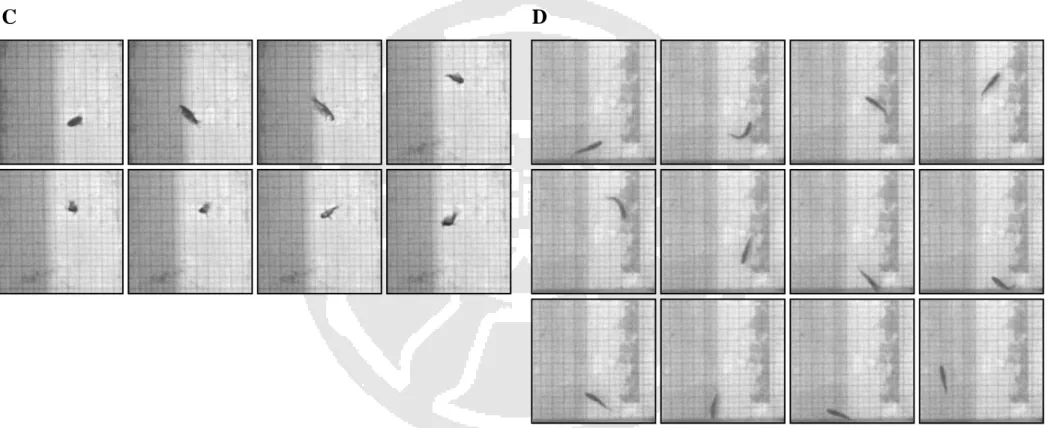
Fig. 16. Images of wild type and transgenic zebrafish kept at intolerable water temperature. These pictures, showing different swimming performance between (A) wild type and (B) transgenic fish, were serially taken every second after they were transferred to 13℃ water. Each zebrafish was numbered to facilitate the monitor of their swimming distance.
A B
A B
Fig. 17. Comparison of swimming behavior between wild type and transgenic zebrafish at an acute low temperature.
(A, B, C). The wild type zebrafish could not swim normally and became imbalance (A), inversion (B) and died (C).
(D). The transgenic zebrafish was swimming normally in low temperature, including turn, and reverse.
C D
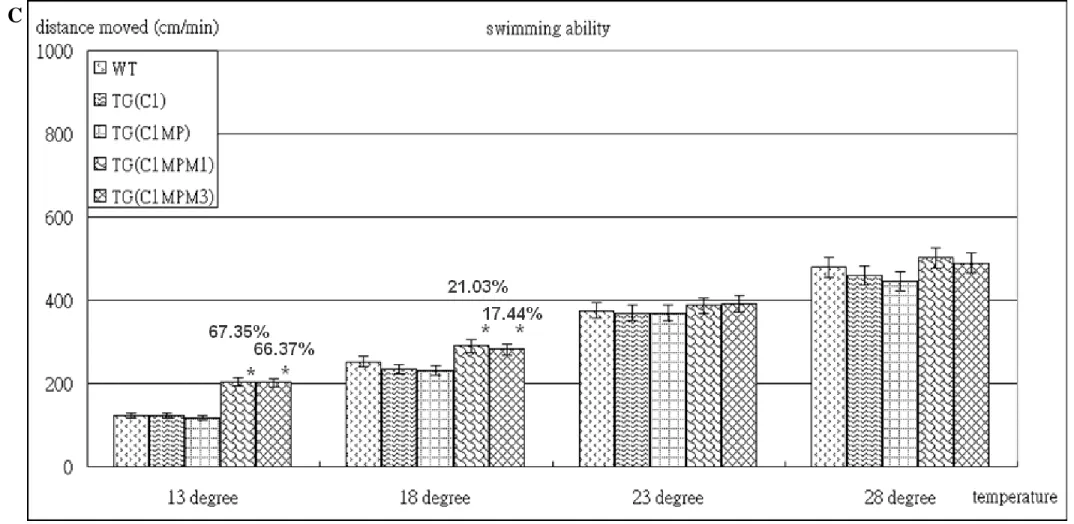
* means ANOVA test have significant effect, p<0.05 A
N/A: The Mortality of C1CMVM1 transgenic zebrafish is more than 99%, and we can’t get any data of its swimming ability.
* means ANOVA test have significant effect, p<0.05 B
Fig. 18. Swimming ability of three kinds of promoters derived carp M-CK transgenic zebrafish and wild-type zebrafish.
CMV promoter (A); Cold-inducible promoter (B); and M3CK promoter(C).
* means ANOVA test have significant effect, p<0.05 C
2. Table
Table 1. The primer sequences, annealing temperature and PCR product size used to run PCR for analysis promoter.
Promoter Primer Sequence Tm (℃)
CMV CMV S: CTCGAGTAGATAACTGATAGTTATTAATAGTAATCAATTACGGGGTC 53.2(65.4) AS: GAATTCGCGCTAGCGGATCTGACG 54.3(64.6) CIP CIP S: CTCGAGTAGATAACTGAGGCTCCGGAAAAGCGGTTG 59.1(72.3) AS: GAATTCCTCTGGACTCCTGTGTGTTTATAGCGC 60.4(66.8) M3CKpro M3CKpro S: CTCGAGTAGATAACTGATTCGATTATTACTCCAGTCTTCAGT 50.5(65.8)
AS: GGCCGCGAATTCACTAGTGATTGTCTTCAG 66.9
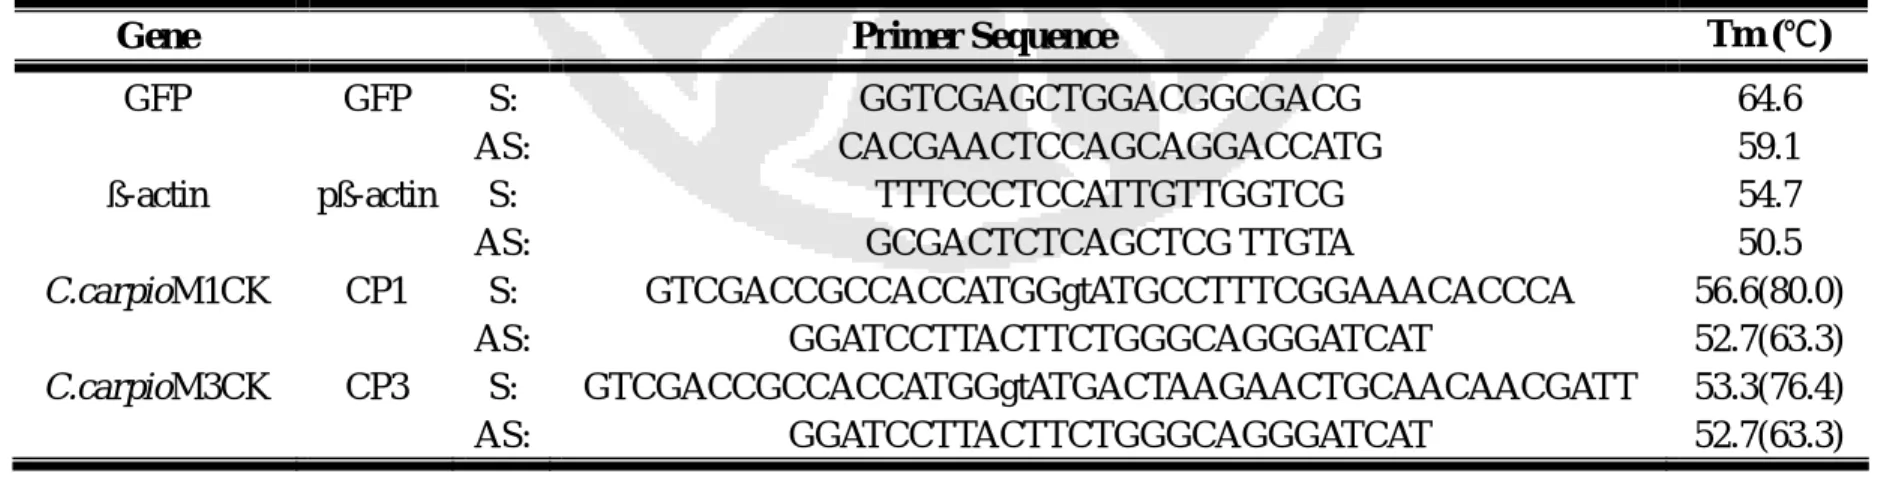
Table 2. The primer sequences, annealing temperature and PCR product size used to run PCR for analysis five genes.
Gene Primer Sequence Tm (℃)
GFP GFP S: GGTCGAGCTGGACGGCGACG 64.6
AS: CACGAACTCCAGCAGGACCATG 59.1
ß-actin pß-actin S: TTTCCCTCCATTGTTGGTCG 54.7
AS: GCGACTCTCAGCTCG TTGTA 50.5
C.carpioM1CK CP1 S: GTCGACCGCCACCATGGgtATGCCTTTCGGAAACACCCA 56.6(80.0) AS: GGATCCTTACTTCTGGGCAGGGATCAT 52.7(63.3) C.carpioM3CK CP3 S: GTCGACCGCCACCATGGgtATGACTAAGAACTGCAACAACGATT 53.3(76.4) AS: GGATCCTTACTTCTGGGCAGGGATCAT 52.7(63.3)
Table 3. The primer sequences and annealing temperature used to run PCR for sequencing the plasmid construction.
Name Primer Sequence Tm (℃)
T7 TAATACGACTCACTATAGGG 38.8
Sp6 ATTTAGGTGACACTATAGAAT 37.0
EGFP-C1287 CATGGTCCTGCTGGAGTTCGTGAC 61.5
CIP1605 CGTCTTCTGTTACTCTAGCCTGGC 55.6
MP1321 CAGGGCACAATTTCAAGCTTCCTTCT 61.7 BamHI-MCK GGATCCTTACTTCTGGGCAGGGATCAT 63.3
Table 4. The primer sequences, annealing temperature and PCR product size used to run PCR for the detection of foreign Carp CK gene and original zebrafish CK gene
Gene Primer Sequence Tm (℃)
D.rerioM1CK ZF1D S: CCACCTGGATTCACTGTGGATGATGTCATC 66.7 AS: TTACTTCTGGGCAGGGATCATGCTGTCGAT 68.4 D.rerioM3CK ZF3D S: AAGATGAAGTTTGCTGTGGATGAGGAGTTT 62.4
AS: TTACTTCTGGGCAGGGATCATGTCATCGAT 66.7 C.carpioM1CK CP1D S: TCCACTGGATTCACCCTGGACGATGCCATC 72.5
AS: TTACTTCTGGGCAGGGATCATGCTGTCGAT 68.4 C.carpioM3CK CP3D S: AAGCTGAAGTTCTCTCTGGAGGAGGAGTAC 61.1
AS: TTACTTCTGGGCAGGGATCATGTCATCGAT 66.7
Table 5. The sequencing result of pGEMT-MP plasmid, and it is the sequence of the promoter region from M3-CK.
Table 6. Using different R.E. cut the vector and differentiated varieties of vectors by different fragments.
Using different R.E. to cut vector and get different fragments ( bp ) 2.promoter 3.full length 4.promoter 5.MCK 6.MCK No. 1.Finished vector size ( bp )
XhoI/EcoRI XhoI/BamHI XhoI/SalI SalI/BamHI PstI
A. pEGFP-C1 4731 ND ND ND ND ND
B. pEGFP-C1-CMV 5329 598 ND ND ND ND
C. pEGFP-C1-CMV-M1 6470 ND 1793 631 1162 1044
D. pEGFP-C1-CMV-M3 6467 ND 1790 631 1159 852
E. pEGFP-C1-CIP 6497 1766 ND ND ND ND
F. pEGFP-C1-CIP-M1 7638 ND 2961 1799 1162 1044,1194
G. pEGFP-C1-CIP-M3 7635 ND 2958 1799 1159 852,1194
H. pEGFP-C1-MP 6372 1641 ND ND ND ND
I. pEGFP-C1-MP-M1 7513 ND 2836 1674 1162 1044,521
J. pEGFP-C1-MP-M3 7510 ND 2833 1674 1159 852,521
ND: Not digested.
Table 7. Comparison of swimming performance between wild type and transgenic zebrafish at different temperatures.
Swimming velocity (cm/min) of different temperature Fish
28℃ 23℃ 18℃ 13℃
WT 479.4 ± 45.9 374.6 ± 50.5 252.7 ± 24.2 123.2 ± 21.6 pEGFP-C1 459.0 ± 43.0 369.2 ± 42.5 234.7 ± 18.1 123.7 ± 17.6 pEGFP-C1-CMV 475.1 ± 35.4 359.5 ± 24.0 246.0 ± 21.6 117.2 ± 12.5
pEGFP-C1-CMV-M1 N/A N/A N/A N/A
pEGFP-C1-CMV-M3 929.1 ± 49.4 * 651.2 ± 72.8 * 430.0 ± 58.0 * 252.6 ± 12.7 * pEGFP-C1-CIP 457.3 ± 43.1 372.6 ± 29.1 218.6 ± 13.3 123.1 ± 7.9 pEGFP-C1-CIP-M1 458.3 ± 72.2 367.3 ± 42.8 227.7 ± 18.9 125.4 ± 15.8 pEGFP-C1-CIP-M3 465.0 ± 51.5 365.8 ± 16.3 217.6 ± 10.8 176.0 ± 11.6 * pEGFP-C1-M3CKP 445.6 ± 34.7 369.1 ± 16.1 231.7 ± 11.5 117.8 ± 9.4 pEGFP-C1-M3CKP-M1 501.5 ± 19.5 387.5 ± 25.6 290.1 ± 13.3* 203.5 ± 10.8 * TG
pEGFP-C1-M3CKP-M3 489.7 ± 15.4 392.0 ± 21.3 281.5 ± 20.5 202.3 ± 16.2 *
* means t value significant, P<0.05
N/A: The Mortality of C1CMVM1 transgenic zebrafish is more than 99%, and we can’t get any data of its swimming ability.