國立臺灣大學電機資訊學院電機工程學系 碩士論文
Department of Electrical Engineering
College of Electrical Engineering and Computer Science National Taiwan University
Master Thesis
結合音高、音量、音色特徵的多樂句歌唱情感表現力評分系統
A Singing Enthusiasm Evaluation System for Multiple Phrases Using Pitch, Loudness, and Timbre Features
陳珮珮 Pei-Pei Chen
指導教授:鄭士康 博士,張智星 博士 Advisors: Shyh-Kang Jeng, Jyh-Shing Roger Jang
民國 106 年 1 月
January 2017
口試委員審定書
致謝
本論文從題目發想至寫作完成的兩年間,受到許多師長、朋友的指教、協助,
僅以此文敬表感謝之意。
感謝鄭士康老師的指導,每次 meeting 時都覺得老師比我還認真,半小時的
meeting 學習到的常常比我閱讀幾天文獻學習到的還多。感謝張智星老師自我大 學三年級以來的指導,帶我發現研究的樂趣,大專生計畫、ICME 論文、碩士論 文都承蒙張老師指導才能順利完成。Thank to Prof. Nobutaka Ono for giving me
much precious advice and encouraging me to submit papers to conferences.
感謝口試委員王新民老師提供許多寶貴意見令我獲益良多。
在資料庫蒐集上也多虧許多朋友協助才得以完成:感謝錄製音檔的鄭哲宇、
黃美媛、顏琬庭、徐子函、陳俊瑋、王冠博、黃揚傑、康秩群、陳秀昌;感謝協 助分享問卷連結的陳怡庭、楊智涵、孫聖昕、陳秀昌、康秩群、廖婉君、Erica Li;
感謝媽媽製作鳳梨酥作為錄音謝禮;感謝鄭乃勻提供阿虎照片;感謝撥冗填寫問 卷的朋友們。
感謝 MIRLAB、JCMG 的學長姐、同學、學弟妹,在研究上給我許多寶貴的 意見,多次協助我突破研究的瓶頸。
最後,謹向我身旁的家人、好友們致謝,您們時時的陪伴與鼓勵,使我兩年 半的碩士研究生生活快樂而充實。
摘要
本研究提出一自動歌唱情感表現力評分系統,歌唱情感表現力在此定義為聽 者感受到的歌者投入程度。本系統依據音準、抖音、尾音漸弱、音色粗糙程度、
音量與音高的相對關係等五項特徵進行評分,再以支持向量回歸(support vector
regression)進行得分估計,本系統可在不具任何已知資料(如:原曲音高、斷 句位置)的情況下對任意樂句數的歌曲進行評分。網上所搜尋到的唯一最相似文 獻,則僅能處理單一五秒左右長度的樂句。在本研究中,為評估系統準確度,蒐 集建構了一個由九位參與者演唱,包含 342 段清唱音檔的歌唱資料庫,並以線上 問卷取得聽者對於資料庫內音檔的評分。實驗結果顯示(leave-one-singer-out test),
由本系統給出的評分與線上問卷取得的人類評分具有 0.51 的夠顯著正相關係 數。
關鍵字:音樂訊號分析、歌唱情感表現力、歌唱評分、歌聲分析、支持向量回歸
Abstract
A system for automatically evaluating singing enthusiasm is proposed in this study. The definition of singing enthusiasm is how much enthusiasm is perceived in a song being evaluated. This system evaluates the singing enthusiasm on the basis of pitch accuracy, vibrato, diminuendo, roughness, and the correlation between pitch and loudness. A support vector regression (SVR) machine is used for the evaluation. This
system can deal with songs having multiple phrases without any reference information such as the pitch ground truth or phrase location. To the authors’
knowledge, only one such system has previously been proposed which could only handle a single phrase of about 5-second long. To evaluate this system, a singing corpus with 342 song clips sung by nine participants was recorded and ground-truth enthusiasm evaluation scores were obtained by an online questionnaire. The experimental results obtained from a leave-one-singer-out test revealed that the enthusiasm scores evaluated by the proposed system had a significant positive correlation coefficient of 0.51 with the human-labeled ground truth.
Keywords: Music signal analysis, singing enthusiasm, singing evaluation, singing voice analysis, support vector regression
Content
口試委員審定書 ... i
致謝... ii
摘要... iii
Abstract ... iv
Content ... v
List of Figures ... vii
List of Tables ... viii
1 Introduction ... 1
1.1 Motivation ... 1
1.2 Objective: Singing Enthusiasm Evaluation ... 1
1.3 Contributions... 2
1.4 Chapter Outline ... 2
2 Related Works of Singing Evaluation ... 3
3 Singing Corpus ... 5
3.1 Selection of Songs... 5
3.2 Recording ... 6
4 Subject Enthusiasm Evaluation ... 8
4.1 Questionnaire Design ... 8
4.2 Source of Subjects... 9
4.3 Rewards... 9
4.4 Results ... 9
4.4.1 Information of Subjects... 9
4.4.2 Evaluation Results ... 11
5 Singing Enthusiasm Evaluation System ... 14
5.1 System Overview ... 14
5.2 End-point Detection ... 14
5.3 Feature Selection ... 16
5.4 Low Level Features Extraction ... 17
5.4.1 Pitch ... 17
5.4.2 Loudness ... 19
5.4.3 Roughness ... 20
5.5 Features Used for Singing Enthusiasm Evaluation ... 21
5.5.1 Pitch Accuracy ... 21
5.5.2 Vibrato ... 22
5.5.3 Diminuendo at the End of Segments ... 24
5.5.4 Correlation between Loudness and Pitch ... 24
5.5.5 Average Roughness ... 25
5.6 Classifier: Support Vector Regression Machine ... 26
6 System Evaluation Experiment ... 28
7 Results and Discussion ... 29
7.1 System Evaluation Results ... 29
7.2 Comparison between Singer-intended, Human-labeled, and System-evaluated Enthusiasm ... 30
7.3 Emotion Expression in Different Song Types ... 32
8 Conclusions ... 35
Reference ... 36
Appendix ... 41
List of Figures
Figure 3.1 Valence-Arousal Plane ... 6
Figure 3.2 A screenshot of karaoke video ... 7
Figure 4.1 Gender of subjects ... 10
Figure 4.2 Age distribution of subjects ... 10
Figure 4.3 Subjects’ frequency of listening to Chinese pop music... 11
Figure 4.4 Subjects’ musical training experience ... 11
Figure 4.5 Human-labeled scores distribution of 342 song clips... 12
Figure 4.6 Human-labeled scores distribution of song clips with enthusiasm and without enthusiasm... 13
Figure 5.1 System Overview... 14
Figure 5.2 End-point Detection ... 15
Figure 5.3 An example of vibrato ... 23
Figure 7.1 System Evaluation Results ... 29
List of Tables
Table 3.1 Song list ... 6
Table 7.1 Average human-labeled scores and system-evaluated scores of all singers ... 32
Table 7.2 Correlation coefficients between human-labeled scores and the five features for the four song types ... 34
1 Introduction
1.1 Motivation
Many karaoke machines or singing applications are nowadays equipped with singing evaluation systems. Most of the systems evaluate singing on the basis of how
precisely the pitch and the rhythm are followed and how well singing skills are applied by the singer. However, for amateur singers, singing is mainly for self-expression [1] and entertainment; thus, the enthusiasm a singer expresses when singing a song is also an important aspect to evaluate. In the evaluation of singing enthusiasm, a singer singing more passionately should obtain a higher score even if he/she lacks singing skills. In contrast, a singer singing without enthusiasm ought to obtain a low score, even if he/she sings with perfect pitch accuracy and tempo. Such an evaluation system may be better for amateur singers, since the system can encourage people to experience the pleasure of singing rather than focus on singing skills, the correctness of the pitch and rhythm of each note, or the similarity of their voice to that of the original singers.
1.2 Objective: Singing Enthusiasm Evaluation
The objective of this work is to propose a system for evaluating singing enthusiasm without reference information such as the original pitch or phrase location.
Singing enthusiasm is defined as how much enthusiasm is perceived in a song being evaluated. This system shall play the role of a judge for singing enthusiasm.
1.3 Contributions
A method which can evaluate singing enthusiasm for song clips of any length without reference information is proposed. Only one paper on singing enthusiasm evaluation [2], by Daido and colleagues in 2014, was found over the internet. The previous study focused on the evaluation for song clips with only one phrase (about 5 seconds). Compared with the system proposed in [2], our system is more practical in dealing with multiple phrases without location information of phrases.
1.4 Chapter Outline
Chapter 1 briefly describes the motivation, contributions, and the objective.
Chapter 2 provides some reviews to related works of singing evaluation. Chapter 3 describes songs in the proposed singing corpus and how they were recorded. Chapter 4 describes how the human-labeled evaluation scores were collected from an online questionnaire. Chapter 5 introduces the proposed system in detail. Chapter 6 provides the system evaluation experiment with the dataset mentioned in Chapter 3. Chapter 7 shows the experimental results and discuss some observed errors. At last, Chapter 8 concludes with a brief summary.
2 Related Works of Singing Evaluation
Although only one literature on singing enthusiasm evaluation [2] was found over the internet, there are many previous research and patents on automatic singing voice evaluation from different aspects.
Most researches and patents evaluated singing based on singing skills and the similarity between the evaluated song and the reference song sung by the original performer. Reference [2] proposed a singing evaluation system for karaoke based on volume and rhythm similarity between the microphone’s input signal and the reference song signal. Reference [3] calculated the spectrum difference between the input song and the reference song as the evaluation score. References [4], [5], and [6]
scored the singing voice by comparing its volume, pitch, and rhythm with the reference song. References [7] and [8] evaluated singing skill with vibrato extent and pitch accuracy. In references [10] and [11], singing power ratio (SPR), which quantifies the formant of singing voice, was calculated to score the singing timbre.
References [9] and [10] are, to the author’s knowledge, the only two research literatures dealing with the emotion expression of singing. Reference [10] proposed a singing tutor system which provides the emotion expression suggestions for songs with midi score. Several expression labels, such as pitch fall-down, scoop-fry, and
vibrato, were identified. Hidden Markov model (HMM) was trained with midi score to obtain the best expression path. (For example, scoop-up – vibrato – fall-down.) Such an emotion-expression-label identification achieved high accuracy rates.
However, the correctness of expression path was not evaluated. The system proposed by reference [12] suggested the best emotion expression path, but didn’t evaluate the input singing signal with the path.
The objective of reference [9] is singing enthusiasm evaluation, which is the same as this work. A-weighted power, vibrato extent, and pitch fall-down at the end of each phrase were considered features. The correlation coefficient between human-labeled scores and system-evaluated scores was 0.65. However, A-weighted power, which was derived from volume, may be different because of differences in recording environment and microphone settings even if singing with the same volume.
This may make the system inaccurate when applied to environments other than the dataset recording environment. In addition, reference [9] only evaluated song clips with 1 phrase which was about 5 seconds. To evaluate the performance of the whole song, the phrases location, which karaoke systems are not always equipped, is necessary. Different from [2], the singing enthusiasm evaluation system proposed in this work is able to evaluate song clips with multiple phrases and without any metadata.
3 Singing Corpus
3.1 Selection of Songs
In the singing corpus we constructed to train a computer to score singing, eight Mandarin pop songs were selected. All of the selected songs are popular, so that most of the 9 singers, who recorded this corpus, had heard all songs before recording.
(Only 2 of the singers had never heard one of the 8 songs before recording.)
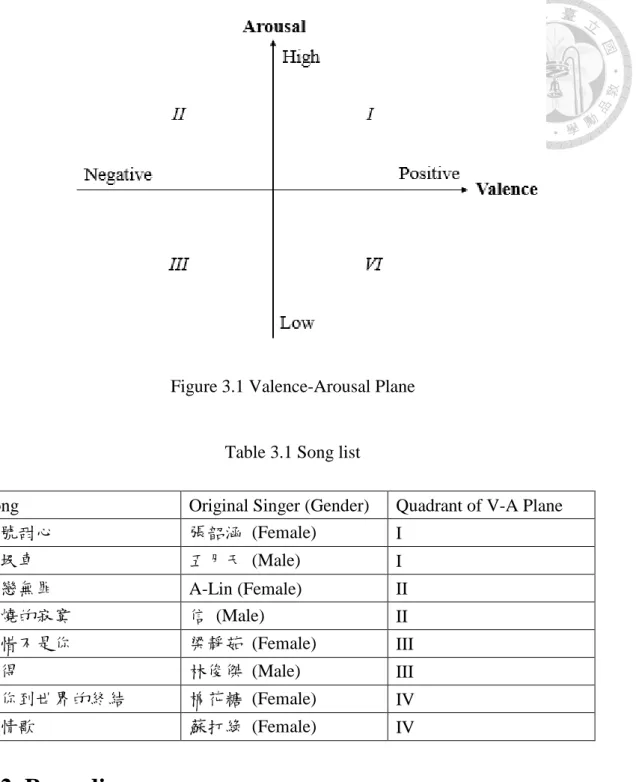
Since the method of expressing an emotion may depend on the emotions, this corpus may have bias if it does not cover various emotions. As a consequence, the eight songs covered four different emotions with two songs representing each emotion, one having a female original singer and the other having a male original singer. The four emotions lie in the four quadrants of the valence-arousal plane (V-A Plane) proposed by R. E. Thayer in 1989 [11]. Figure 3.1 shows the V-A Plane. The song list is shown in Table 3.1.
Figure 3.1 Valence-Arousal Plane
Table 3.1 Song list
Song Original Singer (Gender) Quadrant of V-A Plane
頭號甜心 張韶涵 (Female) I
垃圾車 五月天 (Male) I
失戀無罪 A-Lin (Female) II
火燒的寂寞 信 (Male) II
可惜不是你 梁靜茹 (Female) III
記得 林俊傑 (Male) III
陪你到世界的終結 棉花糖 (Female) IV
小情歌 蘇打綠 (Female) IV
3.2 Recording
The singing corpus was recorded by nine participants comprising five males and four females. All participants recorded the songs by themselves, which resulted in different recording environments and noise that made singing analysis more difficult, but this is close to the actual situation in karaoke or mobile singing applications.
Instructions for recording (See Appendix) and karaoke video files of the eight songs (See Figure 3.2) were provided to all participants. While recording, participants wore earphones so that the songs were recorded without background music. Participants were asked to record the first verse and chorus, which had a total duration of about 60-90 seconds, of every song for twice. To ensure the existence of songs sung with enthusiasm and without enthusiasm in the singing corpus, the participants sang with enthusiasm in the first recording and without enthusiasm in the second recording. The recorded songs were divided into 2-4 smaller song clips with a duration of about 20-30 seconds. The eight songs were divided into 19 clips in total. As a consequence, there were 342 song clips in the singing corpus. (19 clips × 2 recordings × 9 people)
Figure 3.2 A screenshot of karaoke video
4 Subject Enthusiasm Evaluation
4.1 Questionnaire Design
To evaluate the enthusiasm of the singing in the song clips in the singing corpus, an online questionnaire survey was conducted. In the questionnaire, subjects were asked to listen to song clips and give them a score from 0 to 10 points. Twenty song clips were randomly selected from all of the 342 song clips in each questionnaire. As mentioned in the previous chapter, each song clip was about 20 to 30 seconds.
Therefore, it took about 10 minutes to complete a questionnaire.
All the song clips were normalized to the same average loudness because differences in loudness between song clips may influence the perception of enthusiasm. The differences in loudness may have been caused by recording environment, such as the microphone settings, that are unrelated to the enthusiasm of the singers.
After scoring the 20 picked song clips, subjects were asked to leave some personal information, including gender, age, frequency of listening to Manderin pop songs, number of years of music training received, and feedback (optional).
To prevent outliers, three restrictions were implemented on the questionnaire website using JavaScript. First, participants could not submit scores without playing
all the song clips. Secondly, one song clip could not be played while another song clip was playing. Lastly, there was no pause button on the website so participants had to listen to the whole song clip when they played it.
4.2 Source of Subjects
This questionnaire was posted to several Facebook groups and PTT boards. The Facebook groups included “NTU 台大學生交流板” and “尋云溫馨閒聊老人小孩交 流天地.” The PTT boards included “NTU”, “Q_ary”, and “Vocal.”
4.3 Rewards
Subjects could obtain 100 PTT coins as a reward if they left their PTT ID in the questionnaire. Subjects could also attend the LINE stickers’ lottery once they left their email addresses in the questionnaire. Ten percent of all Subjects could obtain a 50 points LINE sticker which was about 30 New Taiwanese Dollars (NTD).
4.4 Results
4.4.1 Information of Subjects
One hundred and eighty-nine valid responses to the questionnaire were received.
The histogram of subject information are shown in Figures4.1 to 4.4. There are 95 female and 94 male subjects. Most subjects are between 16 and 25 years old. About
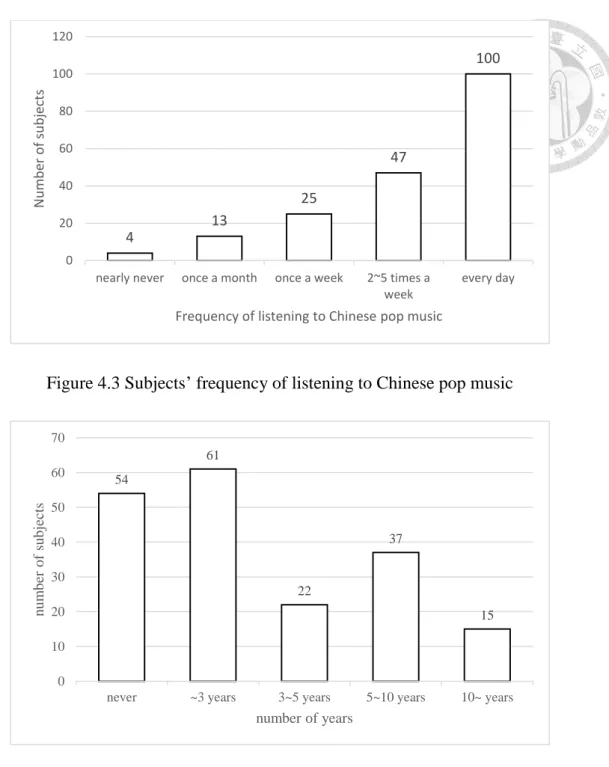
50 percent of them listen to Chinese pop music every day and only 17 subjects seldom listen to Chinese pop music. Near 75 percent of participants had received music training, and about 50 percent of them had received music training for more than 5 years.
Figure 4.1 Gender of subjects
Figure 4.2 Age distribution of subjects Male
94 50%
Female 95 50%
1
150
35
0 3
0 20 40 60 80 100 120 140 160
~15 16~25 26~35 36~45 46~
Number of subjects
Age of participants
Figure 4.3 Subjects’ frequency of listening to Chinese pop music
Figure 4.4 Subjects’ musical training experience
4.4.2 Evaluation Results
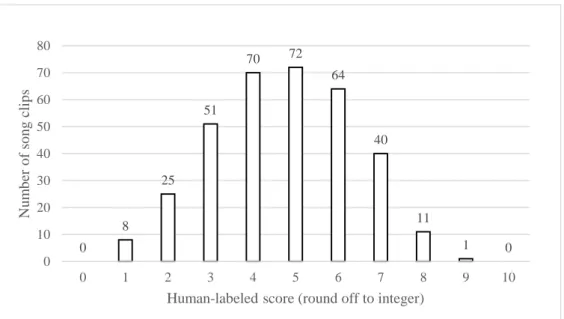
There are at least 11 scores for each song clips from one hundred and eighty-nine valid questionnaires. The final evaluation score of a song clip is the average score of all of the scores it obtained. The score distribution of 342 song clips are shown in
4
13
25
47
100
0 20 40 60 80 100 120
nearly never once a month once a week 2~5 times a week
every day
Number of subjects
Frequency of listening to Chinese pop music
54
61
22
37
15
0 10 20 30 40 50 60 70
never ~3 years 3~5 years 5~10 years 10~ years
number of subjects
number of years
Figure 4.5. The score distribution of song clips with enthusiasm and without enthusiasm are shown in Figure 4.6. The average score of all the song clips is 4.71 points. The average intra-subject variability is 2.08, while the definition of intra-subject variability of a song clip is the average difference between every 2 scores. The average score of the song clips sung with enthusiasm is 5.57 while that of the song clips sung without enthusiasm is 3.85. For each singer, the average human-labeled score of the song clips with enthusiasm is higher than that of the song clips without enthusiasm. This indicates that the intentional enthusiasm of all the singers was perceived by the listeners.
Figure 4.5 Human-labeled scores distribution of 342 song clips
0 8
25 51
70 72
64
40
11
1 0
0 10 20 30 40 50 60 70 80
0 1 2 3 4 5 6 7 8 9 10
Number of song clips
Human-labeled score (round off to integer)
Figure 4.6 Human-labeled scores distribution of song clips with enthusiasm and without enthusiasm
0 10 20 30 40 50 60
0 1 2 3 4 5 6 7 8 9 10
Number of song clips
Human-labeled score (round off to integer) Enthusiasm Without enthusiasm
5 Singing Enthusiasm Evaluation System
5.1 System Overview
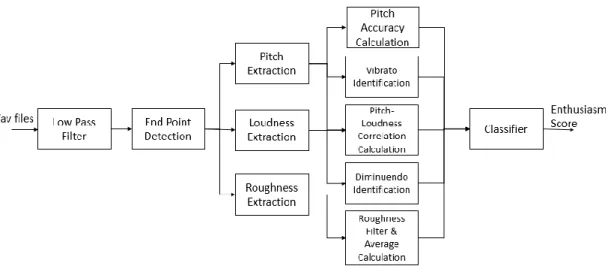
An overview of our system for evaluating singing enthusiasm is shown in Figure 5.1. To avoid interference due to noise, a low-pass filter with cutoff frequency of 3000 Hz is first applied. The end-point detection is applied to divide song clips into several segments and to delete silent parts. The feature extraction process is divided into two parts, low-level-feature extraction (Section 5.4) and computation of the five-dimensional final feature from low-level features (Section 5.5). Finally, a support vector regression (SVR) machine is applied to obtain the enthusiasm score.
Figure 5.1 System Overview
5.2 End-point Detection
The parts of a song without singing such as the prelude and interlude are unrelated to singing enthusiasm and may interfere with the evaluation result because
they usually contain noise. To delete such parts and separate the segments, end-point detection is conducted, where a segment is defined as a set of continuous notes without a pause. The segments obtained in the end-point detection are subsequently used to calculate the diminuendo and loudness variance (Sections 5.5.3 and 5.5.4).
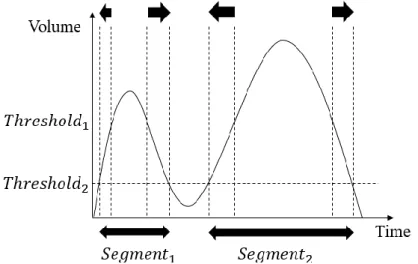
Figure 5.2 shows the end-point detection method. The end-point detection method is based on two volume thresholds. The upper threshold (𝑇ℎ𝑟𝑒𝑠ℎ𝑜𝑙𝑑1 in
Figure 5.2) determines the initial end-points, and the boundaries are extended until volume reach the lower threshold (𝑇ℎ𝑟𝑒𝑠ℎ𝑜𝑙𝑑2 in Figure 5.2). In this research, the
upper threshold is 20% of the largest volume in the song clip, and the lower threshold is 10% of the largest volume in the song clip. In Figure 5.2, there are two segments in the song clip. Note that Figure 5.2 is just a short example: there are usually more than 10 segments in a song clips in the singing corpus, which is about 30 seconds.
5.3 Feature Selection
Features are selected on the basis of previous research [2] [25] and subject feedback from the questionnaire described in Section 4.
In this study, many features that may be relevant to singing enthusiasm were applied, but only five features that led to better results were selected. The unselected features included pitch scoop up or down, the standard deviations of loudness and roughness, crescendo at the end of segments, crescendo and diminuendo between segments, a sudden loud voice, and the frequency of using a breathy voice. These features were not selected because of their insufficient identification accuracy (for example, it is hard to identify a breathy voice correctly) or because the singing technique, such as pitch scoop, was seldom used in our singing corpus.
The five selected features were pitch accuracy, vibrato, diminuendo at the end of segments, the correlation between loudness and pitch, and average roughness. Among them, pitch accuracy was the most mentioned factor in the questionnaire feedback. If a singer sings with poor pitch accuracy, listeners may be distracted and find it difficult to perceive enthusiasm. Vibrato is often used as a feature when evaluating singing. In a previous study on emotion in singing, vibrato was considered as an indicator of arousal and enthusiasm [25]. The end of each note is considered to be an important
point in expressing emotion. Diminuendo, which means that the volume decreases with time, is a common means of expression. According to [2], a loud voice on high notes expresses enthusiastic, thus, the correlation between loudness and pitch may be higher in more enthusiastic singing. Roughness is a timbre-related feature, which becomes higher when a singer sings with a dissonant voice and lower when a singer sings with a bright voice.
5.4 Low Level Features Extraction
To calculate the five features, three low-level features, including pitch, loudness, and roughness, are first extracted.
5.4.1 Pitch
The pitch is calculated with unbroken pitch determination using dynamic programing (UPDUDP) proposed by Chen in 2008 [12]. UPDUDP is a dynamic-programing-based pitch tracking method considering both periodicity and smoothness.
To apply UPDUDP to a frame, the periodicity detection function (PDF) is first computed based on auto-correlation function (ACF). The concept of ACF is to shift a frame and calculate the inner product of the overlap part of the shifted frame and the original frame. The inner product shall be larger when the overlapped parts are more
similar. As a consequence, the shifted sample points with a larger inner product is more likely to be the pitch period. Given a frame 𝑠(𝑖), 𝑖 = 1,2, … , 𝑛, the ACF is:
𝐴𝐶𝐹(𝑡) = ∑ 𝑠(𝑖) × 𝑠(𝑖 + 𝑡),
𝑛−𝑡
𝑖=0
where 𝑡 is the shifted sample points, and 𝑡 = 1,2, … , 𝑛.
Given that there are 𝑚 frames in a song clip, an ACF matrix with size 𝑚 × 𝑛
shall be obtained. The objective of UPDUDP is to find the path 𝑝 = [𝑝1, … , 𝑝𝑖, … , 𝑝𝑚] over the ACF matrix with higher ACF value and smoother pitch
change by dynamic programming. The cost function is defined as follows:
cost(𝑝, 𝜃, 𝑘) = ∑ 𝐴𝐶𝐹(𝑝𝑖)
𝑚
𝑖=1
+ 𝜃 × ∑ |𝑝𝑖 − 𝑝𝑖+1|𝜇,
𝑚−1
𝑖=1
where 𝜃 and 𝜇 are the linear and exponential transition penalty terms for the difference of pitch in a path of 2 neighboring frames. Reference [13] proposed a method to tune the penalty terms with binary search for every individual audio signal.
However, this method is time consuming, and the pitch tracking accuracy is adequate for this system without tuning the penalty terms. Consequently, the penalty terms are simply set to constants, 𝜃 = 1, 𝜇 = 2.
To minimize the above cost function with dynamic programing, the optimum-valued function is:
𝐷(𝑖, 𝑗) = 𝐴𝐶𝐹𝑖(𝑗) + 𝑚𝑖𝑛𝑘∈[1,𝑗]{𝐷(𝑖 − 1, 𝑘) + 𝜃 × |𝑘 − 𝑗|𝜇},
where 𝑖 = 1,2, … , 𝑚 (number of frames), and 𝑗 = 1,2, … , 𝑛 (number of sample points in a frame). The initial condition is
𝐷(1, 𝑗) = 𝐴𝐶𝐹1(𝑗), 𝑗 = 1,2, … , 𝑛.
The optimum cost is 𝑚𝑖𝑛𝑗∈[1,𝑛]𝐷(𝑚, 𝑗).
The path with optimum cost indicates the pitch period of every frame in a song clip. After obtaining the path, the pitch of a song clip can be easily derived.
5.4.2 Loudness
The loudness is calculated with MA toolbox [14]. MA toolbox is a music (audio) signal analysis toolbox for Matlab implemented by Elias Pampalk. MA toolbox provides a function, “ma_sone”, to estimate the loudness sensation. In comparison with volume which is directly derived from the amplitude of signal, loudness here considers human perception with auditory model. Sounds with the same volume may have different sensation loudness level because of the pitch difference.
The detailed algorithm to calculate loudness in MA toolbox is described in [15].
First of all, Fast Fourier Transform (FFT) is applied to calculate spectrum. In this work, the frame size is 40 ms and the overlap is 30 ms with Hanning window.
Secondly, the spectrum is separated into 20 critical bands according to Bark Scale, a psychoacoustical scale proposed by Eberhard Zwicker [16]. These critical bands model cochlea in auditory system. The critical bands are wider in higher frequency.
Third, the spectral masking effect is calculated based on [17]. Spectral Masking effect is the phenomenon that a quieter sound will be weaken when there is a louder sound presents simultaneously and has similar frequencies. Finally, the loudness of every critical band is calculate in decibel sound pressure level (dB-SPL), and then in Sone based on [18]. One Sone is defined as loudness level of a 1 kHz sound at 40 dB-SPL.
Two Sone is two times louder than 1 Sone, and so on.
After obtaining the sensation loudness level of each critical band, the total loudness level of a frame is calculated based on [19]. This total loudness level is used to calculate higher level features in this system (See section 5.4.3 and 5.4.4).
5.4.3 Roughness
Roughness is calculated by MIR toolbox [20]. MIR toolbox provides integrated music signal processing Matlab functions. The roughness used in this system is obtained by a function, “mirroughness”. The algorithm used in MIR toolbox to calculate roughness is proposed by Sethares [21]. Here, roughness means the perceived dissonance. Any frequency pair of sinusoids has its sensory dissonance
value, which is defined by Plomp and Levelt [22]. To calculate roughness, the peaks of a spectrum are first calculated. The average of all the dissonance between all possible pairs of peaks is the roughness.
5.5 Features Used for Singing Enthusiasm Evaluation
5.5.1 Pitch Accuracy
According to the feedback obtained from the questionnaire mentioned in Chapter 4, pitch accuracy influences the human perception to singers’ enthusiasm. When a singer sings with terrible pitch accuracy, listeners may be distracted and feel hard to perceive the enthusiasm.
The pitch accuracy is calculated without knowledge of the original melody. The method used for pitch accuracy estimation in this system was proposed by Nakano in 2006 [7]. The pitch of a whole song clip is moved up or down to obtain the best fitting with a semitone grid, that is, the total distance between the detected pitch in every frame and its nearest semitone gridline is minimized. The smallest total distance obtained is used as the pitch accuracy feature here. The smaller the value of this feature, the better the pitch accuracy of the song clip.
5.5.2 Vibrato
After observing the singing corpus and human-labeled evaluation results, it is found that singers tend to sing with vibrato when they sing with enthusiasm, and the vibrato also makes listeners perceive enthusiasm. There is also a research on singing emotion expression which considers vibrato an indication of arousal and enthusiasm [23].
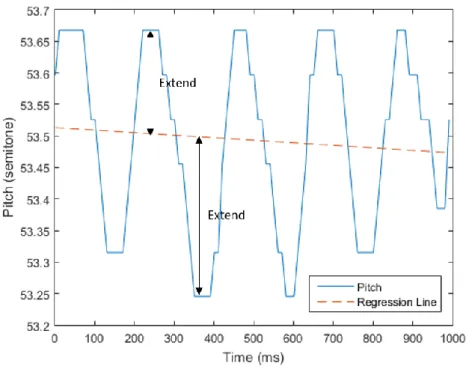
Figure 5.3 shows an example of vibrato. According to previous research on singing voice analysis [24][25], there are four conditions of vibrato:
(1) Vibrato rate: According to previous research, the vibrato rate is typically between 5 to 7.5 Hz. However, the vibrato rate range of different type of songs would be different. After observing some Mandarin pop songs and experiments, the range is adjusted to 2 to 10 Hz in this research.
(2) Extent: The extent of vibrato is less than 1 semitone.
(3) Regularity: Generally consistent.
(4) Waveform: Approximately sinusoidal.
Figure 5.3 An example of vibrato
To identify the vibrato based on pitch according to the above condition, a vibrato identification method is proposed in this work. The vibrato identification is conducted with frame size 500 ms and overlap of 250 ms. To identify vibrato in a frame, given that the pitch vector of the frame is 𝑃 = 𝑝1, 𝑝2, … , 𝑝𝑛, the difference between the maximum pitch and the minimum pitch in a frame, 𝑚𝑎𝑥(𝑃) − 𝑚𝑖𝑛 (𝑃), is first computed. If 𝑚𝑎𝑥(𝑃) − 𝑚𝑖𝑛(𝑃) > 𝑡𝑤𝑜 𝑠𝑒𝑚𝑖𝑡𝑜𝑛𝑒𝑠, the system judges that there is no vibrato in this frame. Secondly, the autocorrelation function (ACF, mentioned in section 5.4.1) is applied to 𝑃′= 𝑝2− 𝑝1, 𝑝3− 𝑝2, … , 𝑝𝑛− 𝑝𝑛−1. If the maximum ACF is larger than 0.04, and the frequency derived from the ACF index is between 2 to 10 Hz, the system judges that there is vibrato in this frame.
The number of frames with vibrato as a percentage of the total number of frames is considered the vibrato feature of a song clip in this system.
5.5.3 Diminuendo at the End of Segments
The end of each note is considered an important point to express emotion.
Diminuendo, which means that the volume becomes lower and lower as time goes on, is a common expression method.
To detect the diminuendo, the segment information derived from end-point detection is used (See section 5.2). For segments longer than 400 ms, given that the loudness of the last 400 ms in a segment is 𝐿 = 𝑙1, 𝑙2, … , 𝑙40 (The frame size is 10 ms), the Pearson product-moment correlation coefficient between 𝐿 and 40, 39, … , 1 is calculated. If the correlation coefficient is larger than 0.4. It is considered that there is diminuendo at the end of the segment.
The number of segments with diminuendo as a percentage of the total number of segments is the diminuendo feature used in this system.
5.5.4 Correlation between Loudness and Pitch
After observing the song clips in singing corpus, it is found that when singers sing with high enthusiasm, the loudness often goes large along with the pitch goes high.
The correlation coefficient between loudness and differences in pitch in every segment is calculated to represent how the loudness varies with pitch. The value of this feature would be larger when the singer sings with higher loudness in higher pitch and sings with lower loudness in lower pitch. There are four steps in the calculation of this feature for a song clip in this system:
(1) Computation of median: The median pitch and loudness in each segment are first computed. Given that there are 𝑛 segments in a song clip, the median pitch of all segments is 𝑃𝑀 = 𝑝𝑚1, 𝑝𝑚2, … , 𝑝𝑚𝑛, and the median loudness values of all segments is 𝐿𝑀 = 𝑙𝑚1, 𝑙𝑚2, … , 𝑙𝑚𝑛 .
(2) Computation of pitch difference: The pitch difference between adjacent segments is 𝑃𝑀′ = 𝑝𝑚2− 𝑝𝑚1, 𝑝𝑚3− 𝑝𝑚2, … , 𝑝𝑚𝑛 − 𝑝𝑚𝑛−1.
(3) Interpolation: To avoid any influence of the number of segments, 𝐿𝑀 and 𝑃𝑀′ are both normalized to 20 terms, 𝐿𝑀̃ and 𝑃𝑀̃ , by interpolation. ′
(4) Computation correlation coefficient: The Pearson product-moment
correlation coefficient between 𝐿𝑀̃ and 𝑃𝑀̃ is calculated as the feature. ′
5.5.5 Average Roughness
After comparing some clips in the singing corpus with their roughness values, it
higher average roughness. The sound with higher roughness is often more hoarse, which may have listeners feel less enthusiasm.
Instead of directly calculating the average roughness of the whole of each song clip, a roughness threshold of 10 is set and only frames with roughness lower than 10 are taken into account because frames with roughness higher than 10 are often with aspirated consonants or noise. The average of values of roughness lower than the threshold is taken as a feature for this system.
5.6 Classifier: Support Vector Regression Machine
In this singing enthusiasm evaluation system, Support Vector Regression Machine (SVR) is applied as the classifier with LIBSVM [26], which is a library proposed by Chih-Chung Chang for Support Vector Machine (SVR). A brief introduction to SVR is as below.
SVR, which is proposed by Vladimir N. Vapnik in 1996 [27], is the regression version of SVM. While the main idea of SVM is to find a hyperplane which divides training data, that of SVR is to find a hyperplane which predicts output of training
data at most. More specifically, given that the training data set with 𝑛 songs is (𝑥1, 𝑦1), (𝑥2, 𝑦2), … , (𝑥𝑛, 𝑦𝑛) ∈ 𝑅5× 𝑅, where 𝑥𝑖 is the five dimensional features
described in Section 5.4, and 𝑦𝑖 is the human-labeled score. The objective of SVR is
to find a hyperplane, 𝑓(𝑥) = 𝜔 ∙ 𝑥 + 𝑏, 𝜔 ∈ 𝑅5, 𝑏 ∈ 𝑅, such that for every instance 𝑥𝑖, 𝑦𝑖− 𝑓(𝑥𝑖) ≤ 𝜀 + 𝜉𝑖, 𝑓(𝑥𝑖) − 𝑦𝑖 ≤ 𝜀 + 𝜉𝑖′, where 𝜀 is a small constant (𝜀 = 0.001 in this system), and 𝜉𝑖 and 𝜉𝑖′ are the smallest nonnegative numbers
satisfying the above inequalities.
6 System Evaluation Experiment
We evaluate the proposed system with the singing corpus mentioned in Chapter 3 and human-labeled scores described in Chapter 4. A leave-one-singer-out test was conducted to test each song clip. This test was performed to evaluate the song clips sung by each participant by the model trained with song clips sung by the other eight participants. This was performed nine times until all the song clips were evaluated.
The Pearson product-moment correlation coefficient and the root-mean-square error (RMSE) between human-labeled scores and system-evaluated scores are calculated as
the system evaluation results. Given that the human-labeled scores are 𝐻 = ℎ1, ℎ2, … , ℎ342, and the system-evaluated scores are 𝑆 = 𝑠1, 𝑠2, … , 𝑠342. The
correlation coefficient between 𝐻 and 𝑆 is
𝐶𝑜𝑟𝑟𝑐𝑜𝑒𝑓(𝐻, 𝑆) = 1
342 − 1∑(ℎ𝑖− 𝜇𝐻
𝜎𝐻 )(𝑠𝑖 − 𝜇𝑆 𝜎𝑆 )
342
𝑖=1
,
where 𝜇𝐻 and 𝜇𝑆 are means of 𝐻 and 𝑆, and 𝜎𝐻 and 𝜎𝑆 are standard deviations of 𝐻 and 𝑆, respectively.
7 Results and Discussion
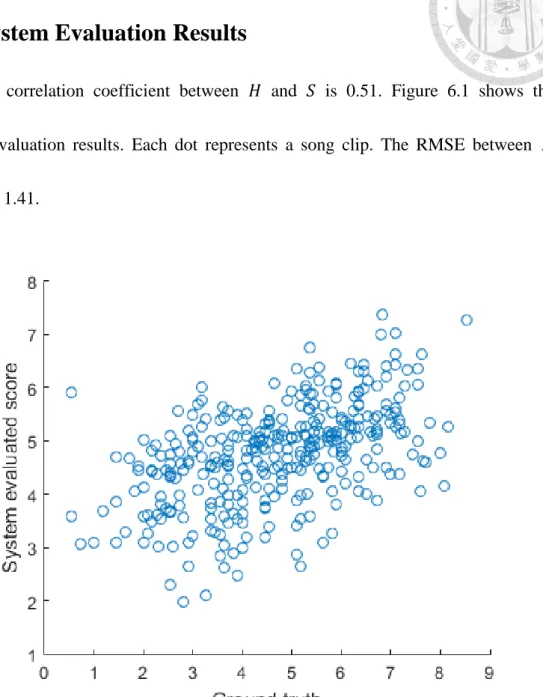
7.1 System Evaluation Results
The correlation coefficient between 𝐻 and 𝑆 is 0.51. Figure 6.1 shows the system evaluation results. Each dot represents a song clip. The RMSE between 𝐻 and 𝑆 is 1.41.
Figure 7.1 System Evaluation Results
7.2 Comparison between Singer-intended, Human-labeled, and System-evaluated Enthusiasm
In this section, some discussion and error analysis are conducted based on the experimental results shown on Table 7.1.
As mentioned in Section 3.2, the singing corpus recording participants were asked to sing each song twice. Table 7.1 lists the average human-labeled and system-evaluated scores of the two sets recorded by each participant. Set A is the set where participants sang with singer-intended enthusiasm, and Set B is the set where they sang without singer-intended enthusiasm. For each participant, the average human-labeled score of set A is higher than that of set B. It indicates that the singer-intended enthusiasm of all participants can be perceived by listeners.
Comparing the system-evaluated scores with the human-labeled scores, there are some deviations. Three main sources of error were observed. Firstly, because the accuracy of pitch extraction, pitch accuracy estimate, and vibrato identification are not perfect, some of the error in the evaluation was generated by errors in these features. For example, there is only one song clip with evaluation deviation more than 4 (in the set B of participants B). The human-labeled score of the song is 0.55 (the lowest), and the system-evaluated score is 5.54. The main reason for this song clip
obtaining the lowest human-labeled score may be the terrible pitch accuracy.
However, because the pitch error of notes in this song clip are often more than 1 semitone, the pitch accuracy estimation method described in section 5.4.1 cannot estimate the pitch accuracy correctly. The result may be improved if the pitch is only fit to the semitone gird lines which can compose a harmonic chord.
Secondly, all song clips are evaluated by the same features. The advantage of applying the same evaluation algorithm to different types of songs is that the songs do not need to be pre-classified or pre-labeled with emotion types. However, the suitable emotion expression methods may differ from song to song or even from person to person. This system may have problems on singer with special singing style while
trying to provide a general singing enthusiasm evaluation model. For example, the main reason why participant D’s set A obtains low average system-evaluated score is
that the loudness of her songs does not go along with the pitch. It leads to the lower system-evaluated scores while not all the songs are necessary to be expressed with high correlation between loudness and pitch. The different emotion expression ways in different song types will be discussed in detail in Section 7.3.
Thirdly, participant D’s articulation in set B is unclear, but the features this system used do not include any articulation-related feature. As a consequence,
system-evaluated scores of songs in participant D’s set B are often higher than human-labeled scores.
Table 7.1 Average human-labeled scores and system-evaluated scores of all singers Set A
(With singer-intended enthusiasm)
Set B
(Without singer-intended enthusiasm) Singers Human-labeled System-evaluated Human-labeled System-evaluated
A 6.88 5.61 6.61 5.80
B 4.95 5.03 3.10 4.38
C 5.38 4.21 2.14 3.23
D 6.51 5.06 2.93 4.74
E 5.17 5.35 4.38 4.97
F 6.19 4.97 4.01 4.76
G 4.15 3.67 3.34 3.48
H 5.84 5.49 4.39 5.02
I 5.10 5.08 3.73 4.69
Average 5.57 4.94 3.85 4.56
7.3 Emotion Expression in Different Song Types
The methods of expressing enthusiasm are different in different song types. As a consequence, the best features for evaluating singing enthusiasm may differ in different types of songs. Table 7.2 shows Spearman’s rank correlation coefficients between the human-labeled scores and the five features of four different types of song clips in the singing corpus. The Spearman’s rank correlation coefficient was considered instead of the Pearson product-moment correlation coefficient because the exact relationship between scores and features may be nonlinear. By observing the
correlation coefficients, the importance of features in different song types was revealed.
Pitch accuracy has the lowest correlation coefficient with the scores for songs in quadrant I of the V-A plane (passionate, happy songs with a fast tempo). This indicates that listeners tend to have higher pitch error tolerance for this type of songs.
The reason for this may be that the length of the notes of this type of song are often short, making pitch errors less conspicuous.
The correlation coefficient between the vibrato time and the scores is especially high for songs in quadrant III because sad songs with a slow tempo have more long tones, which are suitable for employing vibrato.
The diminuendo time has the highest correlation coefficient with the scores for songs in quadrant I. For songs in quadrant II, III and IV, notes are often long, causing singers to naturally perform diminuendo at the end of notes even when singing with little enthusiasm. In contrast, diminuendo in songs with faster tempo is more likely to be performed intentionally.
The correlation coefficients between loudness and pitch are low except for songs in quadrant I. This indicates that performing with high correlation between loudness and pitch is suitable for passionate songs, but not for other types of songs.
Roughness has high correlation coefficients with the scores in all the song types except for those in quadrant I because the notes of songs in quadrant I are often short and the influence of the timbre of a singing voice is more obvious in longer notes.
There may be another aspect of roughness that is not covered by our singing corpus.
For amateur singers, such as the participants who recorded the singing corpus, high roughness often means low timbre quality. However, for professional singers, a guttural voice with high roughness may be used to express a specific emotion.
Table 7.2 Correlation coefficients between human-labeled scores and the five features for the four song types
Features Quadrant in
V-A Plane
Pitch
Accuracy Vibrato Diminuendo Loudness-Pitch
Correlation Roughness
I -0.05 0.20 0.41 0.41 -0.01
II -0.40 0.31 0.27 0.06 -0.45
III -0.30 0.43 0.21 0.16 -0.28
IV -0.28 0.33 0.20 0.09 -0.50
8 Conclusions
In this work, a system for automatically evaluating singing enthusiasm is proposed. This system can evaluate songs with multiple phrases without the need for reference data. The correlation coefficient between the ground truth obtained from an online questionnaire and the system-evaluated scores was 0.51, as obtained by a leave-one-singer-out evaluation. The RMSE between the ground-truth and system-evaluated scores of each song was 1.41. The results indicate that this system can be applied in karaoke machines and mobile applications. There are three main sources of error. The first is feature extraction errors such as pitch accuracy estimation errors, the second is that no articulation-related features were used, and the final source is that different types of emotion may be expressed in different ways. For example, vibrato may be more suitable for sad songs than happy songs. The robustness of this system can be improved by considering the methods of expressing enthusiasm in different types of songs.
Reference
[1] H. J. Chong. 2010. Do we all enjoy singing? A content analysis of non-vocalists’ attitudes toward singing. The Arts in Psychotherapy, vol. 37, no.
2, pp. 120-124.
[2] T. Jeong. 1995. Score evaluation display device for an electornic song accompaniment apparatus. U.S. Patent No. 5434949.
[3] C. S. Park. 1996. Karaoke system capable of scoring singing of a singer on accompaniment thereof. U.S. Patent No. 5567162.
[4] T. Sone, K. Tsurumi, H. Kato, and T. Tanaka. 1998. Karaoke apparataus with individual scoring of duet singers,” U.S. Patent No. 5804752.
[5] W. H. Tsai and H. C. Lee. 2011. An automated singing evaluation method for karaoke systems. Proceedings of the IEEE International Conference Acoustic Speech Signal Process (ICASSP), pp. 2428–2431.
[6] W. H. Tsai and H. C. Lee. 2012. Automatic evaluation of Karaoke singing based on pitch, volume, and rhythm features. IEEE Transactions on Audio, Speech, and Language Processing, vol. 20, no. 4, pp. 1233–1243.
[7] T. Nakano, M. Goto, and Y. Hiraga. 2006. An automatic singing skill evaluation method for unknown melodies using pitch interval accuracy and vibrato features. International Conference on Spoken Language Processing, pp.
1706–1709.
[8] H. Takeuchi, M. Hoguro, and T. Umezaki. 2010. A KARAOKE system singing evaluation method that more closely matches human evaluation. IEEJ Transactions on Electrical and Electronic Engineering, vol. 7, pp. 6–7.
[9] R. Daido, M. Ito, S. Makino, and A. Ito. 2014. Automatic evaluation of singing enthusiasm for karaoke. Computer Speech and Language, vol. 28, no. 2, pp.
501–517.
[10] O. Mayor, J. Bonada, and A. Loscos. 2006. The singing tutor: expression categorization and segmentation of the singing voice. Proceedings of the AES 121st Convention.
[11] R. E. Thayer. 1989. The biopsychology of mood and arousal. Oxford University Press.
[12] J. C. Chen and J. S. R. Jang. 2008. TRUES: Tone recognition using extended segments. ACM Transactions on Asian Language Information Processing
[13] Z. C. Fan, J. Jang, and C. L. Lu. 2016. Singing voice separation and pitch extraction from monaural polyphonic audio music via DNN and adaptive pitch tracking. IEEE International Conference on Multimedia Big Data (BigMM), vol. 1.
[14] E. Pampalk. 2004. A Matlab toolbox to compute music similarity from audio.
Proceedings of the 2004 International Conference on Music Information Retrieval (ISMIR ’04), pp. 254–257.
[15] E. Pampalk, A. Rauber, and D. Merkl. 2002. Content-based organization and visualization of music archives. Proceedings of the tenth ACM international conference on Multimedia - MULTIMEDIA ’02, p. 570.
[16] H. Fastl and E. Zwicker. 1999. Psychoacoustics, facts and models.
Springer-Verlag Berlin Heidelberg.
[17] M. R. Schroeder, B. S. Atal, and J. L. Hall. 1979. Optimizing digital speech coders by exploiting masking propoerties of the human ear. The Journal of the Acoustical Society of America, vol. 66, no. 6, pp. 1647–1652.
[18] R. Bladon. 1981. Modeling the judgment of vowel quality differences. The Journal of the Acoustical Society of America, vol.69, no. 5, pp. 1414-1422.
[19] W. M. Hartmann. 1998. Signal sound and sensation. American Institute of Physics.
[20] O. Lartillot, O. Lartillot, P. Toiviainen, and P. Toiviainen. 2007. A Matlab toolbox for musical feature extraction from audio. International Conference on Digital Audio Effects, pp. 237-244.
[21] W. A. Sethares. 2005. Tuning, Timbre, Spectrum, Scale. Springer Science &
Business Media.
[22] R. Plomp and W. J. M. Levelt. 1965. Tonal consonance and critical bandwidth.
The journal of the Acoustical Society of America, vol. 38, no. 4, pp. 548–560.
[23] F. Eyben, G. L. Salomão, J. Sundberg, K. R. Scherer, and B. W. Schuller. 2015.
Emotion in the singing voice — a deeper look at acoustic features in the light of automatic classification. EURASIP Journal on Audio, Speech, and Music Processing, vol. 2015, no. 1, pp. 1-9.
[24] M. Kob, N. Henrich, H. Herzel, D. Howard, I. Tokuda, and J. Wolfe. 2011.
Analysing and understanding the singing voice: recent progress and open questions. Current Bioinformatics, vol. 5, no. 3, pp. 362–374.
[25] J. Sundberg. 1995. Acoustic and psychoacoustic aspects of vocal vibrato.
[26] C. Chang and C. Lin. 2011. LIBSVM : A Library for Support Vector Machines.
ACM Transactions on Intelligent Systems and Technology (TIST), vol. 2, pp.
1-39.
[27] H. Drucker, C. J. C. Burges, L. Kaufman, A. Smola, and V. Vapnik. 1996.
Support vector regression machines. Advances in neural information processing systems, vol. 9, pp. 155-161.
Appendix
Recording instruction 歌唱表現力 Dataset 錄音須知
感謝各位幫忙錄音\OwO/
這些錄音將會用在歌唱情緒表現力的研究,研究怎樣的音色變化、歌唱技巧 有助於情緒表達,並推展為一歌唱評分的機制,目前主要是我的碩士論文,在我 畢業之後可能會繼續留在 lab 當作學弟妹的研究素材,若不願意請告知。
以下有幾點錄音的相關事項,煩請閱讀,謝謝。
1. 歌單:頭號甜心、戀愛 ing、小情歌、陪你到世界的終結、火燒的寂寞、
失戀無罪、可惜不是你、記得(林俊傑版本),共八首。
2. 伴唱帶載點:
https://www.space.ntu.edu.tw/navigate/s/1F25303BDC1E498FB4758E71E4 E9A076QQY
3. 每首歌請唱兩次,一次投入情緒唱(轉音、抖音之類的全部可用,沒有 限制,假裝自己在唱 KTV),一次不投入情緒(像機器人一樣唱、心不 在焉地唱,但請盡量不要走音、掉拍)
4. 頭號甜心的Nanana 不用要唱,戀愛 ING 用喊的兩次LOVE 不用唱
5. 可自由升降 key,windows 升降 key(用其他系統的話再跟我說 OwO):
對右下角的喇叭按右鍵->播放裝置->在使用裝置的圖示點兩下->增
強->升降調
6. 請記下每首歌的升降 key給我
7. 請錄44100Hz、32-bit 的 wav 檔,用 Audacity(免費)錄音的話設定方
法如下:
編輯(E)->選項(F)->質量
如用手機錄音可使用 Smart Voice Recorder,可簡單設定上述數字 8. 請只聽左聲道伴奏(有些播音軟體可以設定或是直接只戴左邊耳機)
9. 錄音時請戴耳機,不要把背景音樂錄進去 10. 請確定背景不吵鬧&錄音設備沒有嚴重雜音
11. 如果音域不夠,可以主副歌分開錄,用不同 key。(還是盡量一起錄,
真的沒辦法才如此)
12. 請不要離麥克風太近或正對著麥克風,避免噗 mic(產生對麥克風吹氣 的聲音)
請在 12 月前給我錄好的音檔,如果不確定有沒有問題,可以先隨便錄一個 傳給我看看。
再次謝謝大家~
我的聯絡方式:陳珮珮 0952020301 [email protected]