國立臺灣大學生物資源暨農學院生物環境系統工程學 系
博士論文
Department of Bioenvironmental Systems Engineering College of Bioresources and Agriculture
National Taiwan University Doctoral Dissertation
新資料時代下以風險評估為觀點的環境資料分析應用 Applications of Environmental Data Analysis From the
Perspective on Risk Assessment in the New Data Era
李杰翰 Lee, Chieh-Han
指導教授:余化龍博士 Advisor: Yu, Hwa-Lung, Ph.D.
中華民國 108 年 12 月
December, 2019
誌謝
獻給我深愛的家人、朋友與曾經幫助過我的人。
Acknowledgements
Dedicated to my beloved family, friends, and whoever helped me.
摘要
近年來,在電腦科學與資訊科技領域,無論是在硬體或演算法上取 得的巨幅進展,大數據與機器學習皆成為了現今最熱門的兩個詞彙,
也使得其他不同領域皆想藉由這股新的科技力量在應用上有所突破。
也因為這股熱潮,資料成為了最重要的資產之一;資料分析方法成為 了不可或缺的技術;資料科學家成為了人力市場中的熱門職缺。相同 地,環境科學領域也極力嘗試結合此新型科技,來找出嶄新的應用方 式。然而,由於環境資訊與民眾風險感知是緊緊相扣的,因此,在現 今的這股資料浪潮中,從風險分析的觀點,在環境資訊的應用上有許 多重要且需被關注的議題。
在本論文中,嘗試由風險評估的觀點出發,探討在現今的的新資料 時代下,環境資料分析在應用上其可能性及衍生的重要課題。新資料 時代下的多樣應用,加速了政府在開放資料上的進展,然而,環境擁 有屬於公共財的特性,環境資料的蒐集與揭露主要掌握在政府部門手 中。民眾對於環境資訊知的權利,往往與政府部門形成了對立關係。
另外,在政府與民眾對於新科技在環境領域應用上的不熟悉,進而產 生環境風險認知上的歧見。在這其中,環境資料科學家藉由其專業的 科學知識與能力,在政府部門和民眾之間,形成一交互三角關係。此 三角關係中,為了因應新資料時代的發展,每一個角色對於其餘兩個 角色皆為不同的利益關係者。
本論文利用三個實際應用案例,作為闡述本論文所提出在新資料時 代下,臺灣環境資料分析可能的未來發展方向以及問題所在。首先,
本研究在開放政府與開放資料架構下,建立一南臺灣登革熱預警系統,
經由過往難以取得的登革熱發病資料結合氣象因子,提供政府部門在 登革熱防治上的預先部署依據,以及民眾對於自身所處環境的登革熱 風險認知。第二,本研究利用建立特定商用物聯網空氣感測器的校正 模型,經由比較不同可信度監測資料,了解環境數據除數字本身之外,
數據的不確定性與民眾風險感知之間的關係,需要謹慎的對待。最後,
本研究利用發展具備高效能的資料融合架構,整合確定性與不確定性 資料,凸顯在大量含有不確定性的環境資料之下,如何以資料融合方 式,達到正確的風險溝通結果。
本論文以風險評估的觀點,檢視現今在這個以資料引領的時代中,
環境科學結合資料分析方法在政府、社會與科學三方中所扮演的角色,
以及對於環境保護助益的可能性。希望此論文能夠給予未來環境資料 分析在風險管理中的一個初步方向。
關鍵字: 環境資料分析,風險分析,預警系統,資料校正,資料融合
Abstract
In recent years, the world has made tremendous progress in computer sci- ence and information technology. Either computer hardware development or algorithms evolution lead Big Data and Machine Learning become two most popular words nowadays. Other applied fields also have seen great opportuni- ties on using these emerging technologies to make a breakthrough. Because of this global trend, data has become one of the most valuable asset; data analysis methods have become the essential techniques; data scientists have become the most favored job in human resources market. Likewise, environ- mental science attempts to apply the new technology and finds innovations.
However, environmental information is strongly associated with public risk perception. Hence, there are many important issues from the perspective on risk assessment need to be concerned while surfing on this new data wave.
The dissertation aims to explore application potentials of environmental data analysis and its related issues from the aspect of risk assessment today.
The new data era has accelerated the progress of open governmental data.
Environmental information is considered as public asset. However, govern- ment agencies mostly have authorization of environmental information in col- lection and reveal. Public’s environmental information right-to-know often stands on the opposite side of government agencies. In addition, the reason for the controversy between government agencies and public is unfamiliar with the new technology. Besides, environmental scientists with professional knowledge and expertise forms the interaction triangle with the other charac-
ters that governments, public, and scientists are stakeholders to each other.
This dissertation illustrates the future possibility and problems for Tai- wan’s environmental data analysis in the new data era by three applications.
First of all, under Open Data and Open Government framework, the study constructed an early warning system of dengue fever in southern Taiwan through combining incidences with meteorological factors. The results could provide the disease prevention and control for government agencies and pro- voke public risk awareness from the disease. Secondly, the study built a cal- ibration model for particular commercial low-cost air quality sensors. By assessing the reliability of measurements, to have understanding that except for the numbers on devices, the relationship of measurement uncertainty and risk perception should be taken into consideration seriously. Lastly, the study developed a high performance data fusion framework that integrated certain and uncertain data to highlight the achievement for proper risk communica- tion with large amount of uncertain environmental information.
The dissertation stands at the perspective of risk analysis to inspect what kind of role that environmental data sciences play in the relationship trian- gle. In conclusion, the dissertation seeks to open the way for environmental data analysis which is associated with risk management, in further, possible contributions to environmental protection.
Keywords: Environmental data analysis, Risk analysis, Early warning sys- tem, Data calibration, Data fusion
Contents
口試委員會審定書 iii
誌謝 v
Acknowledgements vii
摘要 ix
Abstract xi
1 Personal Thoughts and Experiences on Environmental Analytics 1 1.1 The Government Agencies Somehow Get Lost in the Concept of Open Data 2 1.2 The Right to Know: the Conflict Between Government and Public . . . . 3 1.3 The Temptation of Big Data and Artificial Intelligence to the Government 4 1.4 The Myth of Uncertainty in Environmental Risk Communication . . . 5 1.5 Ideal-Practice Gap in Environmental Sciences with Data Analysis . . . . 7
2 The Critical Aspects of Environmental Data Analysis in the Present 11 2.1 From the past towards possible futures of data analysis . . . 12 2.2 Big Data and Machine Learning make a different future . . . 13 2.3 Reviews of Environmental data analyzing methods and applications . . . 15 2.4 Exposure assessment and risk communication in connection with environ-
mental data analysis . . . 16 2.5 A new era of environmental data analysis from the perspective on risk
assessment . . . 18
3 Objectives of the Dissertation 21
4 A Spatiotemporal Dengue Fever Early Warning Model Accounting for Non- linear Associations with Hydrological Factors: a Bayesian Maximum En- tropy Approach
(Published in Stochastic Environmental Research and Risk Assessment, 2016[108]) 23
4.1 The relationship between dengue fever and meteorology . . . 25
4.2 Early warning system modeling for dengue fever incidences . . . 26
4.3 Dengue fever in southern Taiwan . . . 27
4.4 Spatiotemporal DF prediction . . . 28
4.4.1 BME method . . . 28
4.4.2 Spatiotemporal DF modeling . . . 31
4.5 Dengue fever diffusion modeling across space and time . . . 35
4.6 Discussions . . . 39
5 An Efficient Spatiotemporal Data Calibration Approach for the Low-cost PM2.5 Sensing Network: A Case Study in Taiwan (Published in Environmental International, 2019[63]) 47 5.1 Questionable IoT-based sensors as solution to air quality monitoring . . . 48
5.2 Applications of Commercial PM2.5sensors and regulatory air quality sta- tions in Taiwan . . . 51
5.3 Space-time anomaly detection processes . . . 53
5.4 Nonlinear modeling for the biases from low-cost sensors . . . 56
5.5 The biases relationship between reference stations and PM2.5 sensors . . . 58
5.6 Discussions . . . 62
6 A High Performance Spatiotemporal Data Fusion Approach for Integrating PM2.5 Hard and Soft Measurements
(Unpublished) 67
6.1 The issue of high and low uncertainty air quality measurements in visual-
ization and interpretation . . . 68
6.2 Deployment and calibration of commercial PM2.5sensors in Taiwan . . . 70
6.3 Data fusion algorithm - BME method . . . 72
6.4 High performance integration with Quasi-Monte Carlo method . . . 74
6.5 Data fusion for PM2.5hard and soft measurements . . . . 75
6.6 The evolution of PM2.5levels mapping . . . 77
6.7 Discussions . . . 81
7 To the End of the Journey 85
Bibliography 89
List of Figures
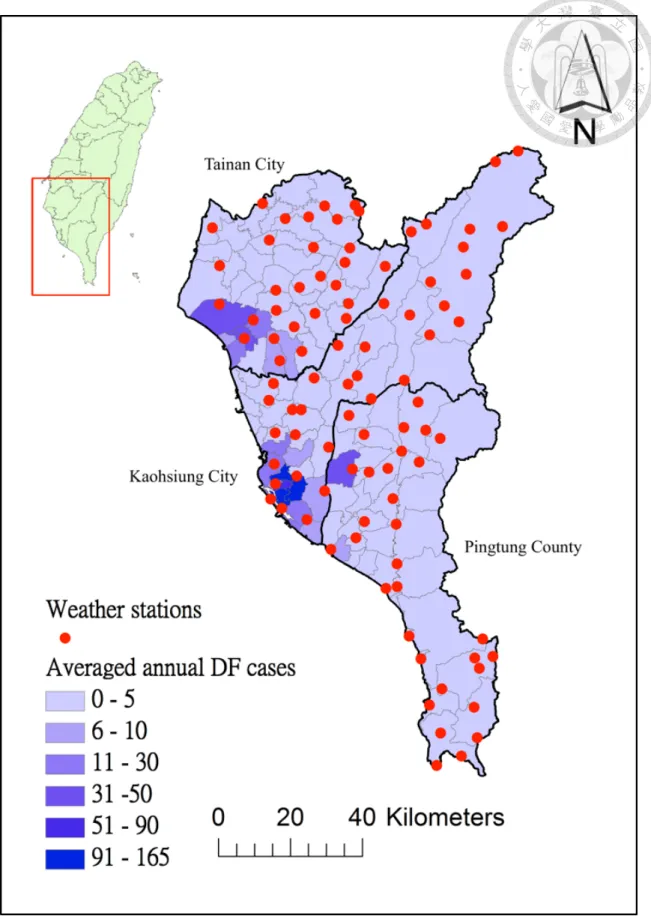
1.1 The triangle relationship between government agencies, environmental scientists, and public society. . . 7 2.1 The four V’s explanation of Big Data by IBM scientists[32]. . . 14 2.2 Environmental sciences is an interdisciplinary study field. . . 17 4.1 Map of the study area, which includes averaged annual DF cases of 107
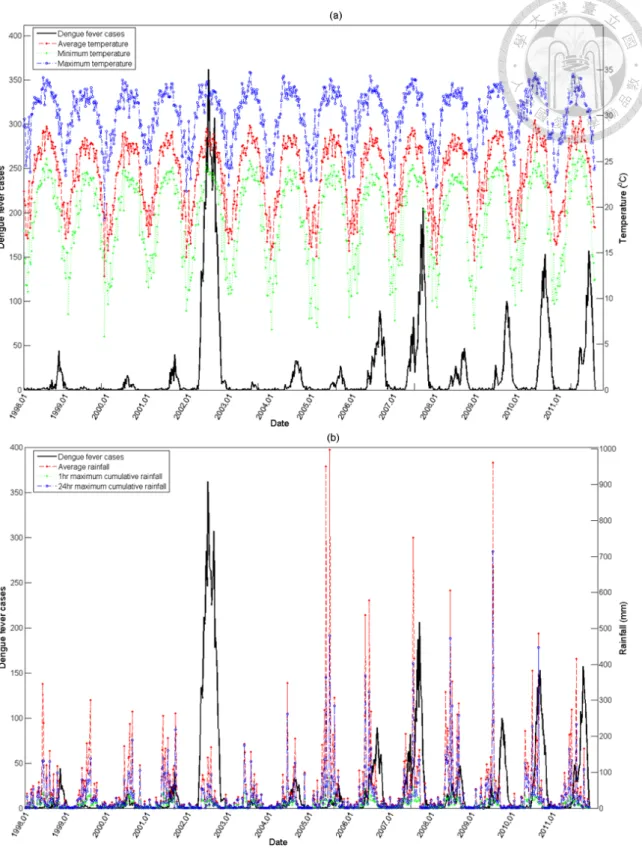
districts in southern Taiwan, and the location of weather stations. . . 29 4.2 Trend plot of (a) weekly total dengue fever cases and temperature mea-
sures. Dengue fever cases(black); Average temperature(red); Minimum temperature(green); Maximum temperature(blue), and (b) weekly total dengue fever cases and rainfall measures. Dengue fever cases(black);
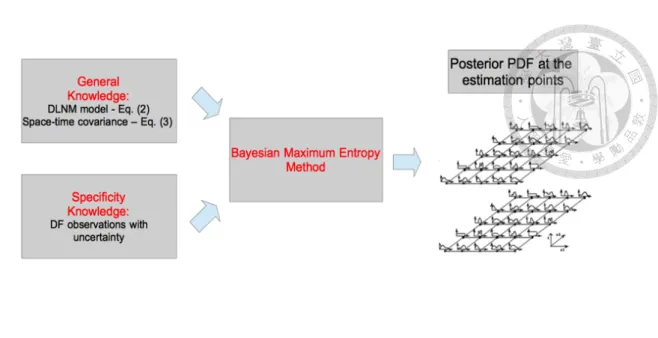
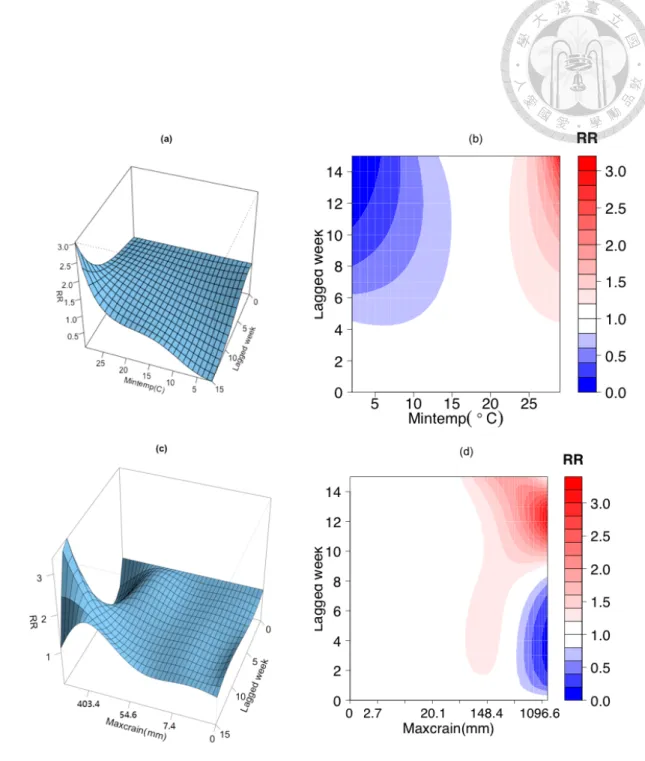
Average rainfall(read); 1-hr maximum cumulative rainfall(green); 24-hr maximum cumulative rainfall(blue). . . 30 4.3 The conceptual flowchart of BME analysis in space-time DF modeling. . 32 4.4 3D graphs and their associated contour plots showing the relative risk of
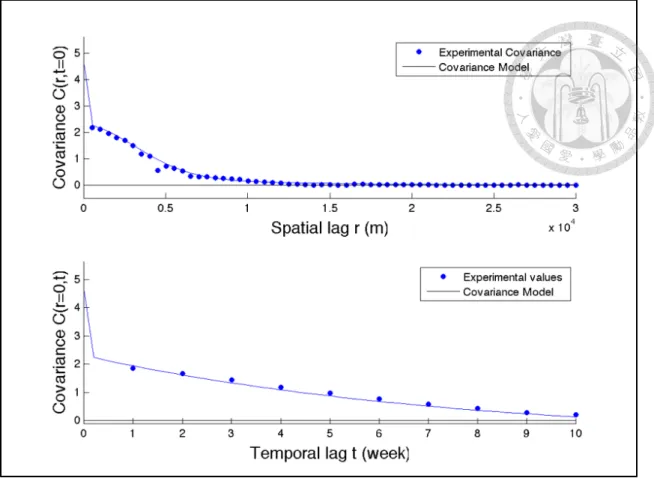
dengue fever incidence at lagged weeks corresponding to the weekly mini- mum temperature (a & b), and the logarithm of the weekly 24-hr maximum cumulative rainfall (c & d). . . 36 4.5 The nested spatio-temporal covariance model which characterizes the DF
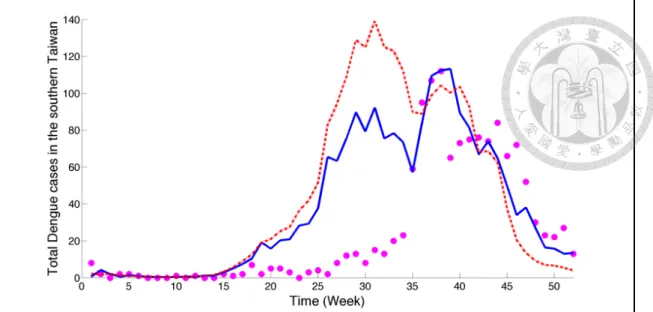
diffusion across space (top) and time (bottom). . . 38 4.6 Comparison between DF cases: observed (dot) and predicted by the DLNM
model (dashed line) and BME model (solid line) during 2012 in southern Taiwan. . . 39
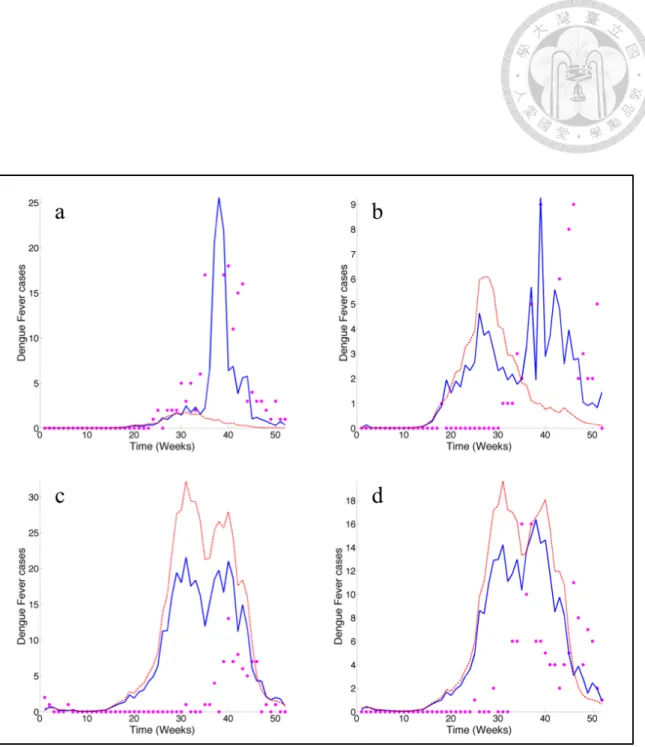
4.7 Comparisons between observed (dot) and predicted (DLNM: dashed line;
BME: solid line) DF cases during 2012 at: a Annan District, b North Dis- trict, c Sanmin District, and d Lingya District. . . 40
4.8 Spatio-temporal distributions of observed and predicted DF cases at the selected week of 2012. . . 41
4.9 Comparison between weekly observed and predicted DF cases (DLNM:
top; BME: bottom) at all townships in southern Taiwan during 2012. . . 42
5.1 Spatial distribution of TWEPA stations (triangles) and AirBox devices (solid circles) in Taichung metropolitan area, where the red triangles are the places with both sensors collocated. . . 52
5.2 The raw data comparison of AirBox and TWEPA stations at three selected sites in December, 2017. Left column is time series comparison and right column is scatter plots of PM2.5 observations from AirBox vs. TWEPA stations. Red dot: TWEPA observations; Blue square: AirBox-1; Orange triangle: AirBox-2. . . 54
5.3 The daily bias correction relationships in Eq. (5.3) with respect to Air- Box PM2.5 observations on (a)12/1-12/5, (b)12/6-12/10, (c)12/11-12/15, (d)12/16-12/20, (e)12/21-12/25, and (f)12/26-21/31, respectively. . . 54
5.4 The daily bias correction relationships in Eq. (5.3) with respect to AirBox temperature observations on (a)12/1-12/5, (b)12/6-12/10, (c)12/11-12/15, (d)12/16-12/20, (e)12/21-12/25, and (f)12/26-21/31, respectively. . . 59
5.5 The daily bias correction relationships in Eq. (5.4) with respect to TWEPA observations on (a)12/1-12/5, (b)12/6-12/10, (c)12/11-12/15, (d)12/16- 12/20, (e)12/21-12/25, and (f)12/26-21/31, respectively. . . 59
5.6 The calibrated results of AirBox and TWEPA stations at three selected sites in December 2017. Left column is time series comparison and right column is scatter plots of PM2.5 observations from AirBox vs. TWEPA stations. Red dot: TWEPA observations; Blue square: AirBox-1; Orange triangle: AirBox-2. (For inter- pretation of the references to colour in this gure legend, the reader is referred to the web version of this article. . . 60 5.7 The results of applying a calibration model obtained from a speci c station
on the calibration at the other stations. Left to right: Dali station, Shalu station, and Zhongming station. Top to bottom: the calibration model constructed by Dali, Shalu, and Zhongming observations, respectively. . . 61 5.8 T The spatial evolution of the calibration process at 3 a.m. on Dec. 29th,
2017. Left: before calibration; right: after calibration. Triangular sym- bols are TWEPA stations and circular symbols are AirBox devices. . . 61
6.1 Spatial distribution of TWEPA regulatory stations (red triangles) and Air- Box devices (blue circles) in the selected Taichung metropolitan area. . . 72 6.2 Spatial distribution of 625 estimated locations (black cross markers). . . 76 6.3 The empirical and theoretical covariance model (Above: spatial; Below:
temporal). Blue dots are empirical covariances that calculated from hard data and mean values of soft data. Red line is the fitted theoretical covari- ances. . . 78 6.4 Scenario 1 estimation of spatiotemporal PM2.5 concentrations. Left: ex-
pected values of estimation; Right: variances of estimation. . . . 79 6.5 Scenario 2 estimation of spatiotemporal PM2.5 concentrations. Left: ex-
pected values of estimation; Right: variances of estimation. . . . 79 6.6 Scenario 3 estimation of spatiotemporal PM2.5 concentrations. Left: ex-
pected values of estimation; Right: variances of estimation. . . . 80 6.7 Scenario 4 estimation of spatiotemporal PM2.5 concentrations. Left: ex-
pected values of estimation; Right: variances of estimation. . . . 80
6.8 Scenario 5 estimation of spatiotemporal PM2.5 concentrations. Left: ex- pected values of estimation; Right: variances of estimation. . . . 81
List of Tables
4.1 Comparison of the cross-validation results between weekly observed and predicted DF cases (DLNM: top; BME: bottom) at all townships in south- ern Taiwan during 2012 . . . 39 5.1 The summary statistics of the PM2.5 observations from the TWEPA and
AirBox sensors. . . 53
Chapter 1
Personal Thoughts and Experiences on Environmental Analytics
” 天色漸漸光,咱就大聲來唱著歌。
一直到希望的光線,照著島嶼每一 個人。”
滅火器 Fire Ex. 《島嶼天光》
”Why do I pick Environmental data analysis as the theme of my dissertation?” I am asking myself when the journey has come to an end. I was fascinated by the beauty of the Earth when I was still a young child. The beauty has motivated me to dedicate my- self to protect this planet since then. At the beginning, I imagined that I would be a more engineer-like person who possibly build some equipments to improve energy efficiency or keep the environment clean. Along with the evolution of computer power and data analyt- ics, after several years, my research interests has slightly been changed. My academic life today is full of data, modelings, programmings, statistics, and information theory etc., and my role is transformed into that is called as Data Scientist. Although the transformation has changed skills and tools I owned than what I expected before, my life goal is still the same to be achieved, ”working towards a sustainable future”.
Fortunately, I am participating in a world that data is viewed as one of the most valuable resources. This situation gave me great opportunities to solve environmental problems
through data analysis. However, some critical thoughts were generated while I was ana- lyzing the environmental data including questions, observations, suggestions and visions from my personal experiences on environmental data sciences. I would like to express these topics through my dissertation and open for discussion. Following sections are my organized thoughts and idea, and hope the contents will resonate with audiences.
To be clear, these thoughts came from my experiences in Taiwan’s environmental stud- ies and most were the participation of government projects.
1.1 The Government Agencies Somehow Get Lost in the Concept of Open Data
Taiwan government has been carried out some long-term environmental monitoring projects for decades. Namely, environmental information is not a new type of data, it has been stored and existed for a long time and the public barely paid attention to. Not like western countries, in the past, environmental monitoring data need file applications to be collected in Taiwan. This made the public was difficult to access environmental information freely.
For keeping up with Open Data trends around the world, the government has worked hard to open environmental information as possible as they can and expects to increase govern- ment accountability. However, at first, the government did not know what kinds of data were needed and useful to open to public. A lots of redundant information were released and received complaints from the public. Luckily, with the help of communities and ex- perts, now the government has built a well off open data platform that citizen could easily access to the environmental information after years of working. It also make an impact on conventional environmental management.
In my experience, because the concept of Open Data is still a modern and ongoing field, government agencies are difficult to clear see the path of application yet. It definitely need in collaboration with communities or non-governmental organization who have bet- ter realization of environmental issues in reality. Although the visibility of environmental information has been raised, the government is confused about the evaluation of applying
security and privacy. Open Data between government and public is like a wrestling game.
The public has offensive game style that wants all information could be reached; on the other hand, the government plays defensively for security reasons. Furthermore, diverse environmental issues have confounded the governmental effort directions.
One benefit of Open Data is to increase government transparency and accountabil- ity. But bureaucracy in Taiwan has limited features of environmental open data based on my observations. Government agencies are worried about environmental measurements would be used as political leverage that the public usually doubts on reliability and va- lidity of monitoring. This situation is like a vicious cycle that build on governmental and public concerns each other. It is crucial for government to be balanced against the benefit of Open Data and relates to the right to access environmental information.
1.2 The Right to Know: the Conflict Between Govern- ment and Public
People are living in the environment and it is a commonsense that everyone should has the right to access and require the environmental information. As a citizen, I would like to know that ”What the quality of air I breathe?”, ”What the quality of water I drink?”,
”Does my vegetables grow in the contaminated soil?”, and ”Is there any infectious dis- ease near my living area?” etc.. All these information are depends on well-established environmental monitoring systems. As a government, environmental information is not only public service but also represents resource management. Government agencies could determine and execute control strategies and policies by monitoring measurements that these administrative actions could result in increasing government accountability and per- formance. For example, water is the most valuable resource in the world. In water man- agement, high efficiency of water allocation could be achieved by accurate monitoring and reduce the impact of drought.
Because environmental issues are always connected to human beings or society. Nat- urally, people have the right to know environmental conditions of places where they live.
There are two famous lawsuits cases about adverse health impacts of groundwater con- tamination. One occurred in Taiwan and the other was in the U.S.. In the first case, a former U.S. company, Radio Corporation of America (RCA) was found that the com- pany dumped toxic industrial waste in Taoyuan, Taiwan and polluted both the soil and groundwater. Since lack of information about the contamination, employees of RCA were exposed to carcinogens without knowing. The second case in the U.S. alleged contami- nation of drinking water in the southern California that Pacific Gas and Electric Company (PG&E) discharged waste water and contaminated nearby communities with toxic. Both cases caused huge loss to local people’s health, the environment and the companies, and the main reason of these cases is the absence of information about environment at the time.
Environmental information is like a rose has its thorn. Citizen argues about that mon- itoring equipments and systems were funded from taxation. The information should be considered as public asset and is freely accessible. However, the government is obsessing about environmental information demonstration by public communities and groups, for example, opposition politicians would attack the authority by bad air quality. Data relia- bility is another critical environmental debate topic. At this point, the government wants to ensure data quality and maintain the accuracy but the public usually thinks about the num- bers have been faked. The results of this structure is tended to be a serious contradiction while the role of data is getting more than ever in the future.
1.3 The Temptation of Big Data and Artificial Intelligence to the Government
In the last decade or two, Big Data and Artificial Intelligence(AI), these two words have been widely used in every industry. The tremendous success in information and com- munication technology in recent years accelerated innovations and the growth of ”new economy”. To keep up with this global trend, the government has huge investment in de- velopment of the new technology. Realistically, if a project is related to either Big Data or AI, it will get more funding today. It might seem a little absurd since government agencies
believed that entitled projects these two popular words appearing for catching up with the latest technology. Environmental studies are no exception. Do government agencies re- ally know what is the benefit of applying these new technology? Is this kind of technology suitable for environmental researches? To my knowledge, both answers are NO.
Government employees in environmental related departments are usually familiar with sample collection works and numerical modelings. They only have basic knowledge in data analytics such as descriptive statistics that is able to describe the basic feature of the data. Therefore, when the new technology has showed up, they only could rely on their imagination of new applications. It would cause huge waste with a smattering of knowledge. In addition, the fancy AI algorithms are not necessarily fit for environmental sciences. Most AI algorithms are associated with training and learning framework which only consider the relationship between input and output variables and ignore the underly- ing processes. This is a critical issue in environmental studies because of the environment activity is consist of a variety of physical and chemical processes. To understand these underlying processes could be the most important key in environmental sciences. Hence, it is urgent to think about how to find a new way that to apply new technology but not lose the meaningful physical characteristics.
1.4 The Myth of Uncertainty in Environmental Risk Com- munication
It is a scientists nature that have a sense of limitations and uncertainty in a research no matter is deterministic or stochastic study. Environmental scientists are able to clarify uncertainties including possible sources. Being a scientific researcher, I always thought a research work could be defended successfully in terms of specifically explaining the limitations and uncertainty until I have participated and experienced in some discussions with local communities. I found out that the concept of uncertainty is vague to citizens and they even do not care about what it means. Due to environmental sciences are likely to have close connection to risk assessment, this issue can be referred to be part of risk
communication. Uncertainty information is one of many aspects of risk communication and it is getting more and more important in this new data era. In the era of Big Data, data generation process has been changed, e.g., the development of low-cost sensors, it has huge impact on risk awareness and response, especially in environmental measurements.
Today there are a lots of affordable commercial devices on the market and people can easily use the devices with wireless networking to monitor the environmental quality they concerned about anywhere anytime. Therefore, risk awareness and sensitivity are highly dependent on numbers showing on device panels. Without the concept of uncertainty, a number is exactly a number not an interval or probability. Even though fast response and inexpensive of these new devices help significant increment in space-time resolution of environmental monitoring, the existing data quality issue of these low-cost sensors could be a misleading in risk awareness or communication.
In addition to measurement itself, there is a responsibility issue caused by the differ- ence of viewpoints from scientific fields. From the point of view of computer science or information technology(IT), the quantity which measured by sensors is a matter of ob- jective and impartial. ”Let data speak for itself” is often used to describe this situation.
Although many experts and organizations have made corrections to this fault notion, I still see lots of IT people shows the irresponsibility to not concern about what information they have published. On the opposite side, environmental sciences emphasize the meaning be- hind the measurement numbers. Environmental scientists are afraid of reporting a result that can not be explained, therefore, they are very carefully using this new kind of mea- surements. However, this act would be considered conservative and go in the opposite direction of Big Data.
I have attended to a conference in Taiwan about applications of new IoT technologies on environmental monitoring. In the conference, scientists from computer science and environmental science were against each other. The major argument was the reliability problem of new environmental monitoring technology and equipments. In my opinion, clear and effective communications could reduce public worry and stress that take more responsibility for the society. The problem we have to think about is how to become a
Figure 1.1: The triangle relationship between government agencies, environmental sci- entists, and public society.
truly neutral environmental information provider. Not only provide the numbers but also its representations or sciences would become a protective umbrella.
1.5 Ideal-Practice Gap in Environmental Sciences with Data Analysis
On my mind, the gap of ideally and practical environmental data analysis is formed by a triangle relationship based upon accountability and responsibility. The triangle rela- tionship is constructed by three characters including government agencies, environmental scientists, and public society. All three characters have played against each other and held their own perspective to environmental information. The triangle relationship as shown in Figure1.1.
Government starts off the purpose of regulation and management that nature is re- garded as property. A duty of a government is to maintain a sustainable living environ-
ment which is called environmental governance. Government agencies in order to respond to the public expectation of providing a better living environment, they seek help from en- vironmental expertise by building environmental monitoring infrastructures and funding projects. Government can be as an environmental information provider in this relation- ship triangle; Citizen has the strongest conscious and willingness to pursue environmental protection. Accessibility of environmental information is the most concerning topic for local environmental related communities and associations. Citizen also need the help from experts for answering and supporting their questions, in further, asking government for en- hancement of environmental policies. Although citizen could collect data by themselves nowadays, lack of knowledge make them with restricted sense about environmental in- formation, e.g., they would questions about what factors caused bad air quality. In this relationship, citizen plays a role of information receiver; At last, environmental scientists could be both an information provider and receiver in this triangle. Environmental studies have their special characteristics representations. As a provider, environmental scientists could illustrate issues precisely with their expertise and raise environmental information values in advance. On the other hand, as a receiver, environmental scientists not just col- lect ”real” data, furthermore, they have social responsibility to gather environmental and social concerns.
This complex triangle structure create the gap between ideal and practice. The three roles are interfering with each other. On many occasions, one’s goal would be held back by the others. Battles inside the triangle even lead to the problem of moral responsibility.
As a environmentalist, it seems to me that the biggest difference between environmen- tal sciences and other scientific fields is that almost every research project is funded by government agencies. Due to this fact that the flexibility and energy of environmental re- searches somehow have been limited. The last section has mentioned that it is complicated to elucidate who is responsible for the reveal of environmental information. Unlike a rec- ommendation system in commercial applications. It is difficult and nearly no freedom of choice when environmental information has been published. The impact of environmental information is very huge to the public and wrong interpretation is even more harmful. At
this present time, no matter is Big Data or Open Data, it seems like a double-edged sword to environmental science to me. As an environmental scientist, it is worth to think about how to play a role and stay balanced inside this triangle. Environmental scientists not only can make contributions to the society with specific expertise but are responsible for the outcomes from the interpretation of environmental information.
Chapter 2
The Critical Aspects of Environmental Data Analysis in the Present
” 我們把希望寄託在另一個世界裡,
然後才能面對這殘破的生命。有誰 又為了別人而犧牲自己,我們又學 到了什麼生命的意義。”
那我懂你意思了 Iguband 《沒有人 在乎你在乎的事》
Big Data and Machine Learning have been the most popular and commonly used vo- cabularies in all research topics. From Google Trends which shows the frequency of a given term is entered into the search engine, the worldwide interest of these two vocabu- laries have showed dramatic increase in the last decade[41]. Based on these two concepts, a bunch of contemporary or new algorithms and technologies have been developed and applied in various fields. And this phenomenon resulted in changing and bringing applied sciences into a new era. Without exception, the environmental sciences also embrace the fashion and provide lots opportunities to the data analysts. However, there are some doubts and questions have emerged while environmental sciences is adapting to these innovative technologies. Due to human beings are living in the environment, environmental research topics mostly related to every kinds of risk assessments, for example, health risk, natural
hazard, and food safety etc. Therefore, it is a critical issue to clarify the possibilities and limitations of the new techs that are applying to the environmental sciences for the public.
In this chapter, first of all, the history of data analysis would be introduced and reviews the evolution of analytics techniques. Next, the concept of modern data and analytics such as large datasets an AIs would be explained to provide the shape of intelligent data analysis.
In further, conventional environmental sciences would be described to reveal how the importance of role modern data analytics have played and connected to the influence on risk assessment. Finally, the objectives of this dissertation would be issued.
2.1 From the past towards possible futures of data anal- ysis
While words or phrases that related to ”data analysis”, the first impression of audiences is that to obtain information from some observations. Intuitively, we would like to have meaningful results from the data we have collected. It is like treasure hunters are digging valuable things from a bunch of collections. But, the scientific point of view, data analysis is a much more complex field that involves a variety of professional research topics. The stages of data processing such as inspecting, cleaning, visualizing and modeling data etc.
are all considered as parts of data analysis. These techniques are developed to achieve a common goal: discovering and gathering useful information to produce a better outcome in decision-makings or business operations.
Even more than 50 years ago, a statistician, John W. Tukey had defined data analysis as
”procedures for analyzing data techniques for interpreting the results of such procedures, ways of planning the gathering of data to make its analysis easier, more precise or more accurate, and all the machinery and results of (mathematical) statistics which apply to analyzing data.”[93] He pointed out an as-yet unknown science which was different than neither mathematics nor statistics. It was still a vague idea at that time. Today, his sense has truly become a certain research field, which we have called as Data Science now.
In the beginning, data analysis was particularly applied to the need for business in-
telligence. The main purpose of business intelligence was to transform from raw data into meaningful information which was very crucial for business managements. How to make effective decisions, estimate profit margin, or create successful budget plan, these issues were important for a firm keeping competitive. And data analysis was the key to determine a firm’s managing strategies. In business intelligence, data analysis covered data collecting, data cleaning, exploratory data analysis, data modeling, and data commu- nication. It is worth mentioning that there were two main techniques of data modeling:
data mining and on-line analytical processing. The difference between data mining and on-line analytical processing is the driving force of algorithms that one is data-driven and the other is model-driven, respectively. Although on-line analytical processing could in- tegrate multiple data processing functions, the advantage of data mining is its ability of future predictions[103]. Data mining is a particular data analysis technique, which is con- sist of classification, association analysis, cluster analysis, and anomaly detection, focuses on predictive purpose rather than descriptive[8]. Nevertheless, these data analysis tech- niques have been developed and used for a long time and successfully accomplished the tasks whereas they mostly were utilized within organizations or scientific researches.
Until now, while the users are breaking out of the comfort zone and not limited to the specific field of study, we have seen the tremendous progress in the applications of Data Science.
2.2 Big Data and Machine Learning make a different fu- ture
After we have made the substantial progress in computer hardware industry, the technolo- gies are no longer just focus on one specific research field. They are pursuing for wider and sophisticated applications to generate extra revenue from the data. The notable ex- ample is the rise of social media analytics. This phenomenon not only changes the way people connected and content shared, but give Data Science a perfect experimental field in Big Data. It is well known that Big Data has the four V’s, which are Volume, Velocity,
Figure 2.1: The four V’s explanation of Big Data by IBM scientists[32].
Variety, and Veracity to describe its specificity. IBM Corp. breaks these four V’s and has clear explanation by an inforgraphic, as shown in Figure 2.1. Based on these properties, data is not the biggest issue for organizations or scientists. The challenge will become finding the highest-value opportunities, using new technologies and tools to carry out an- alytics, gaining the benefit, and planning for the future[85]. This data-driven concept even offerers new energetic power to the past developed algorithms such as we can obtain more detailed information by simple data visualization under a large dataset.
AI usually is stated along with Big Data, however, AI is not a brand new technology.
In general, in contrast to the natural intelligence which means determined by human, AI can be seen as intelligence is demonstrated by machinery agents. In 1950, Alan Turing an- nounced the famed Turing Test in computer science[94] and triggered off thoughts waves of using machines to ”learning” and ”problem solving”. People believe that AI could make the society more efficient no matter in manufacturing or decision-making. After more than 60 years, numerous algorithms and tools are related to AI nowadays such as search and mathematical optimization and artificial neural network. Machine Learning or Deep Learning is the most popular word in terms of AI in recent times. According to
theses modern AI techniques, a astonishing machine, AlphaGo, was created to the world in 2015 and became one of the most breakthrough a year later that the first time a computer beat a professional human Go player[84]. This case illustrates the core and capability of Big Data and Machine Learning that an efficient machine can predict accurately given a large enough training data.
2.3 Reviews of Environmental data analyzing methods and applications
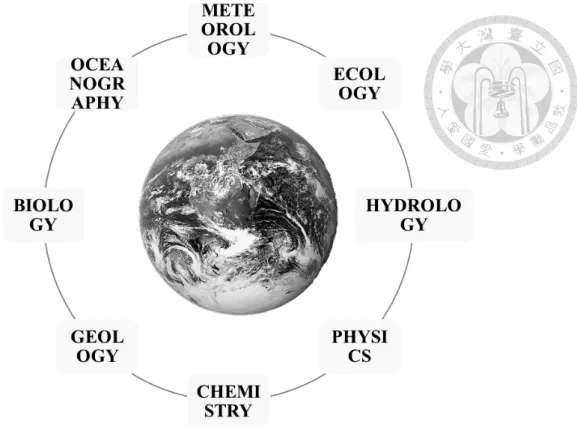
Environmental data analysis is a specific research field in data analysis that is applied collected data from the environment to a variety of demands. Environmental sciences is consist of many branches of sciences inside including meteorology, ecology, hydrology, physics, chemistry, geology and biology etc.. It is simple to look at environmental data analysis in space and time that could obtain three different environmental analytics: spatial analysis and temporal analysis, and spatiotemporal analysis.
Because of environmental data analysis also attends to discover useful information from the data as other data analytics fields, most of statistical models have been applied.
For temporal analysis, methods for time series analysis could be used including frequency- domain methods and time-domain methods. Frequency-domain methods are such as spec- tral analysis and wavelet analysis, e.g., Fourier analysis[87]. Time-domain methods, for example, autoregression(AR), autoregressive integrated moving average(ARIMA) are com- monly used in building models[44]. For spatial analysis, several regression techniques were developed for environmental analysis, e.g., land use regression[50] and geographi- cal weighted regression[98].
Major environmental data collection is from well-established monitoring stations or sampling by researchers themselves. Data abundance is highly depending on the sampling difficulty and cost. The situation results in both limited spatial and temporal resolution of environmental data. For the reason, several spatial interpolation techniques or geostatis- tics were arose from the purpose of assessing the environmental information at unknown
locations. The most famous and widely used one is Gaussian process regression as known as Kriging method[60, 23]. Otherwise, since the environment is regarded as a public as- set, the most environmental data and projects are founded by government agencies. This circumstance caused the environmental researches are either limited by data abundance or accessibility. Formerly in Taiwan, the accessibility of environment data somehow is relatively restricted by the government. Only could be reached by scientific research pur- poses or government projects. Hence, environmental data analysis was not received too much attention within citizens and communities.
However, the concept of Open Data and Open Government has changed the situation at present. In addition, the rapid growth in Internet technologies also raised environmental data analysis to another level.
2.4 Exposure assessment and risk communication in con- nection with environmental data analysis
Risk analysis contains various phases and will varies among different kinds of risk assess- ment. Due to the special characteristics of environmental data, the study will focus on two particular phases of risk assessment that are called exposure assessment and risk commu- nication. As mentioned, environmental information is a public asset that citizens should have the right to access the information freely. The importance of knowing the environ- ment conditions is the main idea of exposure assessment. Environmental sciences has played an essential role in exposure assessment because it is an interdisciplinary research field and also needs cross-disciplinary knowledges. Environmental sciences can integrate multiple scientific fields to the study such as meteorology, chemistry, ecology, hydrol- ogy, and biology etc. as show in Figure 2.2. Similarly, environmental data analysis is a valuable tool in exposure assessment, like geostatistics which is described in the previous section, that is mainly used to estimate environmental exposures. Estimation of environ- mental exposures here can have a wide range of applications such as typhoon forecast, air quality forecast, water quality assessment, and food security assessment etc.. These
Figure 2.2: Environmental sciences is an interdisciplinary study field.
estimations are highly related to vulnerability, disease burden or adverse health impact, in other words, that is the term we called risk.
However, limitations and uncertainty are always existing in sciences and technolo- gies. Although modern sciences have made significant progress comparing to hundreds or thousands years ago, there are still a lots of unknown things to discover. Especially in environmental studies, it is impossible to fully simulate a real world. Each research study could only provide a tiny piece of the whole world even without a 100% correct answer. That is why environmental scientific studies have to illustrate either limitation or uncertainty very clear. The most concern, in reality, is that if the scientific results are used for the purpose of increasing public risk awareness, the uncertainty of results might cause different risk perception to public. This is a crucial issue for environmental scientists be- cause it is impossible to ignore and dismiss all uncertainty of research studies. Hence, we need shift our focus from providing the true answer to communicating under uncertainty.
There is a specific field in risk analysis called risk communication. The purpose of risk communication is that scientists or experts intentionally conveying their risk information
to a targeted audience through designated channels[7]. Targeted audiences includes non- experts, the general public, interest groups or regulatory practitioners. After decades in development of risk communication, trust has become a vital aspect of improving risk communication nowadays. It is critical to make persuasive communications about risk information to audiences with the limits of knowledge improving risk awareness and ac- ceptance[64, 12]. Environmental sciences are associated with healtth risks, environmental hazards studies. In other words, environmental data analysis has deeply involved in expo- sure assessment of risk analysis. The results of environmental data analysis should take the communication techniques into consideration in further.
2.5 A new era of environmental data analysis from the perspective on risk assessment
Today’s world is facing a sharing economy also known as collaborative consumption. The tremendous progress made in computing capability in recent years has given huge support to the trend. This sharing trend also delivers a noticeable impact on the growth of Open Data and Open Government. Nevertheless, these two concepts are often mixed together as ”open government data”. Harlan Yu and David G. Robinson pointed out the distinction between Open Data and Open Government. The concept of Open Government focuses on increasing a government with more transparency, participation, and collaboration which also means the goal is to enhance civic and political accountability for public. On the other hand, Open Data can be referred as any open technology that makes public information more adaptable and provides new aspects of civic life. Although technologies can em- power the public data value, it will not resolve the situation for political and managerial accountability for government alone[106].
To my mind, the combination of Open Data and Open Government provides a per- fect opportunity for the environmental data analysis field in Taiwan. There is an idiom in English, ”You scratch my back and I’ll scratch yours.”, ideally describes the relationship between environmental data and Taiwan’s government agencies. Previously, environmen-
tal data were only used for the monitoring environmental quality purpose. Due to, at the moment, most of environmental data were inaccessible to the public, a lots doubts of mea- surements accuracy were arose between citizen and communities. Following the concepts of Open Data and Open Government, the government can overcome these doubts by shar- ing the environmental information and the public can contribute with new aspects to the government. In further, to enhance government accountability.
The concept of Internet of Things (IoT) has grown rapidly in the recent decade. There are various IoT applications have been developed now or in near future[42]. One es- sential key of IoT paradigm is the wireless sensor networks (WSN) that beneath the fast development of Internet. Accordingly, the IoT has brought a new era of environmental monitoring to build a smart city. Low cost and great mobility are the two most attractive features of IoT equipments. Big Data and IoT are working well together that Big Data analytics can empower IoT to generate valuable information. It seems could be a solu- tion to the dilemma of lack of environmental data. However, while using IoT devices for environmental monitoring, there is a serious issue has emerged and should be carefully considered, reliability.
Here we are focusing on uncertainty of IoT device measurement, in other words, data quality is essential to environmental data analytics. Environmentalists have forged to answer about how the planet works through a variety of scientific researches. Mean- while, their research outcomes have made a great contribution to the society that seeks for risk avoidance or risk reduction. Environmental sciences have been played an important role in whether health risk assessment or natural hazard assessment. Data quality issues have huge impact on risk assessment that uncertain measurements could cause public risk awareness to be misleading. It not only affects social aspects but have a great influence on policymaking and management in further. Hence, Veracity of Big Data has invoked cau- tious on use of new type of environmental data and the importance of risk communication to the public.
There were many innovative applications have shown the capability of technology in the new era. Google Flu Trends is one of the most impressive example that discovered
a whole world of valuable Big Data. Google scientists announced that they could pre- dict accurately flu prevalence two weeks earlier based on flu tracking information from the Centers for Disease Control and Prevention and flu-related information on Google search engine[39]. However, it failed on flu prevalence estimation few years later and other researchers deconstructed the failure[62]. This case shows Big Data still display great potential on environmental analysis but some keys are missing. Mostly, data-driven modeling and techniques are searching for statistical relationship like correlation and de- pendency. For instance, a huge amount of Machine Learning algorithms are considered as black box models which means the models determine the relationship between input and output variables without thinking about underlying physical processes. This framework caused hard to be convinced in risk communication. For environmental scientists, deci- sion makers, and government agencies, it is questionable and difficult to realize a natural system just based upon statistical relationships because of ”correlation is not causality”.
In my opinion, causality is the breaking point of environmental data analysis in the era of Big Data. Previously, economists have proposed that causality could be learned and then inference[6]. Besides, another straightforward way in environmental sciences to address this problem is through integration of statistical and physical models called data assimilation or data fusion techniques. Within this framework, physical laws and other governor equations of numerical models become constraints in statistical modeling. On the other hand, features or patterns found by statistical models could improve the perfor- mance of parameters estimation as general knowledges in numerical models. Hence, these approaches could be expected to create a win-win situation and produce more persuasive research results.
Chapter 3
Objectives of the Dissertation
” 你是追尋玫瑰的獨角獸,強忍淚 水體會成長,時不時的替你擔憂。
露水的營養,朝陽的變化,迷霧的 溫度,山嵐和彩霞。”
告五人 Accusefive《獨角獸》
From Chapter 1 (my personal experiences in environmental data analysis) and Chapter 2 (my thinking and vision as an environmental data scientist), in my mind, environmental sciences in this new data era are not just scientific but more close to philosophical sub- jects. As mentioned, due to the specificity of the environment-related issues, there are three important characters have participated and formed a triangle relationship including governments, scientists, and citizens, that all characters interact with each other. There are different positive and negative effects between their relationships. Moreover, while Big Data and AI have revolutionized environmental data analytics, everyone wants to seize the opportunity to keep up with these hot trends. Thus, the measurements of environmen- tal monitoring have become the most valuable resources for environmental data analysis.
Environmental data analysis has become a complex topic. In the next three Chapters, this dissertation will use three applications of environmental data analysis to answer three questions as follows.
Along with Open data and Open government trends in Taiwan, environmental infor-
mation which had seen as governmental property that have been largely released recently.
This result initiates the first question: ”How do we use these environmental data based on the open concept?”.
• In Chapter 4, a spatiotempoal early warning system of Dengue fever will be intro- duced to illustrate the benefit of environmental information opening and show the great predictability that uses the combination of epidemiology and meteorology to forecast the incidences diffusion.
After the rapidly growing in IoT industry, now people can easily used low-cost sensors to monitor the environment. There are numerous commercial devices on the market can choose and have generated a large amount of environmental measurements. Here comes the second question: ”How to quantify the reliability of low-cost sensors measurements?”.
• In Chapter 5, a spatiotemporal calibration approach for low-cost PM2.5sensors will be introduced to point out the existence of low-cost sensor measurement bias and discuss the bias affects public risk perception from air pollution.
Due to the evolution of environmental monitoring, certain and uncertain measurements are existing at the same time. Under the consideration of different kinds of uncertainty and value representation in these two data types, there is the third question: ”How to integrate multiple data sources with different uncertainty?”.
• In Chapter 6, a high performance data fusion technique will be introduced to exhibit the integration of regulatory stations and low-cost sensors PM2.5measurements and focus on the visualization of air pollution mapping which is strongly related to issues of risk communication.
Chapter 4
A Spatiotemporal Dengue Fever Early Warning Model Accounting for
Nonlinear Associations with
Hydrological Factors: a Bayesian Maximum Entropy Approach
(Published in Stochastic Environmental Research and Risk Assessment, 2016[108])
”But I say you’ll see, I’d make you see. Every detail of this damned life. I say you’ll see, I’d make you see. You’ll see。”
Tizzy Bac 《You’ll See》
In the last decade, governments around the world have made great efforts to create Open Government Data (OGD). Either to improve administrative transparency or enhance citizen participation. It is an unstoppable trend that governments provide their data as- sets and empower the public to boost government expenditure data through cross domain knowledge integration, innovative algorithms and enormous computing power into this
new epoch. As a result, governments would benefit from new features of applications and give better decision-making quality; the public and personal could have better understand and monitor the government operations.
In spite of finance, environmental monitoring is the most closely governmental data related to citizen. Accompany with environmental awareness grew rapidly in the second half of the 21th century, people have paid more attention to the quality of where they are living with such as water quality, air pollution, infectious disease and food safety. Envi- ronmental open data shows one of the greatest potential opportunities for advanced data science applications. As mentioned, environmental awareness can be also recognized as risk awareness of livings. Environmental data usually is used for exposure assessment in risk assessment which to evaluate and quantify hazard intensity. Scientists could take advantage of a variety of environmental variables and find out the relationships between them. In addition to the large data volume, one special property of environmental monitor- ing is to support environmental information in near real-time observations. With real-time data, the analytics can easily transition from historical analyzing to forecasting modeling.
In epidemiology, for the purpose of diseases prevention and control, researchers are always concerned about predicting the pattern of infectious diseases. It is an apparent ap- plication that is performed with both historical and real-time data. Typically, the public was difficult to obtain incidence datasets in Taiwan. However, in recent times, Taiwan government’s open data platform has changed the circumstance that citizen can easily ac- cess the database now. Here we will use dengue fever as an example of the potential environmental open data analysis. In this chapter, it will introduce an early warning sys- tem of dengue fever that integrates a distributed lagged nonlinear model with geostatiscal approach based on open datasets to illustrate the importance and influence of open gov- ernment data.
4.1 The relationship between dengue fever and meteorol- ogy
Dengue fever (DF) has been recognized as one of the most important international epi- demic concern in recent decades. It is a mosquito-borne viral infection that is found in tropical and sub-tropical climates regions around the world. DF can lead to headache, nausea, vomiting, and joint pains, and its severe form, i.e. dengue hemorrhagic fever, is a leading cause of death and serious illness among children in some Asian countries[99].
Dengue incidences have grown dramatically in the past years. Over 40% of the world’s population is now at risk from dengue and about 50–100 million people are infected by dengue worldwide annually. Dengue viruses are primarily transmitted through the bite of infected mosquito vector Aedes aegypti in urban and suburban areas. At present, there is no vaccine and specific treatment for dengue fever. The most effective prevention and control are to take anti-mosquito measures by environmental management (e.g., remov- ing artificial habitats and emptying water containers routinely). Thus, establishing a DF early warning system (EWS) to predict the DF occurrences across space and time with a sufficient lead-time is urgently needed for the preventive or control purposes.
In general, previous studies have found significant relationship between the spatial or spatio-temporal epidemic spreading patterns of DF and hydrological-related factors[11, 102, 109, 16, 15]. Among them, temperature plays a substantial role in the development of mosquitoes. It’s not only influence on the proportion of infective population but sur- vival of the vector including hatching rate, size of larvae or mortality[104, 105]. Nonlinear associations can exist between temperature and vector development in that temperature in- crease can be positively or negatively associated with the development of mosquitoes at different temperature ranges[73, 76]. Precipitation is the key of eggs and larval develop- ment[65, 77, 86]. Although heavy rainfall can destroy the habitats of mosquitoes, precipi- tation is supplying the vector with suitable breeding environments like pools, water-filled container and other aquatic habitats. However, the transmission of the infectious diseases across space and time is a complex interactive process including participation of human
hosts, the virus serotype, and environmental factors. An epidemic disease outbreak must consist of three elements, human host, existence of virus, and environmental condition, which can change across space and time; nevertheless, it is a challenge to characterize all factors.
4.2 Early warning system modeling for dengue fever in- cidences
For the purposes of disaster preparedness and emergence response, EWS development has become an emerging practice for infectious diseases control in recent decade. A disease EWS can provide crucial information for public health enabling to take actions on preventing and mitigating the impact of potential diseases outbreak. Development of disease EWS has been become an important strategy for the disease prevention and mitigation by investigating the statistical associations between environmental conditions and disease incidences. In the case of DF disease, numerous studies have applied a va- riety of statistical models, e.g., generalized linear model, Poisson regression and mixed model[22, 67, 68, 109, 46], to investigate the relationships between the time series of hydrological factors and DF incidences for the purposes of disease prediction or EWS de- velopment, e.g. time lag effects[47, 48, 101, 27]. The identification of this temporal rela- tionship, i.e., time lag effects, is challenging due to the high autocorrelation in the time se- ries of both hydrological and disease data. Recent studies have applied the distributed lag model (DLM) and its variant, i.e. distributed lag nonlinear model (DLNM), to identify the lagged relationships and mitigate the multi-collinear issues[111, 80, 89, 27]. In addition to the understanding the statistical association between hydrological related factors and DF incidences, disease diffusion also plays an important role in spatiotemporal distribution of disease incidences. The disease diffusion is primarily dominated by population dynamics, e.g. the population movement, and the interactions between the populations of human and vectors. Many epidemiological models have been proposed to characterize the diffusion of infectious diseases, including gravity, point process, spatial micro-simulation, network-
based models, and susceptible-infected-recovered model[34, 9, 79, 78, 33, 29, 46]; how- ever, most of these models require the estimation of extensive parameters which are com- monly unknown due to the limited knowledge of the disease spread. Geostatistical meth- ods, e.g., Kriging and Bayesian maximum entropy (BME) methods, have been shown to be a proper surrogate approach for the modeling of system dynamics with high com- plexity in parameters, and was used to characterize the space–time patterns of disease diffusion[82, 81, 109, 5, 53]. Despite of all these approaches in disease modeling, the studies integrating both disease dynamics and associations with external forcing are still limited[72]. Yu et al.[109] considered both disease dynamics and external forcing for spa- tiotemporal modeling with assumption of the linearity between the hydrological changes and logarithm of DF risks, in which multicollinearity among hydro-climatic predictors were shown.
In order to develop an EWS for the 1-week-ahead prediction of spatiotemporal disease spread of dengue fever, this study proposed an integration of DLNM and an epistemic- based geostatistical approach, i.e. BME method, to account for both disease dynamics and hydrological influence to the spatiotemporal distribution of DF incidences, and to mitigate the multicollinearity issues among the space–time dataset. Among them, DLNM is used to reveal the space–time lagged relationships between hydrological and dengue fever processes, and BME is used to characterize the spatiotemporal DF diffusion with considering the data uncertainties. We applied our approach to assess the dengue fever epidemics across space and time in southern Taiwan for the period of 1998–2012.
4.3 Dengue fever in southern Taiwan
This study investigated the DF incidence cases in the major epicenter of dengue fever in Taiwan, i.e. tropical and south part of Taiwan including Tainan City, Kaohsiung City, and Pingtung County. The annual incidence in the study area is very high; the number of DF cases in southern Taiwan constituted over 94 % of the total number of cases in entire Taiwan during the past decades. In this study, the DF observations of southern Taiwan are based on surveillance data obtained from the Taiwan Center of Disease Control during
the period of 1998–2012. The DF dataset consists of confirmed incidences (number of reported cases) sorted into the temporal and spatial scales of week and district (an admin- istrative unit), respectively. According to the standard surveillance procedure in Taiwan, every suspected DF case should be reported to medical laboratories for the confirmation within 24 h from its diagnosis by clinics or hospitals. In general, the reported DF cases should take about 1–3 days to be confirmed in our study area. About 63 % reported cases were confirmed to be positive. On the other hand, surveying showed that only 83 % sus- pected cases were reported[52]. Figure 4.1 shows the averaged annual DF cases across the study area. Figure 4.2 shows the weekly-based temporal variation of total recorded of DF cases during the study period as well as those of associated hydrological factors, i.e.
the averaged temperature, the maximum temperature, the minimum temperature, the total rainfall, the maximum 24-h rainfall, and the maximum 1-h rainfall. These hydrological data were collected from the monitoring stations of Taiwan Central Weather Bureau. An inverse distance weighting method was used to estimate weekly hydrological measure- ments for each district, i.e., estimations at the centroids of the districts[35], due to the comprehensive spatial coverage of the monitoring stations, shown in Figure 4.1.
4.4 Spatiotemporal DF prediction
4.4.1 BME method
BME method is a geostatistical approach based upon an epistemic framework. It considers the space–time distribution of DF incidences as a spatiotemporal random field (S/TRF), in which Z(p), p = (s, t), represents DF cases in the study area, where the vector s and t denotes the location (township) and the observed time of dengue incidences by calendar week, respectively. The BME approach distinguishes two major knowledge bases (KB) for the spatiotemporal modeling:
(a) Core or general knowledge base (G-KB) that can include all knowledge bases of natural characteristics, which can be scientific laws, empirical relationships, and theoretical space–time dependence models.
Figure 4.1: Map of the study area, which includes averaged annual DF cases of 107 districts in southern Taiwan, and the location of weather stations.
Figure 4.2: Trend plot of (a) weekly total dengue fever cases and temperature measures.
Dengue fever cases(black); Average temperature(red); Minimum temperature(green);
Maximum temperature(blue), and (b) weekly total dengue fever cases and rainfall mea- sures. Dengue fever cases(black); Average rainfall(read); 1-hr maximum cumulative rain- fall(green); 24-hr maximum cumulative rainfall(blue).
(b) Site-specific or specificity knowledge (S- KB) that includes all knowledge bases (e.g., observations) that are specific to the region of interest and further split up into: hard data (i.e. exhibiting a satisfactory level of accuracy), and soft data that represent uncertainty in the measurements (including secondary information, im- perfect observations, categorical data, and fuzzy inputs).
The BME method integrates the both knowledge bases, i.e. K = G∪S, for the spatiotem- poral estimation by the equations as follows[19, 21]
∫ dχ(g− ¯geµTg) = 0
∫ dχξSeµTg− AfK = 0
(4.1)
where χ denotes space–time realizations of the dengue fever incidence distribution, g is a vector of gα-functions (α = 1, 2, . . .) that represents stochastically the G-KB under consideration (the bar denotes statistical expectation), µ is a vector of µα-coefficients that depends on the space–time coordinates and is associated while also g (i.e., the µα ex- press the relative significance of each gα-function in the composite solution sought), the ξS represents the S-KB available, A is a normalization parameter, and fK is the disease probability density function at each space–time point (the subscript K means that fK is based on the blending of the core and site-specific KB). The g and ξSare the inputs in Eq.
(4.1), whereas the unknown are the µ and fK across space–time. In this study, the G-KB considers the space–time empirical relationships between the hydrological factors and DF incidences, which were analyzed by the DLNM method, and the space–time depen- dence among the disease incidences by using a spatiotemporal dependence function. The S-KB incorporates the DF observations with considering their associated uncertainties.
The details will be described below.
4.4.2 Spatiotemporal DF modeling
The space–time spread of dengue fever epidemics can be influenced by a variety of cli- matic and non-climatic factors. This study characterizes the space–time variation of

![Figure 2.1: The four V’s explanation of Big Data by IBM scientists[32].](https://thumb-ap.123doks.com/thumbv2/9libinfo/9597595.628250/36.892.135.782.87.475/figure-v-s-explanation-big-data-ibm-scientists.webp)