國立臺灣大學與中央研究院合辦 基因體與系統生物學碩士學位學程
碩士論文
Genome and Systems Biology Degree Program,
National Taiwan University and Academia Sinica Master Thesis
DynaPho: 由磷酸化蛋白質體資料推論動態化生物訊息 DynaPho: inferring signaling dynamics from
phosphoproteomics data
王建凱 Jian-Kai Wang
指導老師:阮雪芬 博士 Adviser: Hsueh-Fen Juan, Ph. D.
指導老師:歐陽彥正 博士 Adviser: Yen-Jen Oyang, Ph. D.
中華民國 104 年 7 月
July, 2015
ii
口試委員會審定書
iii
致謝
碩班生兩年的日子即將邁入尾聲,回首一看,進入實驗室也像是不久前的事,感謝阮雪 芬老師在我剛進入 GSB 學程時,讓我加入這個大家庭,遇到許多優秀的學長與一起奮 鬥的同學,也讓我在資源充足的環境下成長許多。感謝黃宣誠老師,老師的思考模式與 對學生的用心與耐心,讓我體會到一個優秀的學者應該具備的素養。感謝許家郎學長,
實在幸運能在加入實驗室後,能在學長的指導下完成本專題與研究,學長時常提出許多 應該注意的細節與良好的建議,才能讓這份研究專題具有深度與廣度,雖然兩年的時間 不長,但我也從學長的引導下學習到許多關於分析生物資料的方法與架構,實在感謝學 長的教導。謝謝黃振綜學長,是一位能分析事物透徹且自我要求甚多的學長,可能同在 類似的領域成長過,不僅在學界、產業界的資訊我們都能時常交換意見,學長對於許多 事鞭辟入理的批判,確實也給我不少新的想法。感謝我的同期同學們,謝謝昭胤、子霆、
士傑、瑋庭與曉婷,這段研究生的同甘共苦確實讓我們都比大學時期來的更加堅毅,對 於我們心中的許多夢想也有了更真實與現實的規劃,很感謝有你們的相伴,讓我的碩士 生活過的雖勞累但也快樂,也謝謝你們大家對於我的忍耐與照顧。對於逵悅,從一開始 GSB 百人教授中能選在同一實驗室就足以說明我們的緣分,儘管學界著實有不少的障礙 要去跨過,相信並祝福你能完成自己的目標,也謝謝你這兩年的照顧。對於凱普,一位 願意對自己的命運奮鬥的勇士,你的認真與開朗常是我相當敬佩的對象,儘管自己身體 的不足,但仍努力地往前大步邁進,無畏地接受挑戰,是我打從心底尊敬的對象,祝福 你的人生規劃能一切順心與順利。學妹允芃,雖然時常聽到妳對於研究的不安,但未雨 綢繆也未必不好,面對新領域的挑戰,除了需要更多的努力外,也需要相對的自信心,
要相信自己能夠有足夠的毅力與耐心來克服,相信妳可以做得很好。對於新進的碩一學 弟妹們,直到碩班畢業才會有許多感觸,回首兩年來的日子,有苦、有累、但也有收穫 與屬於自己的成長,永遠不要設限自己,相信你們大家都能有許多的收益,不僅是在研 究成果,更是在心裡的建設與成熟,也願大家在未來研究上、工作上一切順利。
iv
CONTENT
口試委員會審定書... ii
致謝... iii
CONTENT ... iv
FIGUREURE CONTENT ... vi
TABLE CONTENT ... vii
摘要... viii
ABSTRACT ... ix
CHAPTER 1 INTRODUCTION ... 1
CHAPTER 2 MATERIALS AND METHODS ... 4
2.1 Position in analyzing MS data ... 4
2.2 Input data format ... 4
2.3 Phosphosites among six stages of cell cycle in HeLa cell as a case study ... 4
2.4 Collect databases ... 5
2.5 Architecture and Sequential analyzing flowchart ... 5
2.6 Filter and Fill data in data preprocessing ... 6
2.7 Workflow and methods in basic statistics module ... 8
2.8 Workflow and methods in profile clustering module ... 8
2.9 Workflow and methods in function annotation module ... 11
2.10 Workflow and methods in kinase activation profile module ... 12
2.11 Workflow and methods in interaction network module ... 14
v
2.12 DynaPho implementation ... 15
CHAPTER 3 RESULTS ... 17
3.1 Data quality status monitors changes over the cell cycle ... 17
3.2 Dynamic phosphorylation profiles reveal unified biological information ... 17
3.3 Cellular signaling in temporal function profiles ... 19
3.4 Regulated phosphoproteome by potential kinases ... 20
3.5 Phosphorylation signaling in cell cycle by protein interaction network ... 21
CHAPTER 4 DISCUSSION ... 23
CHAPTER 5 CONCLUSIONS ... 25
REFERENCES ... 26
FIGURES ... 31
TABLES ... 64
APPENDIX ... 70
vi
FIGUREURE CONTENT
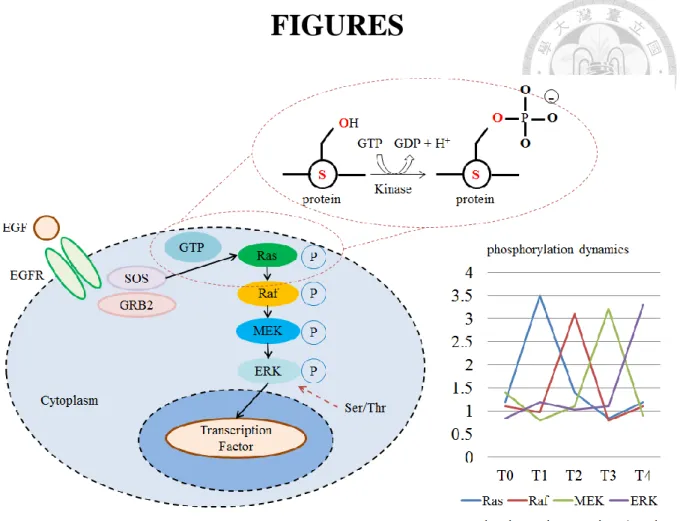
Figure 1 Dynamic signaling represents what conditions the cell had undergone. ... 31
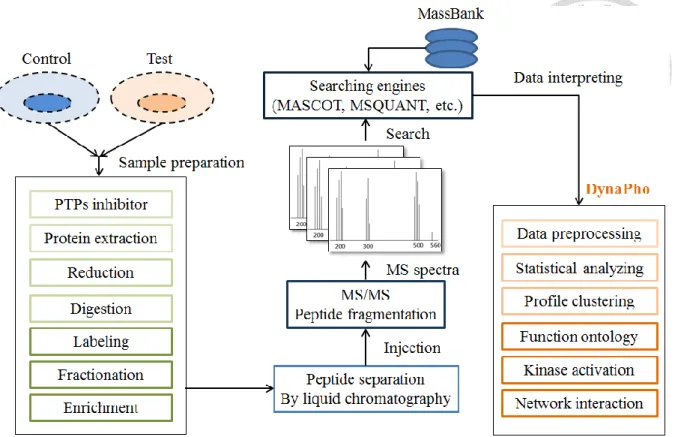
Figure 2 DynaPho interprets biological information on the downstream of analyzing. ... 32
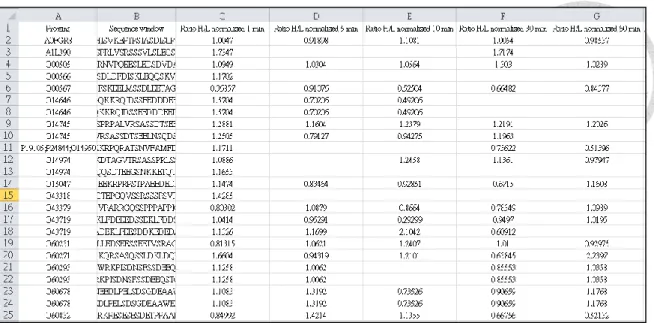
Figure 3 The basic format of the upload file ... 33
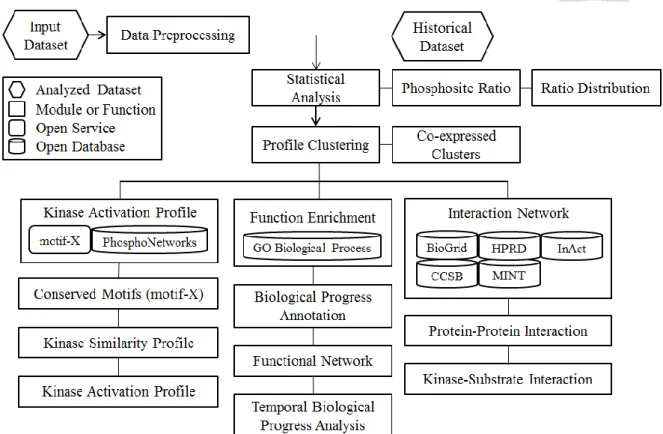
Figure 4 The architecture and workflow of Dyanpho ... 34
Figure 5 The analyzing flow of statistics module ... 35
Figure 6 The analyzing flow of profile clustering module ... 36
Figure 7 The example of auto detection method for determining clustering number... 37
Figure 8 The analyzing flow of function enrichment module ... 38
Figure 9 The analyzing flow of kinase activation profile module ... 39
Figure 10 The example of generating the PSSM table of each conserved motifs ... 40
Figure 11 The analyzing flow of interaction network module ... 41
Figure 12 The number and proportion of each phosphorylation sites ... 42
Figure 13 The distribution of all labeling ratios in log2 scaled ... 43
Figure 14 Co-expression clustering of dynamic phosphorylation profiles ... 47
Figure 15 The summary of core functions over all cell cycle stages ... 48
Figure 16 Function enrichment analyses on the temporal profile... 55
Figure 17 The temporal profile of biological processes ... 57
Figure 18 Conserved motifs imply potential kinases ... 58
Figure 19 Dynamics to both kinase activation and deactivation time profiles ... 60
Figure 20 Biological signaling presented by the protein-protein interaction network ... 63
vii
TABLE CONTENT
Table 1 Analysis customization input parameters and their default values. ... 64
Table 2 Public databases integrated in Dyanpho ... 65
Table 3 Conserved motifs from motif-x services ... 66
Table 4 Detailed biological processes with their adjusted p-values on all stages ... 67
Table 5 Detailed composition of DynaPho ... 69
viii
摘要
細胞中蛋白質的磷酸化不僅調控許多生理生化反應,更在許多病理狀況中扮演關鍵角色。
近年來,研究磷酸蛋白質體技術的躍昇,例如製造更高精確辨析的質譜儀及發掘磷酸化 胜肽鍊的技術提升,足夠研究能以磷酸化胺基酸位置為主的磷酸蛋白質體。透過許多改 良的技術產生大量磷酸化蛋白體的數據便急需一個更新或精進的計算方法或分析流程 將這些大量數據轉成可理解並有價值的資訊。DynaPho 為一個以網頁操作為基礎的分 析工具,透過多種演算法分析磷酸化資料和包含磷酸化位點的序列,並整合各種資料庫 註解及解析磷酸訊號的動態變化。DynaPho 的組成為一個前處理模組與五個分析模組,
包含 (1) 敘述性統計分析;(2) 磷酸化數據分群分析;(3) 趨勢性、時間性功能豐富性 分析;(4) 磷酸酵素活化時間分析;(5) 蛋白質交互作用的網路分析。我們透過分析人 類子宮頸癌細胞在細胞週期各階段的磷酸蛋白質體巨量資料來說明 DynaPho 的分析 功能與流程。透過分析磷酸化的胺基酸序列,不僅找出細胞週期中關鍵的 CDK 家族,
更進一步分析出酵素活化的時間變化表,如 CDK1,在第一階段成長期、合成期與第 二階段成長期有活化的現象。透過蛋白質交互網路更可以綜觀細胞在細胞週期中的連續 性訊息的傳遞,如 RanBP2-ErbB2 的傳遞路徑等。因為 DynaPho 可運用於分析磷酸化 蛋白質體動態訊息的變化,能使我們更加瞭解複雜的生物系統。DynaPho 可以透過網址 http://dynapho.hchuang.info/ 免費地連結使用。
ix
ABSTRACT
Protein regulatory phosphorylation controls normal and pathophysiological signaling activities in cell. Recently, great advances in phosphorproteomics, including high-accuracy mass spectrometry (MS) and phosphopeptide-enrichment techniques, have allowed identifying site-specific phosphorylation. Development of computational analysis methods is required to transform large-scaled phosphoproteome data into valuable information of biological relevance. DynaPho is a web-based tool for analyzing temporal phosphoproteomes.
It combines several algorithms to analyze the phosphorylation profiles as well as sequence-content of phosphosites and integrates various databases to annotate and uncover the dynamics of phosphosignaling. DynaPho consists of five major analysis modules: (1) description and summary of phosphoproteomics data; (2) clustering of phosphorylation profile; (3) temporal functional enrichment; (4) generation of kinase activation profile; and (5) temporal protein interaction network. We illustrate DynaPho via an analysis of massive phosphoproteomics dataset of cell cycle on HeLa cell. Based on the phosphorylation profiles, these data were divided into eight clusters corresponding to different cell cycle stages. The analysis of kinase activation profile revealed CDK family play a major role in cell cycle signaling. For instance, CDK1 is activated in G1, synthesis and G2 stage. The temporal protein interaction network discoveries RanBP2-ErbB2 signaling across mitosis and G1 stage.
DynaPho can reveal the dynamics of temporal phosphoproteomics data contributing to improved understanding of complexity of biological systems. DynaPho is freely available at http://dynapho.hchuang.info/.
1
CHAPTER 1 INTRODUCTION
Protein phosphorylation is one of the post-translation modifications of protein that is an important factor in cellular signaling systems. It is a transient reaction which temporarily alters protein activities or complex responses by the addition of a phosphate. Abnormal regulation of phosphorylation is related to disease formation and progression, including cancer. Several drugs have been invented to provide better ways in treatments by targeting protein phosphorylation, such as Fasudil and Icotinib [1-3]. Site of phosphorylation is crucial for protein function of its efficiency. For example, different phosphorylation sites in neuropeptide NPFF2 contributed significantly different Ca2+ releasing rates [4]. In nature, the most commonly phosphorylated amino acids contain a hydroxyl group (~ 17% of total residues which are serine (~8.5%), Thr (~5.7%) and Tyr (~3.0%)). About 700,000 potential phosphorylation sites exist if it is assumed there are ~10,000 different proteins with ~400 amino acids in average in a typical eukaryotic cell [5]. The increasing number of identified phosphorylation sites raises fundamental questions about their nature and biological relevance.
Modern mass spectrometry has provided accurate identification, high resolution and precise quantification for high-throughput proteomics. [6] Large datasets obtained by these techniques have been promoted for the development of customized analysis pipelines and facilitate for interpretation. Most of these pipelines supported large data repositories which store experimental details, such as PeptideAtlas [7], Human Proteinpedia [8], and NCBI Peptidome [9]. In recent years, platforms that combine more specific repositories for phosphorylation data and their compatible analysis tools have emerged, such as PhosphositePlus [10], Phospho.ELM [11], Scansite [12], and PPSP [13]. Repositories which stored several types of post-translational modification data have also been developed, such as SysPTM [14], and PTMScout [15]. To interpret large data from high-throughput experiments
2
or repositories, customized computational tools were developed, including myProMS [16], PrestOMIC [17], PeptideDepot [18], ProteoConnections [19], MASPECTRAS2 [20], and Qupe [21]. Most tools emphasized the processing of MS data, such as peptide identification and protein searching as well as spectra quantification and general issues of protein expression. Other tools which were specific to interpret phosphorylation activities included NetworKIN [22], NetPhorest [23], and KinomeXplorer [24]. These tools are only specialized in sequence-based kinase signaling network modeling. The tool SELPHI [25] performed the phosphorylation peptide-based correlation analysis to interpret downstream cellular signaling.
However, such analysis pipeline leaves either huge fortune of biological messages unexplored or other temporal regulating information behind.
Phosphorylation, a signal system, causes the transient status of protein property to response the environment change. These signals change as time goes by and represent what the condition the cell has undergone (Figure 1). Here, we develop DynaPho (Dynamic Phosphorylation), a web-based analysis platform that facilitates the exploration of global phosphoproteome datasets. DynaPho performs a data-driven analysis pipeline and distinguishes itself from other phosphorylation data analysis by focusing on facilitating the interpretation of temporal biological information. Users can upload their data which are preprocessed using MS quantification software, such as MaxQuant [26], or are self-calculated datasets. The data must contain the accession name, the phosphorylation site sequence and more than three time-coursed data. DynaPho analyzes datasets by using the clustering algorithm to identify temporally co-expression sets of phosphorylation events among serial time, using GO term functional enrichment analysis to infer temporal signaling changes, identifying conserved phosphorylation motifs to potential kinases by PSSM (position-specific scoring matrix), revealing the temporal activation profile of these kinases, and mapping modulated phosphosites onto temporal protein interaction network. Since DynaPho integrates valuable information from plenty of resources, including databases and tools, it can help to
3
provide detailed phosphoproteomics information.
To demonstrate the ability of DynaPho, we re-analyzed the phosphoproteomics dataset of the cell cycle on HeLa cell [27]. After DynaPho preprocesses the raw data, 14,703 phosphosites are identified among six continuous stages (mitosis, G1, G1/S, early S, late S and G2) with high confidence and quantified for analyzing. Eight co-expressed clusters are identified for dynamic phosphorylation profiles. Function enrichment of these clusters not only infers the same process with the original result but also reveals temporal signaling changes of these biological processes. Several key kinases in cell cycle, including CDK1 and CDK3, are identified by peptide sequence similarity analysis and their temporal activation profiles were also inferred. Furthermore, protein interaction network, including kinase-substrate network, can assist to present the temporal signaling profile among different proteins as well as infer signaling from RanBP2 to ErbB2 across mitosis and G1 stages.
DynaPho performs series of analyses and strengthens the temporal resolution to interpret the cellular signaling and dynamic biological information on phosphoproteome dataset.
4
CHAPTER 2 MATERIALS AND METHODS
2.1 Position in analyzing MS data
Generally, a MS-based experiment starts from a sample preparation. It includes adding protease and phosphatase (PTPs) inhibitors, extracting proteins, making the reduction of proteins for unfolding to a linear form, digesting proteins to peptides, labeling peptides on Lys and Arg based on different conditions, making series fractionation to separating peptides and enriching phosphorylation peptides by TiO2 microbeads or antibodies in advanced [28].
All collected fractions were separated on a reverse-phase liquid chromatography (LC) and then electrosprayed into a mass spectrometer. The searching engines, such as MaxQuant, can identify MS spectrum and map onto proteins on the basis of MS spectral databank, such as MassBank [29]. The input data of DynaPho is the output data of the searching engine.
DynaPho is used to analyze downstream cellular signaling and interprets biological datasets (Figure 2).
2.2 Input data format
Basically, DynaPho accepted labeling phosphosite datasets. The data format for each submission must contain accession name, phosphorylation peptides (over seven amino acids) and at least three labeling ratios on series time (Figure 3). The labeling ratio is not allowed to be transformed. The null or not detected labeling ratio can be represented by “NA”, “na” or blank. On the other hand, the label-free dataset can be transformed into ratio-like one for the submission.
2.3 Phosphosites among six stages of cell cycle in HeLa cell as a case study
The cell cycle is a highly conserved process which results in the duplication of cell’s content and molecular components. The progress of cell cycle is governed by the complex network of signaling pathways and also abides by regular time periods. We used the phosphosite dataset from the Olsen et al. investigation [27], and found total 24,714
5
phosphorylation events (FDR < 1%). 20,443 events of which were specific to a phosphorylation residue with high confidence (class I sites). The phosphosites were measured on six synchronous (by Thymidine and Nocodazole) and continuous stages (mitosis, G1, G1/S, early S, late S and G2). Furthermore, total 20,443 phosphosites (class I type) were filtered by the rule of no ratio change on all stages, including one (zero in log2 scaled) or null value. In the final, 14,703 phosphorylation events, which at least one stage was the perturbation status, were further analyzed.
2.4 Collect databases
DynaPho contains several databases which are used in different analysis modules, including function annotation module, kinase activation time profile module and protein interaction network module. The Gene Ontology (GO) biological process database was downloaded on 02/10/2015. Both the motif matrix for position specific scoring matrix and the motif logo repository were downloaded respectively from PhosphoNetworks on 12/10/2014 and 12/18/2014. The protein interaction databases were collected from BioGrid [30], HPRD [31], InAct [32], CCSB [33] and MINT [34] on 03/20/2015. All the above databases can be downloaded on the webpage of Dyanpho by FTP, HTTP, or the origin source. The Uniport database was directly downloaded by the instruction of uniprot.org with MySQL core on 03/20/2015.
2.5 Architecture and Sequential analyzing flowchart
The architecture and workflow of DynaPho is presented in Figure 4. The analyzing module of DynaPho was composed of six modules, including data preprocessing, statistical analysis, profile clustering, function enrichment, kinase activation profile, and interaction network. The uploaded data is first preprocessed by both filtering and filling procedures to make it reasonable. The statistical analysis is better executed on the next step to present proportions of each phosphorylation sites and the ratio distribution from total labeling ratios.
The profile clustering module groups co-expressed phosphorylation sites according to ratio
6
changes on the series time. If phosphorylation events are in the same cluster, the trend or expression change on the series time is similar for the dynamic regulation. The function enrichment module annotates phosphorylation sites based on the same cluster or one specific time point from GO biological process database. DynaPho automatically extracts conserved patterns by uploading all phosphorylation sequences to motif-x [35]. Furthermore, the kinase is inferred by conserved patterns with their peptides based on the position specific scoring matrix which is collected from PhosphoNetworks [36]. Temporal kinase activation profile is established by fisher’s exact test. The interaction network presents temporal protein-protein interactions for the dynamics of signaling changes. Customization input parameters of each analysis module and their default values are listed in Table 1. Public databases or services integrated in Dyanpho are listed in Table 2.
2.6 Filter and Fill data in data preprocessing
In data preprocessing, DynaPho first filtered missing values, including “NA”, “na”, null or not detection caused by anthropic error or mechanical limitation, on all labeling events in one phosphorylation site. A low proportion of missing value was tolerated and also filled by the machine learning algorithm. DynaPho provided users with customized threshold to filter phosphorylation events (delete entire phosphorylation site with its ratios). The following format shows how to filter phosphorylated site in raw data. The set of all phosphorylation sites is symbolized by I and ∀i∈ I. Ji is all HL ratios of phosphorylation site i and ∀ ji ∈ Ji.
Total HL ratios of phosphorylation site i is ni. T is the threshold defined by user to filter phosphorylation events.
retains, when n∄ji
ni ≤ T ; otherwise deletes the phsophorylation event
After DynaPho filters raw data, it fills all missing value in each phosphorylation events by giving a real number from the other phosphorylation events whose values are not empty on the same time point. DynaPho provides users with two machine learning methods to fill
7
missing value, average and k nearest neighbors (KNN). The average method is achieved by the following mathematical formula. The value of phosphorylation site i on time point j is Vij. For all missing values, DynaPho filled it by averaging all the other values on the same time point.
if Vij = missing value, Vij = ∑ (∃Vxj)
I
x=1
̅̅̅̅̅̅̅̅̅̅̅̅̅̅
K nearest neighbors (KNN) is a supervised classification method in data mining or machine learning and ‘k’ means the number (= 1,2,3, …, n, n is a positive integer) of data points close to obvious one based on the criterion, for example, distance, similarity, etc. In DynaPho, KNN filled one missing value in a specific time by first calculating euclidean distance with each one of the other data points whose value existed. Sort the distance in increasing order and average values from the first k members to fill the missing data. If total nearest member is less than k, average all the remaining. The k nearest neighbors defined by users is kd . The euclidean distance list of phosphorylation site i in increasing order is dini and the number of member in the list is n(dini ).
if n(dini ) ≥ kd, ∄Vij = ∑ ∃(dini )xj
kd
x=1
; otherwise ; ∄Vij = ∑ ∃(dini )xj
n(dini )
x=1
The vector of phosphorylated site i containing all ratios without time point j is V⃑⃑ ji. (dini )j = { ‖V⃑⃑ ji− V⃑⃑ jk‖ in increasing | i, k ∈ I and k ≠ i }, and the distance
‖V⃑⃑ ji− V⃑⃑ jk‖ = √ ∑ (Viy− Vky)2
nJ
y=1; y ≠j
; if ∄Viy or ∄Vky, (Viy− Vky)2 = 0
2
After average- or KNN-based filling procedure, the data preprocessing is complete due to no ambiguous value on each phosphorylation site.
8
2.7 Workflow and methods in basic statistics module
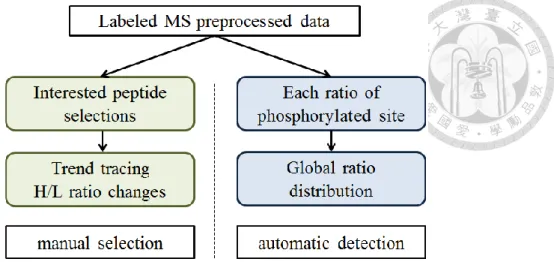
After the data is preprocessed, DynaPho presented users with the status of modified data and the analyzing flowchart of statistics module in DynaPho is shown on Figure 5. DynaPho automatically calculated proportion of each phosphorylation site (the ratio of serine, threonine and tyrosine) and a statistical distribution plot presents the number of total phosphorylation sites with their centrality degrees for the perturbation degree and more the analysis potential. If the distribution is more similar with normal distribution, the effect caused by the perturbation is less in cell and the analyzing potential is also less. DynaPho provides users with two parameters for centrality degree, including Inter−Quartile Range (IQR)
1.35
and the standard deviation. All processed labeling ratios in increasing order is Rin. Here Vi is ratio value in Rin.
IQR = (Rin)75%− (Rin)25%
1.35 ≅ √ 1
NRin ∑‖Vi− R̅̅̅̅‖in
Rin
i=1 2
= S. D.
If the value of IQR1.35 is more similar with standard deviation, less potential for analyzing and less fluctuation. The module also provided users with a trend chart of interested phosphorylation sites selected manually. The statistical analysis module is the foundation stone of the other analysis modules.
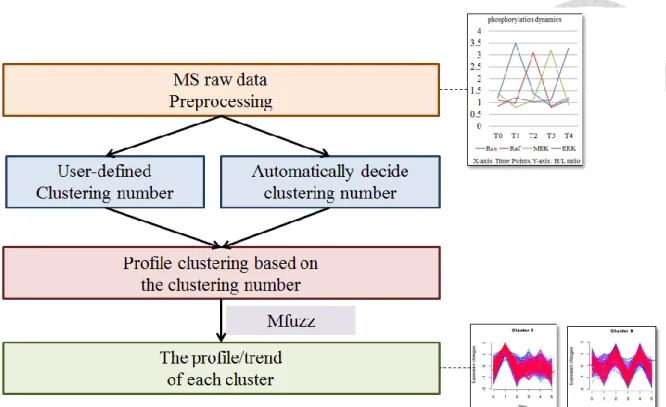
2.8 Workflow and methods in profile clustering module
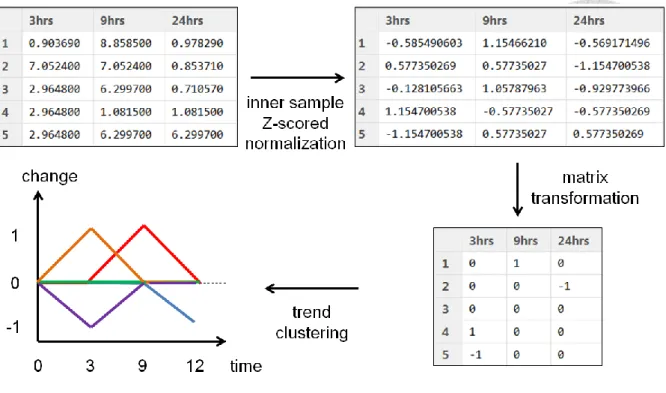
Most signaling events are temporal regulations so that similar dynamics from different phosphorylation sites implies similar biological functions or unified biological intentions. In profile clustering module (Figure 6), DynaPho first calculates the clustering number for different types of dynamic phosphorylation profiles (phosphorylation changes on sequential time) or receive the one from the user-defined by field knowledge. Auto detection method for the clustering number is composed of three calculations, inner sample z-scored normalization,
9
matrix transformation and trend clustering (Figure 7). Three fixed parameters involved are inner z-scored standard deviation (1.1 by default), variation threshold for all labeling ratios in specific time (over 0.01 S.D. by default) and the number threshold for the member in the cluster (over 1% of all phosphorylation events by default). The z-scored normalization transforms each labeling ratios in each phosphorylation events into a z-scored matrix. In single phosphorylation site i, the transformed value from the labeling ratio j is Zij and the standard deviation of all ratios is σi.
Zij = (Vij− V̅)i
σi (z − scored normalization)
Z-scored matrix is further transformed into a three-status matrix (1, -1, 0 for up, down or no change) in each phosphorylation events. The inner z-scored standard deviation is ZSD. The new status value of each labeling ratio is Sij.
if Zij ≥ ZSD, Sij = 1; else if Zij ≤ −1 × ZSD, Sij = −1; else Sij = 0
The status matrix is further processed by filtering specific time if its standard deviation is less than the variation threshold for removing redundancy information (status diversity of the specific time is less then variation threshold). The standard deviation of each time points in status matrix is Fi and the variation threshold is FSD.
remained, if Fi ≥ FSD; removed, if 𝑆𝐷𝑇𝑗 < FSD the entire status in specific time In trend clustering, DynaPho collects all trends (status vectors on time-scaled) existing on the status matrix and counts phosphorylation events of each trends. If the member number of one group is more than number threshold (proportion), it is seemed as a cluster; otherwise, ignore it. The remained status of one phosphorylation event i is V⃑⃑⃑ (a vector of all statuses). i The member of all the other phosphorylation events whose vectors are equal to V⃑⃑⃑ is n(Vi ⃑⃑⃑ ). i If n(V⃑⃑⃑ ) ≥ number threshold, then remained; otherwise, ignored the cluster. i
The clustering number is the parameter for clustering the phosphorylation profile by fuzzy c-means algorithm implemented in R named Mfuzz package [37]. Fuzzy c-means algorithm
10
clusters phosphorylation events for similar profiles (similar status vectors). Fuzzy c-means algorithm is one kinds of soft clustering that one data vector is no more definitely belonging to one center but to use values ranging from 0 to 1 representing levels how it is related to centers. The relation between each data vector and each cluster center is a membership matrix.
[38] Mfuzz first normalizes all labeling ratios in each phosphorylation events by z-scored with one standard deviation (similar with the auto-detection method). The C is a set of all m centers and ci is a center in C with i = 1 … m. The V is a set of all n phosphorylation status vectors and vj is a vector in V with j= 1 … n.
μcivjis the belonging level, and ∑ μcxvj= 1, and
m
x=1
∀j = 1 … n
For each status vector, the summary of all relationship levels with each center is 1. Initial step is to randomly generate the μ matrix fitting the above definition and it would be changed iteratively in order to find the optimized membership. The objective function F is defined as the following formula. The fuzzification value ranging from 1 to ∞ is M and the M value is 1.25 by default.
FM = ∑ ∑(μcivj)M
m
i=1 n
j=1
dist(vj− ci)2
The distance function used in fuzzy c-means clustering is the Euclidean distance (the same in Mfuzz). If optimize the objective function, the function of each center with membership and status vector is the following formula.
ci = ∑ (μnj=1 civj)Mvj
∑ (μnj=1 civj)M
The membership value between each center and each data vector is the following.
μcivj = 1
∑ (dist(xj− ci) dist(xj− cx))
( 2 n M−1)
x=1
In each iterator, calculate each center ci (∈ C) and then calculate new membership μcivj
11
between each center and each data vector. The converged condition of fuzzy c-means clustering is new value of objective function less than a threshold, or say it is much less than the previous value of objective function. In the Mfuzz, function mfuzz is main execution body and its output value, membership, presents the level how status vectors are related with the clustering centers. In each cluster, the member with low relationship is colored as blue; on the contrary, one with high relationship is colored as red. From the result calculated from fuzzy c-means clustering, clusters can be enriched with functions by gene ontology to interpret the signaling information.
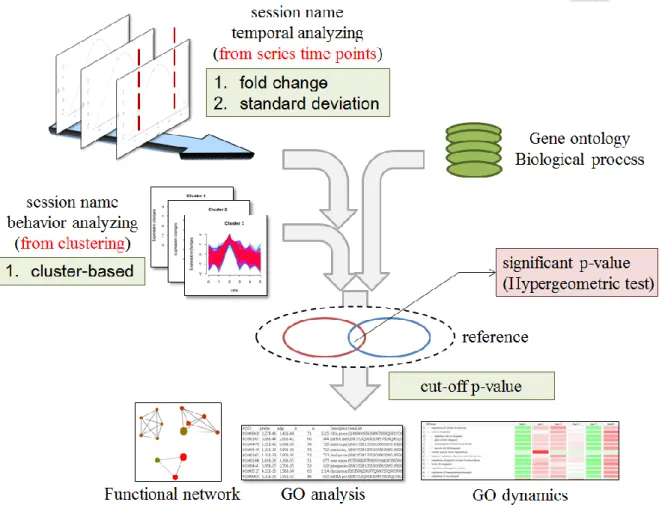
2.9 Workflow and methods in function annotation module
The function of a set of proteins represents specific biological information in the cell and several mechanisms evidenced previously for responding to the perturbation collaboratively and effectively. For example, MyD88 and TRIP, activate different downstream phosphorylation signaling, ERK and JUK, to cooperatively respond to the infection in the beginning of the inflammation caused by lipopolysaccharide (LPS) [39]. Besides, opposite signaling taken by different sets of proteins may also achieve the same goal (one type of synergistic effects), for example, bufalin up-regulated DR4/DR5 and down-regulated Cbl-b for TRAIL-induced apoptosis in the breast cancer cell [40]. The cooperative mechanism is uncovered by the profile clustering module and the opposite one is revealed by filtering specific time profile. Users can directly process clusters from profile clustering module or set the threshold of fold change or standard deviation to the specific time profile for function enrichment analysis. In specific time profile analysis, the phosphorylation events are first filtered by fold change or standard deviation and then map onto uniprot session names without repeat ones. The function of selected proteins or clusters is enriched by GO analyzing and the hypergeometric test is used with the background selected by users from GO biological process database or the total non-repeated proteins (input). (Figure 8) The specific GO term is g. The protein number of the background is N. The number of non-repeated
12
proteins is n. The number of proteins in the background with current GO term is M. The number of non-repeated proteins with current GO term is i.
Hypergeometric Probability: P(E = g) = (Mi)(N−Mn−i) (Nn)
After hypergeometric testing, use Benjamini and Hochberg method to justify each p-values for false discovery rate (FDR) [41]. The total p-values of GO terms is m. The list of all m p-values in increasing order is Pin. The 𝑃̃ is adjusted i𝑖 th p-value in Pin.
P̃ = mini k=i…m {min (m
k Pk, 1)}
The smaller adjusted p-value, the GO term is much possibly involved in the biological process. The function network analyzing links two related GO terms by the number of proteins involved in both (the node is GO term and the edge is intersected number of proteins) for the core activities. Furthermore, DynaPho provides users with the dynamics of biological progresses (GO terms) for deeply recovering complete signaling changes among temporal or cluster-based events in the cell. The dynamics is achieved and adjusted p-values is transformed by z-scored normalization.
2.10 Workflow and methods in kinase activation profile module
Kinases are keys in the phosphorylation signaling and also dynamic in temporal profiles.
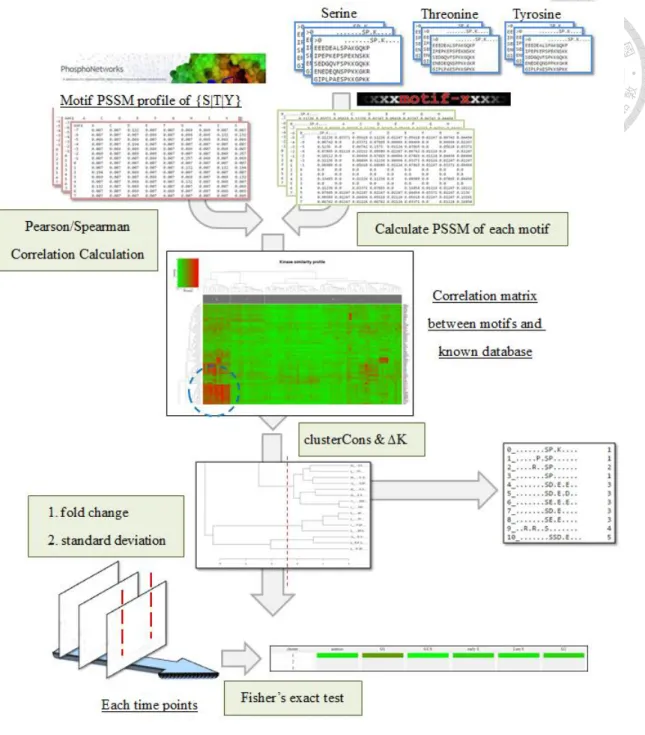
In this module, Dyanpho first finds conserved motif patterns by motif-x from phosphorylation sequences, compares the kinase PSSM with PhosphoNetworks databases evidenced in microarray platforms, clusters conserved patterns for similar kinases, and then constructs the temporal activation profile from these clusters by the fisher’s exact test (Figure 9). In the beginning, DynaPho collects three sets of phosphorylation sequences based on different central phosphosites, uploads each one of them into motif-x server with user-defined parameters, including occurences, significant threshold and reference (default values on Dyanpho is the same in motif-x, others parameters are also the same in motif-x but fixed and
13
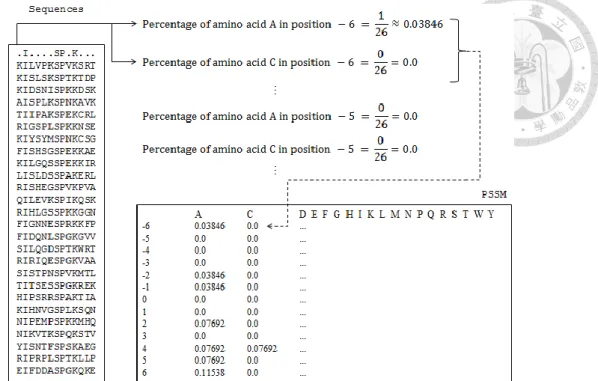
hidden in DynaPho) and then fetches the result. Motif-x conducts a statistical analysis by the binomial theorem possibility distribution to find successive significant residues. The core result contains several conserved motifs in different center phosphosites and their corresponding phosphorylation peptides. The PSSM is generated for each conserved motifs based on their sequence members and composed of each amino acid in x-axis, position relative to center phosphorylation site in y-axis (from -7 to 7 when the sequence length is 15) and percentages in the content. (Figure 10) The PSSM profile is further compared with the evidence-based database in PhosphoNetworks by pearson or spearman correlation analysis to discovery potential kinases. The PSSM database based on different phosphosites is Pdb, p is one of them (∀p ∈ Pdb) and p′is further ranked in increasing order. The calculated PSSM based on conserved motifs is Pu, u is one of them (∀u ∈ Pu) and u′ is further ranked in increasing order. Total percentages in PSSM without the profile of center phosphosite are Ts (center phosphosite which is certainly high correlation causes the bias) and assume the length of phosphorylation sequence is 15, Ts is (15 − 1) ∗ 20 = 280.
cor(p, u)pearson = covariance(p, u)
σpσu = ∑ (pTi=1s i− p)(ui− u)
√∑ (pTi=1s i− p)2
2 2√∑ (uTi=1s i− u)2
cor(p′, u′)spearman = 1 − 6 ∑T Tsi=1(di)2
s(Ts2−1) ; where di = pi′− ui′
The correlation matrix reveals potential kinases involved but it is necessary to be simplified because different phosphorylation peptides possibly belong to the same kinases (due to short length of phosphorylation sequence). DynaPho automatically calculates clustering number by iteratively resampling to cluster conserved motifs and implements it by R package “clusterCons”. ClusterCons calculates the area under the curve (AUC) from the dataset in different clustering number, finds the largest change of AUC (the quantity ∆K), and then merges consensus clustering results from different algorithms [42]. Follow the instruction, clustering algorithms implemented in DynaPho is k-means, agglomerative
14
nesting (agnes) and partitioning around medoids (pam) with fifty resampling. The clustering number determines groups of potential kinases by dividing the hierarchical clustering from conserved motifs in the correlation matrix. After DynaPho groups the conserved motifs into several clusters which kinase correlation profiles are similar, the fisher’s exact test is taken to analyze the correlation probabilities between the temporal profile and kinase clusters. In each time profile, DynaPho maps kinase clusters back to conserved motifs, extracts labeling ratios whose phosphorylation sequence belongs to these motifs and filters ratios by fold change or standard deviation to construct the contigency table. The number of labeling ratios crossing the threshold in the kinase cluster on the specific time is a and the other is c (not crossing the threshold). The number of labeling ratios crossing the threshold not in current kinase cluster on the specific time is b and the number of the other is d (not crossing the threshold). The n represents all number of labeling ratios (n = a + b + c + d). The C represents all clusters calculated from “clusterCons”, and c is one of cluster in C (∀c ∈ C). The T represents all time profiles and t is one specific time (∀t ∈ T).
P(∀c, ∀t) = (a+ba )(c+dc )
(a+cn ) = (a + b)! (c + d)! (a + c)! (b + d)!
(a!)(b!)(c!)(d!)(n!)
The potential kinase activation or deactivation profile is generated by iteratively calculating p-values from up- or down-expression contigency table. The more significant p-value represents that high probabilities potential kinases in the specific cluster are possibly involved in the specific time. DynaPho also transforms p-values into −1 × log10 scaled and colors them for the dynamic profile.
2.11 Workflow and methods in interaction network module
The phosphorylation signaling is composed of several proteins from upstream to downstream and achieved by their interactions to transfer chemical groups. However constraints to the experiment design, its results lose a part of important interaction messages and in some cases, transient interactions are the key of the signaling system. In interaction
15
network module, DynaPho focuses on these two issues, one is to connect direct interactions based on the specific time and the other is to link intermediary interactions for simulating the transient signaling. DynaPho first filters labeling ratios based on fold change or standard deviation on each time profile map them back into a set of uniprot names. Two non-redundancy proteins are connected by searching evidenced-based interaction databases whether the interaction exists and further annotating their functions and types from Uniprot database, including kinase, transcription factor, phosphatase and the other protein (Figure 11).
The intermediary interaction are established when two proteins do not interacted with each other, but they have the same hub protein which is over the threshold on the other time profile.
After DynaPho constructs the interaction network, the global view of temporal phosphorylation signaling presents how the perturbation affects the phosphoproteome in the cell and how phosphorylation proteins influence another one to pass biological messages.
2.12 DynaPho implementation
DynaPho is constructed in LAMP (Linux 3.10.0_x86_64, Apache 2.4.6, MySQL 5.5.40, and PHP 5.4.16) system. It is composed of five sub-systems, including web interface, job deployment, task recording, base framework, and administration. The base framework subsystem as an information center stores all types of settings, the configuration, meta information, and used images. The setting and configuration are mainly related to available network location or the physical path. The meta information stores titles and details of each module. This subsystem also constructs the base framework of the web interface, including the composition of all webpages. In addition, it integrates jQuery EasyUI (http://www.jeasyui.com/) to achieve the tab-based operation. The base framework subsystem as a checkpoint examines the availability of the task ID (after a successful uploading and preprocessing raw data) or session ID (each analysis). Furthermore, it also checks the status of raw data and generates a unique ID to a task or a session.
The job deployment subsystem controls analyzing procedures of five modules. Each
16
module contains three branches which are cooperative to achieve every analysis session. One is the task monitor which controls the progression of analysis (by two scripts progress.php and progress_body.php in each module). Second one is the collection of analyzing programs which combine several languages (Perl 5, Python 2.7.5, and R 3.1.1) and techniques (such as parallel computing, multi-task) into a hybridization computing for the better performance.
The other is the web presentation which is specific to each analysis result. In addition, this subsystem deletes the task, which is not executed over seven days, by the job scheduling method.
The web interface subsystem integrates lots of resources, including Plotly (https://plot.ly/) used in statistics module, jQuery Flot (http://www.jqueryflottutorial.com/) used in statistics module, jQuery EasyUI (http://www.jeasyui.com/) used in the whole subsystem, and Cytoscape.js [43] used in functional enrichment module and interaction network module. The main architecture consists of html, CSS and javascript (including jQuery) for presenting analyzed results.
The recording subsystem stores available tasks, execution sessions, error (or warning) logs, and analyzed results. The subsystem is independent from the other three ones. It means that DynaPho allows users to execute analyses derived from different tasks.
The administration subsystem stores the contact information of users. The subsystem is operated under the authorization. DynaPho is a module-based platform so that it is potential for extending new analyzing module in the future. Detailed composition of DynaPho with their physical path is listed in Table 5.
.
17
CHAPTER 3 RESULTS
3.1 Data quality status monitors changes over the cell cycle
After DynaPho preprocesses raw data, 14,703 phosphorylation events (class I phosphosites) are remained and 5,740 ones were filtered. The proportion of each phosphosites to these events is presented in Figure 12. The proportion of serine, threonine and tyrosine are respectively 78%, 19% and 3%. The phosphosite number of serine, threonine and tyrosine are 11,526, 2,742 and 435 respectively (no ambiguous phosphosite exists). The ratio between three phosphosites is similar with previous study [5], but tyrosine-based peptides are discovered more than it. Different phosphosites play discrepancy roles in phosphorylation signaling; for instance, phosphorylation of tyrosine was stringently regulated than others. Its phosphorylation was related to cellular regulatory function and its signaling pathway which is the major role in complex organisms [28].
All labeling ratios from these phosphorylation events are further transformed into log2 scale in a distribution chart (Figure 13). There are total of 88,218 labeling ratios, 81,913 are under 2 S.D., 4,216 are between 2 S.D. and 3 S.D., and 2,089 are over 3 S.D. About seven percentages of total ratios is potential analyzing and distributes over 14,703 phosphorylation events. These ratios are under -3 (labeling change is 0.125) and over 4 (labeling change is 16) in log2 scale. The parameter (interquartile range (IQR) / 1.35) is about 0.541 and is dissimilar with standard deviation. These descriptive statistics parameters represent the analyzing potential in the cell cycle.
3.2 Dynamic phosphorylation profiles reveal unified biological information
Eight co-expression clusters are identified by the analysis of profile clustering module.
(Figure 14) Eight clusters stand for eight different purposes and signaling systems in the cell cycle. More precisely, there are nine clusters because preprocessing procedure filters phosphorylation events which all labeling ratios are not changed. Ninth cluster may relate to
18
housekeeping, homeostasis functions or is unallied to the cell cycle. The result of each cell cycle stage contains the dynamic phosphorylation profile, the member number of phosphorylation events in each cluster, and the analysis of biological process (GO) by function enrichment module. The table of each cluster presents biological processes whose p-values in log10 scale are the top. The member number among these eight clusters is similar except that fifth cluster contains 6,394 phosphorylation events (43.488%). The dynamic profile of this cluster is that labeling ratios are highly changed in mitosis stage, but no changed in the other ones. The biological process analysis of the cluster presents most phosphorylation events are involved in mitosis cell cycle process, including nucleic acid organization (chromatin organization) and cytoplasmic component organization (organelle organization, cytoskeleton organization, macromolecular complex assembly, cytoplasmic transport, protein complex assembly, single-organism intracellular transport). These processes coincide with not only mitosis stage but also the original article. Both show that about half the peptides are phosphorylated in mitosis phase.
The dynamic profile of each cluster perfectly coincides with each cell cycle stages do not include first and eighth cluster. The mitosis, G1, G1/S, early S, late S, and G2 stages are respectively to fifth, second, fourth, third, seventh, and sixth clusters. In function enrichment analyses of these six clusters, it is not hard to understand biological processes involved in specific cell cycle stage. For example, fourth cluster (in G1/S) is mainly related to synthesis processes that prepare for DNA replication, including chromosome organization, gene expression and chromatin organization. The dynamic profile of eighth cluster is a sub-group which should be a part of mitosis stage (fifth cluster) in the original article because the labeling is highly changed in mitosis stage but a lightly down changed on early S and late S stages. And its biological process analysis presents highly related to the mitosis stage and homeostasis (including regulation functions). It means that some phosphorylation events are up-regulated in mitosis stage but down-regulated in S stage for homeostasis or regulation
19
purpose. The dynamic profile of the first cluster is that labeling changes are high in both mitosis and G1 stages. This cluster is also a sub-group which should be a part of G1 stage (second cluster) in the original article due to its result in Fig 3A. The biological process analysis indicates functions involved in both stages, including mitotic cell cycle process, microtubule-based process, and cytoskeleton organization. It implies that some phosphorylation events are in transition functions from mitosis to G1 stage. DynaPho strengthens the temporal resolution of phosphorylation events rather than transitional analyses. Also, DynaPho provides users more precise analysis algorithms to perform better clustering so that two more detailed co-expression sets are discovered.
3.3 Cellular signaling in temporal function profiles
After the analysis of function enrichment module, DynaPho summarizes core processes over all cycle stages in a functional network that nodes and edges are respectively biological processes (GO terms) and the proportion of intersection proteins. (Figure 15) Detailed biological processes with their adjusted p-values are listed in Table 4. In the functional network, each sub-network represents a set of biological processes for one or more cellular signaling (purposes). More precisely, these sub-networks correspond with stages in cell cycle.
For example, the sub-networks located on the bottom and right are mitotic chromosome condensation, mitotic nuclear division and chromatin organization. These processes present biological functions involved in the mitosis stage. Besides, sub-network in the center is mainly for homeostasis and contains lots of biological processes.
DynaPho analyzes core and detailed processes which are presented respectively in a network and a list on each temporal profile (on each cell cycle stage). The list contains biological processes which their adjusted p-values in log10 scale are the top. (Figure 16A - F).
It is easy to map the detailed processes into the summarized network on each temporal profile.
For example, in Figure 16D, several biological processes, including cellular protein complex assembly, cellular protein localization, DNA packaging, and regulation of chromosome
20
segregation are highly related to synthesis stage. These processes are further summarized into two functional networks located on the upper right and bottom.
DynaPho reinforces the dynamic analysis with a temporal heatmap profile. Summarize all biological processes with their adjusted p-values in a heatmap. The adjusted p-values are first transformed into log10 scale and further normalized by z-score. (Figure 17) In the temporal heatmap, DynaPho embraces all biological processes and their dynamic signaling among all cell cycle stages. For example, the processes which the regulation of chromosome segregation and regulation of microtubule polymerization or depolymerization are mainly involved in early S stage (time 4). The processes for nuclear envelope disassembly, chromatin organization and cytoskeleton organization are mainly in mitosis (time 1). DynaPho provides comprehensive analyses rather than transitional bioinformatics analyses.
3.4 Regulated phosphoproteome by potential kinases
DynaPho uncovers dynamic activation profiles of kinases after the analysis of kinase activation profile module. The phosphorylation sequences are sent to motif-x service based on different phosphosites and then DynaPho fetches several conserved motifs. (Table 3) Seventy-three serine-based motifs are found, twelve threonine-based ones are found, but no conserved motif exists when the phosphosite is tyrosine. Tyrosine-based motif is not found are the parameter settings (occurrences and significance) in motif-x due to maintenance of a low false positive rate.
The conserved motifs with their contribution sequences are valuable information for kinase sequence profiles. The evidenced sequence profiles maintained by PhosphoNetworks are further compared with ones generated by DynaPho from motif-x. The kinase similarity between PhosphoNetworks databases and sequence profiles from motif-x is presented in a heatmap. (Figure 18) The x-axis is the conserved motif whose phosphosite is serine or threonine, and the y-axis is the kinase. The text in white with grey background on the top of heatmap presents the cluster of conserved motifs whose kinase profiles are similar. The
21
darker red represents higher similarity between conserved motifs and kinases; in the contrary, the light green represents lower similarity. Three sections on the heatmap are relatively higher similarity. The corresponding conserved motifs and kinases are listed in Figure 19.
In the top of Figure 19, the temporal profiles of kinase activation and deactivation are also presented (the same with Figure 11). The adjusted p-values are transformed into log10 scale and the value is further multiplied by -1. The cluster 1 contains sixteen kinases, including cell cycle-related CDK family. The dynamic profile presents that kinases in cluster 1 are potential activation in G1, early S and G2 stages. The result is similar to the previous study that CDK1 was involved in G1 and G2 stages [44]. The cluster 2 contains thirteen kinases and most of them are related with cellular homeostasis or regulation. For example, both AKT1 and PAK4 were involved in homeostasis functions [45, 46]. Therefore, the activation and deactivation profile of cluster 2 are not significantly changed. DynaPho strengthens the analysis of phosphoproteome on potential kinases rather than transitional pathway analyses.
3.5 Phosphorylation signaling in cell cycle by protein interaction network
In interaction network module, DynaPho links sequential phosphorylation events across all cell cycle stages for the comprehensive signaling. Networks on Figure 20 A, B, C, D, E, and F are respectively the interaction network on mitosis, G1, G1/S, early S, late S, and G2 stage. Four shapes, including triangle, rectangle, hexagon, and circle, are respectively transcription factor, phosphatase, kinase, and the other protein type. The nodes and edges are respectively proteins (in gene name) and interactions. The interaction is composed of two types that are linking in the same stage (solid line) and linking across different stages (dashed line). The color of protein stands for its labeling ratio. The proteins in grey represented their labeling ratios that are filtered in the stage.
The interaction means the signaling event; for example, in G1 stage (Figure 20B) kinase EGFR phosphorylates transcription factor STAT3. Such signaling was evidenced by previous
22
study that EGFR-STAT pathway is involved in liver regeneration on G1/S stage [47]. In advanced, DynaPho links signaling information across cell cycle stages. For example, the interaction is linked between RanBP2 (Nup358) and ErbB2 across mitosis (Figure 20A) and G1 (Figure 20B) stage. In previous study, the cell membrane-embedded ErbB2 activates PI3K-signaling pathways which constitute important regulation in G1 stage. It migrates from the cell surface to the nucleus through endocytosis process by interacting with a nuclear pore protein RanBP2 as a traffic light [48-50]. DynaPho reinforces the analysis to construct a dynamic network across different cell cycle stages for further validation rather than the analysis in single stage.
23
CHAPTER 4 DISCUSSION
DynaPho is the integrated analysis platform for the dynamic signaling. DynaPho is distinguishable from other phosphoproteome analysis pipelines by focusing on facilitating the interpretation of temporal biological signaling. On the timeline of interpreting MS data, many well-known tools, including myProMS [16], PrestOMIC [17], and PeptideDepot [18], were developed to solve problems for identification and quantification, or their derived issues, such as differential expression. Nearly a decade, several tools were developed to extract biological information, such as ProteoConnections [19]. Furthermore, tools aimed to specific issues were also developed; for example, NetPhorest [23] focused on the study of kinome, and KinomeXplorer [24] highlighted modeling kinase-substrate interactions. DynaPho takes another approach to discovery dynamic biological signaling and further to interpret them.
DynaPho implements the trend detection and further soft clustering to group co-expression phosphorylation events on temporal profiles. These groups (clusters) are probably related in biological functions so that their biological processes are further analyzed by GO in the function enrichment module. Besides, the temporal changes of biological processes present when GO term is highly involved. DynaPho constructs an interaction network across the whole time (all cell cycle stages in the article) to present the complete signaling, including the one across different time points (stages in the article). Certainly, another service, named SELPHI [25], takes similar approaches to function enrichment module to infer the dynamics of pathways or similar networks. For instance, SELPHI constructs different types of networks, including kinase-kinase, and kinase-phosphatase. There are essential differences; for example, SELPHI focused on pathway comparisons among several experiments, or it conducted correlation analysis between different kinase phosphopeptides (or phosphatase phosphopeptides) and their associated phosphopeptides. In general, DynaPho is a brand-new analysis platform to comprehensively model dynamic signaling in the cell.
24
There are still several improvements. DynaPho is a data-driven analysis tool so that the status of original dataset is important. In the article, there is the bias or noise in raw data, even after preprocessing, because the average of total labeling ratios is slightly away from 0 and some of them are extremely high or low. The phosphorylation information is hardly unique or highly specific to one protein or sequence. This common phenomenon is caused by MS techniques or searching engines so that it makes the validation hard to proceed. It also makes users confused on ambiguous sequences or proteins. The bias or noise probably influences the construction of interaction network. General issues about GO term analysis are non-specific and redundancy information. These conditions also exist in DynaPho. Taking more GO terms into considerations is better for comprehensive analyses. In kinase activation module, sequence information does imply potential kinases, but similar sequence profile is not enough for similar functions of different kinases; for example, CDK1 and CDK2. The future work can focus how to analyze kinase activation profiles without redundancy sequence information. DynaPho integrates lots of resources and is implemented by plenty of programming techniques in order to provide users with better performance not only in the execution time but also in the web-based interaction. Hardware constraint or inadequate software skills also cause worse performance when extremely large scaled dataset is analyzed.
DynaPho will continue to extend or enhance the phosphoproteome analysis by integrating or replacing analysis module for more services to non-bioinformatics experts in the future.
25
CHAPTER 5 CONCLUSIONS
DynaPho is a web-based and user-friendly platform to comprehensively analyze temporal phosphoproteome datasets. It consists of one preprocessing and five sequential analyzing modules to infer the dynamic phosphorylation signaling. In human HeLa cell cycle dataset, statistical analysis reveals that seven percentage of labeling ratios (6,305 ratios over 2 S.D.) are potential for analyzing and distribute over 14,703 phosphorylation events. After the analysis of profile clustering, eight co-expression profiles are identified. They are further analyzed by function enrichment module. It not only reveals unified biological information but also resolves more deep into the dynamic phosphorylation profiles. After the analysis of function enrichment, DynaPho summarizes core processes over all cycle stages in a functional network and also reveals detailed biological processes. Besides, DynaPho also embraces all biological processes and their dynamic signaling among all cell cycle stages in a heatmap. After the analysis of kinase activation profile module, DynaPho finds potential kinases and further presents the temporal profiles of both activation and deactivation. For instance, both AKT1 and PAK4 are involved in homeostasis functions and CDK1 involved in G1, S, and G2 stage. In the interaction network module, DynaPho links sequential phosphorylation events across all cell cycle stages for the comprehensive signaling, such as EGFR-STAT pathway in G1/S stage and the signaling from RanBP2 to ErbB2 in mitosis/G1 stage. DynaPho improves many shortages of traditional analyses and strengthens the analysis of phosphoproteome. The advancement of modern mass spectrometry technology and the integrity of bioinformatics analyses, to make the analysis of dynamic signaling cell is possible.
26
REFERENCES
1. Cohen, P., The origins of protein phosphorylation. Nat Cell Biol, 2002. 4(5): p.
E127-30.
2. Ying, H., et al., The Rho kinase inhibitor fasudil inhibits tumor progression in human and rat tumor models. Mol Cancer Ther, 2006. 5(9): p. 2158-64.
3. Liu, D., et al., Clinical pharmacokinetics of Icotinib, an anti-cancer drug: evaluation of dose proportionality, food effect, and tolerability in healthy subjects. Cancer Chemother Pharmacol, 2014. 73(4): p. 721-7.
4. Bray, L., et al., Identification and functional characterization of the phosphorylation sites of the neuropeptide FF2 receptor. J Biol Chem, 2014. 289(49): p. 33754-66.
5. Ubersax, J.A. and J.E. Ferrell, Jr., Mechanisms of specificity in protein phosphorylation. Nat Rev Mol Cell Biol, 2007. 8(7): p. 530-41.
6. Choudhary, C. and M. Mann, Decoding signalling networks by mass spectrometry-based proteomics. Nat Rev Mol Cell Biol, 2010. 11(6): p. 427-39.
7. Deutsch, E.W., H. Lam, and R. Aebersold, PeptideAtlas: a resource for target selection for emerging targeted proteomics workflows. EMBO Rep, 2008. 9(5): p.
429-34.
8. Mathivanan, S., et al., Human Proteinpedia enables sharing of human protein data.
Nat Biotechnol, 2008. 26(2): p. 164-7.
9. Slotta, D.J., T. Barrett, and R. Edgar, NCBI Peptidome: a new public repository for mass spectrometry peptide identifications. Nat Biotechnol, 2009. 27(7): p. 600-1.
10. Hornbeck, P.V., et al., PhosphoSitePlus: a comprehensive resource for investigating the structure and function of experimentally determined post-translational modifications in man and mouse. Nucleic Acids Res, 2012. 40(Database issue): p.
D261-70.