Soochow University
Global Business Program, School of Business Thesis
An Investigation of the Behavioral Intention to Purchase Line Stickers
Student:Cheng, Chu-Yun 鄭筑云
Advisor:Dr. Lin, Chuan-Chuan 林娟娟 博士
July 2016
An Investigation of the Behavioral Intention to Purchase Line Stickers
A Thesis Submitted to Soochow University
in partial Fulfillment of the Requirements for the Degree of
Master of Business Administration In
Global Business Program
By
Cheng, Chu-Yun (鄭筑云)
Global Business program, School of Business, Soochow University July, 2016
i
Abstract
The invention of smartphone caused the revolution of Instant Messaging (IM).
Many Mobile IM (MIM) apps are created for mobile users. Due to its original stickers, LINE is rapidly registered by billions of users and gain impressive sales revenues of LINE paid stickers. However, according to the statistics in 2012, LINE users who purchased paid stickers are very few, and the growth of annual revenues of paid stickers are unstable from 2013 to 2015. Therefore, this study attempted to find out what factors would attract user to purchase paid stickers by examining LINE users’ behavioral intention to purchase LINE paid stickers. In this study, with the Stimulus Organism Response (SOR) model, we took perceived value (i.e. product value & experiential value) and social tie (i.e. social influence & social presence) as stimulus to detect LINE users’ desire and attitude in response to their behavioral intention to purchase paid stickers. Results show that perceived value and social tie had positive effects on user attitude, and only experiential value had a positive effect on desire. Furthermore, differences between users having purchased paid stickers or not manifested in the amount and variety of incentives to trigger their behavioral intention. Experienced users are affected by paid stickers and social interaction, while potential users are only impacted by the products.
Keywords: LINE stickers, behavioral intention, perceived value, social tie, SOR model, Mobile Instant Messaging (MIM) apps
ii
Acknowledgement
In this two years, I came to know about so many new things in the courses and the thesis. It is really helpful for enhance abilities of thinking and solving problem.
Thanks to Dr. Lin, Chuan-Chuan (林娟娟) for her encouragement and instruction in giving me full strength to complete this thesis. Even facing with some difficulties in completing this thesis, she is always managed to assist me in completing it. Special appreciation to Dr. Miao, Yi-Feng (苗議丰) for all of her support and guidance in helping me finish my thesis. In addition, a lot of thanks to the committee members, Dr.
Chin-Lung Hsu (許晉龍) and Dr. Zen-Chuen Tzou (鄒仁淳), for giving me precious suggestions and insightful comments, so that this thesis becomes the perfect writings. I am really thankful to them.
I would like to express my special thanks of gratitude to the secretary in GBP, Serena Chiang, for giving lots of encouragement and assistance in this two years. In addition, grateful acknowledgement to all of my classmates and friends who never give up in giving their support to me in all aspects of life, including Hsiu-Wei, Yao-Min, Lina, Denise, Rachel, Wilbur. Thank you very much my friends. I will never forget all of your kindness.
At last, I would like to thanks to my family, for supporting me mentally and physically not just during finishing this thesis but also during my whole studies.
~THANKS AGAIN TO ALL WHO HELPED ME~
iii
Table of Content
Abstract ... i
Acknowledgement ... ii
Table of Content ... ii
List of Tables ... v
List of Figures ... vi
I. Introduction ... 1
1.1 Background and Motivation ... 1
II. Literature Review ... 5
2.1 Mobile Instant Messaging ... 5
2.2 Stickers ... 9
2.3 Stimulus Organism Response Theory ... 12
2.4 Perceived Value ... 14
2.5 Social Tie ... 17
2.6 Attitude ... 20
2.7 Desire ... 21
2.8 Behavioral Intention... 22
III. Research Method ... 23
3.1 Research Model and Hypotheses ... 23
3.2 Construct Definition... 27
3.3 Data Collection ... 29
3.4 Statistical Analysis Method... 30
IV. Results ... 32
4.1 Samples ... 32
4.2 Descriptive Statistics ... 38
iv
4.3 Measurement Model ... 39
4.4 Structural Model ... 43
V. Conclusion ... 49
5.1 Discussion ... 49
5.2 Theoretical Implications ... 51
5.3 Managerial Implications ... 51
5.4 Limitations and Suggestion for Future Research ... 52
References ... 54
Appendix Questionnaire ... 62
v
List of Tables
Table 1 Mobile Communication Applications ... 7
Table 2 Emoticons ... 10
Table 3 Construct Definitions ... 27
Table 4 Genders ... 32
Table 5 Ages ... 33
Table 6 Education Levels ... 34
Table 7 Occupations ... 34
Table 8 Monthly Incomes ... 35
Table 9 Platforms ... 35
Table 10 Experience in Using LINE... 36
Table 11 Purchase Period for LINE Paid Stickers ... 37
Table 12 Expenditure for LINE Paid Stickers ... 37
Table 13 Descriptive Statistics ... 38
Table 14 Reliability Analyses (pilot test) ... 40
Table 15 Discriminant Validity (pilot test) ... 40
Table 16 Reliability Analyses ... 41
Table 17 Factor Loadings ... 42
Table 18 Discriminant Validity ... 43
Table 19 Results of Hypotheses Tests ... 45
Table 20 Results of ANOVA ... 46
vi
List of Figures
Figure 1 Sales Revenue of LINE Paid Stickers ··· 3
Figure 2 LINE Stickers ··· 11
Figure 3 SOR model ··· 12
Figure 4 Objective Situation Behavior Model ··· 12
Figure 5 Social Network Diagram ··· 19
Figure 6 Research Model ··· 23
Figure 7 Results of Structural Modeling Analysis (n=517) ··· 44
Figure 8 Results of Structural Modeling Analysis of Experienced Users (n=388) 47 Figure 9 Results of Structural Modeling Analysis of Potential Users (n=129) ··· 48
1
I. Introduction
1.1 Background and Motivation
Since the emergence of smartphones and the development of wireless Internet, people gradually rely on their smartphones and the Internet in daily life. At the same time, more and more mobile applications were created and provided to electronic device users, especially, applications for instant messaging. People can send texts, images, audios, and videos to their friends and family anytime, anywhere with instant- messaging applications. It has already become a common way of communication.
Nowadays, mobile instant messengers include WhatsAPP, Skype, WeChat, Facebook Messenger, LINE, etc.
Among numerous mobile instant messengers, LINE is widely used in some Asia countries, such as Japan, Taiwan, Thailand, and so on. One of reasons could be that LINE provides a variety of electronic stickers to make conversations more interesting in addition to text messages and emoticons. Generally speaking, users are able to use emoticons to express their feelings in their conversations. However, the comic-style performance of LINE stickers is easier to understand and convey feelings to the other side. Through these vivid stickers, people show their feelings and facial expressions that they do not normally show in real life (Donath, 2001). Furthermore, LINE stickers enable users to express their states of life, such as eating, listening to the music, working, and so on. Therefore, LINE stickers have successfully taken the place of emoticon and become an indispensable tool for smartphone users.
As LINE has grown rapidly to involve billions of users, more and more stickers
2
have been created and provided to LINE users. Some stickers are available for free download, and others are sold in the LINE Sticker Shop. Users are allowed to download free stickers, or they can purchase paid stickers. According to the statistics from Insight Xplorer in 2012, 61% of mobile users in Taiwan were using LINE. Among those users, only 3.2% of them have purchased LINE paid stickers. In addition, the sales revenue of LINE paid stickers was accounted for 20% (about NT$ 2.06 billion) of the 2013 overall revenue. To provide users with more LINE stickers, LINE Corporation, in 2014, established “LINE Creators Market” for people creating and selling their own stickers.
Not only sticker creators have accumulated more than 270,000 people, but also numbers of original stickers exceed 300,000 sets. The 2014 sales revenue of LINE paid stickers was accounted for 24% (about NT$ 6.3 billion) of LINE Corporation’s total sales revenue. It indicates that the establishment of “LINE Creators Market” successfully increased more than three times revenues of stickers. However, even though in 2015, the sales revenue of paid stickers was accounted for 26% (about NT$8.8 billion) of the LINE Corporation’s total sales revenue, the growth of sales revenue of stickers seems to slow down (see Figure 1). According to the annual revenue of paid stickers, we found that the proportion of stickers revenues increased year by year, which indicates the importance of paid stickers. However, the growth rate of sticker revenue is turning slower. Therefore, even though LINE have provided more and more paid stickers to billions of users, it is important to investigate into the ways to effectively increase users’
intention to purchase paid stickers. Consequently, finding out what factors would contribute to user intention to purchase paid stickers are important for LINE Corporation and stickers creators.
3
Figure 1 Sales Revenue of LINE Paid Stickers
(Source: LINE Corporation)
The purpose of this study is to examine LINE users’ behavioral intention by applying the Stimulus Organization Response (SOR) model. This study broadly defines behavioral intention to purchase LINE paid stickers as the user’s willingness to purchase LINE paid stickers, implement in-app purchases or pay to send friends. In addition, this study aims to identify factors that influence behavioral intention for experienced users (i.e., users who have ever purchased LINE paid stickers) and potential users (users who never made prior purchases of paid stickers). Since different groups may exhibit different sticker preferences and purchasing behaviors, the results can provide further insights for the design of LINE paid stickers marketing strategies.
The behavioral intention can be driven by user attitude and desire (Tsai &
Bagozzi, 2014). With the positive attitude and purchase desire for products, a consumer is more willing to purchase. Attitude and desire may be triggered by perceived value (Cronin et al., 2000). Research from Zeithaml (1988) shows that before purchasing products and service, consumers would make an overall assessment to measure the value of product that he can obtain from. In the process of assessment, price, quality,
2.06
6.37
8.8
0 1 2 3 4 5 6 7 8 9 10
2013 2014 2015
(NT$ billions)
4
performance of products, and purchase experiences may have influence on a consumer’s decision-making (Dodds and Monroe, 1985). Therefore, in this study, product value and experiential value will be adopted to enhance our understanding of users’ perceived value of LINE paid stickers.
Moreover, users’ attitudes and perception of purchasing LINE paid stickers may be directly influenced by family, friends, and media information and thereby it becomes a kind of social influence to users (Childers & Rao, 1992). In addition, previous study (Tamborini & Skalski, 2006) showed that members in virtual community interact with others and thus generate feelings as having face-to-face conversation in the real world, and such case is known as social presence. By transmitting LINE stickers, LINE users express their kindness to new friends, and it may happen that when receivers see those stickers like seeing the person in the face of them. The study tries to combine social influence and social presence as ‘social tie’ to investigate the impact of LINE users’
social network and connections with others on behavioral intention to purchase LINE paid stickers.
This study applied a structural equation model (SEM) to assess the empirical strength of the relationships in the proposed model. The factors studied here may be of importance in understanding the user’s behavioral intention to purchase LINE paid stickers. For sticker developers to increase the sale of paid stickers, they must understand what factors contribute to user intention to purchase paid stickers. The findings of this research help sticker practitioners develop better user-accepted paid stickers and promote new stickers to potential customers.
5
II. Literature Review
In this study, we try to investigate the influence of perceived value and social tie on LINE users’ attitude, desire and behavioral intention to purchase LINE paid stickers. In this chapter, we will introduce some mobile instant messengers. In addition, in order to establish the theoretical background of the study, we will review the Stimulus Organism Response (SOR) theory, as well as the definitions and measurements of perceived value and social tie. Lastly, literatures of the relationship among attitude, desire, and behavioral intention will be discussed in this chapter.
2.1 Mobile Instant Messaging
2.1.1 Instant Messaging
Instant messaging (IM) is a type of online communication software that provides users to contact with each other via the Internet. It is also a kind of transmission medium to check for immediate responses and set up a face-to-face meeting for chatting or discussing issues (Kim et al., 2007). Users receive and send to each other real-time text messages according to their “buddy lists” of contacts (Cameron & Webster, 2005).
Using IM, users can organize their buddies into one or more buddy groups to communicate with at the same time. In addition to transmitting instant text messages, more advanced IM softwares such as Skype, Yahoo! Messengers, AOL Instant Messenger (AIM) are able to transfer files, to click hyperlinks, and to have voice or video chats.
6
2.1.2 Mobile Instant Messaging apps
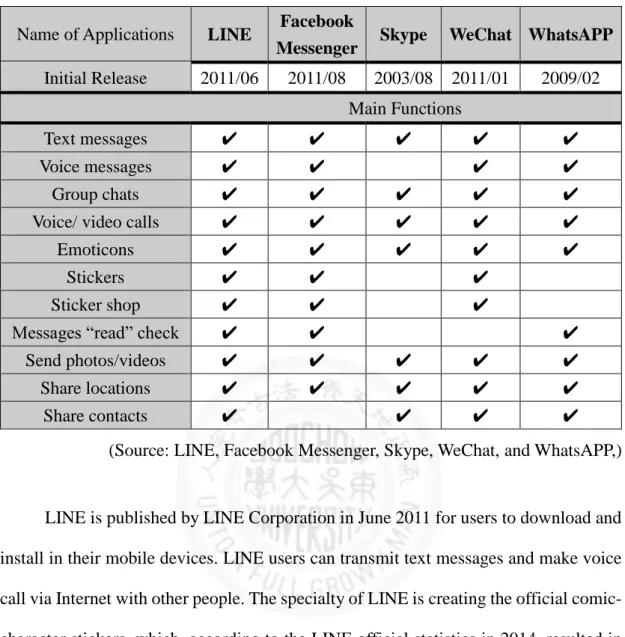
With the popularization of smartphones, more and more people use smart phones rather than using PC or laptop. Mobile instant messaging (MIM) have thus been created for mobile phones. More and more IM softwares are redeveloped to be MIM apps and most of them are free to download. Comparing with IM softwares, MIM apps are designed to be more user-friendly. For example, mobile users are able to send messages to others or have voice and video chatting via MIM apps anytime, anywhere (Deng et al., 2010). In this study, we compile five MIM apps, commonly downloaded into mobile devices, including their main functions. As shown in Table 1, Skype is the earliest published IM for PC or laptops before smartphones were invented. With the progress of mobile technology, Skype was also developed into the MIM app. However, it did not provide as many functions as other MIM apps, such as Facebook Messenger, WeChat, WhatsAPP, and LINE. The latter are created with more functions, such as voice messages, stickers, messages “read” check, and so on. Therefore, these up-to-date MIM apps are developed to satisfy mobile users’ needs and desire.
7
Table 1 Mobile Communication Applications Name of Applications LINE Facebook
Messenger Skype WeChat WhatsAPP Initial Release 2011/06 2011/08 2003/08 2011/01 2009/02
Main Functions
Text messages ✔ ✔ ✔ ✔ ✔
Voice messages ✔ ✔ ✔ ✔
Group chats ✔ ✔ ✔ ✔ ✔
Voice/ video calls ✔ ✔ ✔ ✔ ✔
Emoticons ✔ ✔ ✔ ✔ ✔
Stickers ✔ ✔ ✔
Sticker shop ✔ ✔ ✔
Messages “read” check ✔ ✔ ✔
Send photos/videos ✔ ✔ ✔ ✔ ✔
Share locations ✔ ✔ ✔ ✔ ✔
Share contacts ✔ ✔ ✔ ✔
(Source: LINE, Facebook Messenger, Skype, WeChat, and WhatsAPP,)
LINE is published by LINE Corporation in June 2011 for users to download and install in their mobile devices. LINE users can transmit text messages and make voice call via Internet with other people. The specialty of LINE is creating the official comic- character stickers, which, according to the LINE official statistics in 2014, resulted in more than 1 billion downloads of the MIM application. In addition, LINE has been published in 240 countries, and the number of LINE users has exceeded 400 million.
Most of LINE users are Japanese users, and in Taiwan there are more than 17 million users.
LINE strives to meet users’ needs and enhance the value of LINE stickers. In order to expand its service and users, LINE developed two kinds of business models.
First, LINE allows enterprises to register their official accounts and provide free stickers for users. LINE users may decide to add these official accounts as friends, so
8
they can download free stickers and receive some news from these official accounts.
By establishing an official accounts, enterprises are able to do advertising and to communicate directly with these potential customers. As to LINE, it offers opportunities for enterprises to expand the market and also takes advantage of free stickers to attract more people using LINE. Based on the purpose of providing more stickers to billions of users, LINE successfully established the B2B business model and brought about the impacts and demands of stickers on mobile users. In addition, the establishment of “LINE Creators Market” represents a kind of B2C business model between LINE Co. and its users. Due to these two kinds of business models, LINE establishes mutually beneficial relationships with customers and enterprises, and the economic effects of LINE stickers are also quite impressive.
9
2.2 Stickers
2.2.1 Emoticons
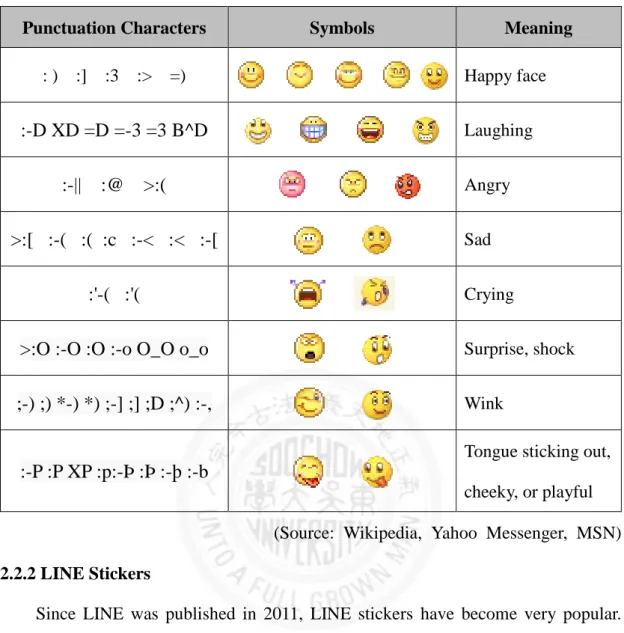
Emoticon is a kind of computer mediated communication (CMC). In addition to text messages, users can express their feelings through emoticons. These nonverbal cues can not only assist text interpretation, but also be beneficial for users to acquaint the personality and attitude of each other (Xu et al., 2007). Emoticon is combined by
‘emotion’ and ‘icons’, and it is composed of punctuation characters or symbols (see Table 2). In addition to the text interpretation, emoticons can be used as signals to email contents and served as modified marks when people check or edit their initial production (Luor et al., 2010). With the development of IM technology, emoticons has been widely used in online message communication. Therefore, through text, emoticons, and IM softwares, users are able to transmit messages and emotions to each other and have better online communication qualities.
10
Table 2 Emoticons
Punctuation Characters Symbols Meaning
: ) :] :3 :> =)
Happy face :-D XD =D =-3 =3 B^D
Laughing
:-|| :@ >:( Angry
>:[ :-( :( :c :-< :< :-[ Sad :'-( :'(
Crying
>:O :-O :O :-o O_O o_o
Surprise, shock
;-) ;) *-) *) ;-] ;] ;D ;^) :-,
Wink
:-P :P XP :p:-Þ :Þ :-þ :-b
Tongue sticking out, cheeky, or playful (Source: Wikipedia, Yahoo Messenger, MSN) 2.2.2 LINE Stickers
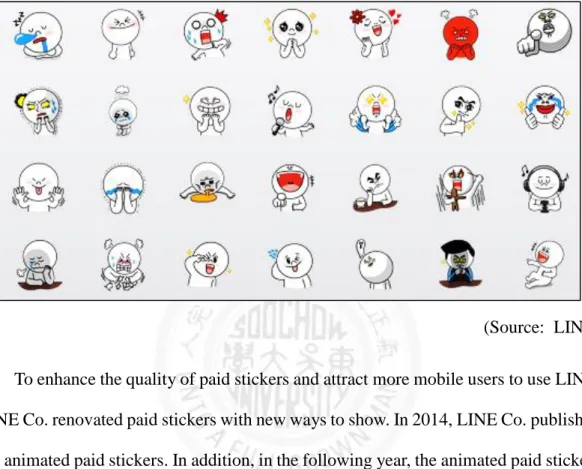
Since LINE was published in 2011, LINE stickers have become very popular.
Similar to facial expressions and emoticons, LINE stickers are another type of nonverbal cues represented an emotion or action (see Figure 2). Comparing with emoticons, LINE stickers can be more helpful to express user’s complex emotions and enhance the entertainment during the conversation. In addition, LINE stickers are provided to demonstrate users’ daily activities. Because of the interesting, lively, and exaggerated manifestation of stickers, users can eliminate the need of typing and clarify the meaning of the message. Therefore, LINE stickers can be noted as a way to enhance emotions in MIM apps and take the place of nonverbal communications when not face- to-face (Tossell et al., 2012). With the popularity of LINE stickers, some MIM apps
11
gradually provided stickers to their users, such as Facebook Messenger and WeChat.
Therefore, more and more interesting and entertaining stickers are created to attract mobile users to download.
Figure 2 LINE Stickers
(Source: LINE) To enhance the quality of paid stickers and attract more mobile users to use LINE, LINE Co. renovated paid stickers with new ways to show. In 2014, LINE Co. published the animated paid stickers. In addition, in the following year, the animated paid stickers were launched with voice, so that users can feel each other’s emotions more strongly.
The continued evolution of paid stickers not only make online communication more interesting and full of entertainment, but also bring huge profits and business opportunities for MIM apps.
12
2.3 Stimulus Organism Response Theory
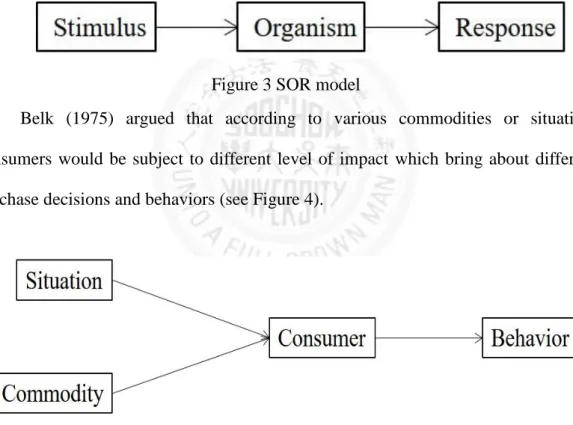
The Stimulus Organism Response theory (SOR), proposed by Mehrabian &
Russell (1974), shows that under the right stimulus, the organism would trigger motivation and then responses in appropriate actions. This paradigm can be used to explain consumer behavior. When a consumer is affected by external environmental factors (S), he would generate motivation (O). Driven by the motivation, the consumer make a purchase decision and put in purchase behaviors (R) (see Figure 3).
Figure 3 SOR model
Belk (1975) argued that according to various commodities or situation, consumers would be subject to different level of impact which bring about different purchase decisions and behaviors (see Figure 4).
Figure 4 Objective Situation Behavior Model
In addition, Belk (1975) proposed five types of situational variables as stimulus which may influence consumer and lead to purchase behavior. First, physical surroundings: it features that the configuration which surrounds the stimulus object, such as location, decoration, sounds, fragrance, lighting, weather, etc., will impact on an individual’s decision made and the evaluation of experience. Second, social
13
surroundings: an individual’s decision and behavior tend to be impacted by social
interactions, such as other people’s presence, distinctive characteristics, or interpersonal interaction. In social marketing situations, it is often seen as the major external influence that affects consumers’ decision-making. Third, temporal perspective: it emphasizes on the influence of time on consumer behavior. Consumers measure and evaluate the value of the community or service according to the passage of time.
Consumers will gradually perceive the value of products or service over time, and then they will take the experience as reference for the next-time purchase decision. Fourth, task definition: consumption activities can occur with intentional or irrational decision-
making. For the purpose of personal use or gifts, consumer may conduct a specific purchase. Lastly, antecedent states: it means non-persistent individual characteristics and condition, such as extreme emotions, temporary situations, and so on. For example, people in the state of depression or excitement may make the purchase decision different from the past.
On the other hand, Dumana and Mattilab (2005) pointed out that perceived value is related to consumers’ emotions and consumption experience, which result in their consequence for purchase behavior. According to previous studies, SOR model has been proved and applied in many different categories of stimulus, such as products (Bloch, 1995; Lee, Ha, & Widdows, 2011) or services, physical stores (Baker, Grewal,
& Levy, 1992) and online purchase (Eroglu, Machleit, & Davis, 2001; Mummalaneni, 2005). Moreover, Schiffmam and Kanuk (2000) believes that not only the psychological motivations but also social interaction and the environment have a certain degree of influence on purchasing behaviors. Interacting with other people, one would receive different information or thoughts from the public, and it may directly affect his perception or attitude. Therefore, in this study, we use SOR model as theoretical
14
framework and try to find out external factors (i.e. perceived value and social tie) that have a great influence on LINE users’ inner desire and/or attitude and correspond to their behavioral intention to purchase LINE paid stickers.
2.4 Perceived Value
2.4.1 Definition of Perceived Value
In the consumption process, consumers make purchase decisions depending on their perceived value (Cronin et al., 2000). The perceived value would change according to consumer’s knowledge and experience. The higher value the customer perceived, the greater possibility it has that his behavioral intention would be impacted.
Dodds and Monroe (1985) proposed that perceived value is related to price and quality of product, and purchase experience. Zeithaml (1988) mentioned that perceived value is an overall assessment which consumers not only measure their “gain” and “payment”
from products, but also product performance to get. He also gave perceived value four definitions. First, perceived value is a lower price. As far as consumers’ concern, they would feel higher perceived value when they have discounts or coupons. Second, perceived value is what a person wants to gain form products. What benefits consumers obtain from products would be turned into their satisfaction. Third, perceived value is a comparison between payment and quality of products. Lastly, perceived value is the comparison with payment and attainment.
In addition, Holbrook (1994) defined perceived value as the experience of interactive and relative personal preference. First, perceived value is a kind of preference, influenced by individual interests and love. Second, perceived value contains some interaction among things, which refer to products, service or staff. Third,
15
perceived value is related to the individual evaluation. Lastly, perceived value is concerned to experience, which means the value is perceived after an individual use the product or service. Mathwick, Malhotra, and Rigdon (2002) have proposed a framework of experienced value and classify into four categories. The first is
‘consumers return on investment’ (CROI). Consumers take reward that they can obtain from time costs, investment value, and expectation, but not using the actual transaction price as to judge the value. It is considered the efficiency and economic considerations.
The second is ‘service excellence.’ The reaction of consumers to service and marketing is mainly from consumers’ purchase experience of products and service. The third,
‘aesthetics,’ concludes design, atmosphere, visual appeal, and feeling for beauty, which is examined by visual perception. The last is ‘playfulness.’ When consumers are experiencing products or service, they would feel pleasure and temporarily escaping from the real world. It takes escaping from reality and imagination as measurement.
Due to prior researches with different perceptions, there are many definitions and explanation of perceived value. First, perceived value is subjective and what consumers are aware. Second, the perceived value that consumer identify is transaction between rewards and payment. Third, perceived value is formed through assessment. Perceived value is a long-term influence on consumer behavior, and it would turn into a kind of concept or perception in their mind, especially experiential value, the basis of consumer reviews. By and large, perceived value is more abstract than quality and service because it involves subjective feelings and past experience, which would become the subject value for the next time consumption.
2.4.2 Measurement of Perceived Value
The way of measuring the perceived value is dependent on each consumer‘s rule
16
and perception. Some consumers experience the value with lower price, so the value is measured by money. Some other consumers rewards the value by product quality and product price. To measure perceived value of products or service, Zeithaml (1988) posits four propositions to measure perceived value. First is ‘value is low price.’
Customers feel the value as they can use coupon or the product is on sale. The second is ‘value is whatever I want in a product.’ The benefits consumers received from the products as the most important components of value. The third is ‘value is the quality I get for the price I pay.’ It is a trade-off between the price and the quality. Lastly, ‘value is what I get for what I give,’ which means that value is what consumers are paying for what they are getting, even more.
According to Zeithaml’s study (1988), we find that perceived value can be evaluated by product price, product quality, and the benefits that consumer get from the product. Focusing on the benefits from products, Sweeney and Soutar (2001) bring up another four dimensions to investigate perceived value: emotion, socialization, price, and performance/quality. First, emotional value is from consumers’ feelings or affective states when they firstly touch a product. Second, social value is public impression of a product that affects consumers’ cognition. Third, value for money represents that a product is evaluated by the short-term and long-term costs. For example, the price of a set of LINE paid stickers is NT$30 to NT$60. When a user purchase the set of LINE paid stickers, he or she are allowed to use all the time. With a little cost, the user is able to use the set of LINE stickers permanently. Lastly, consumers are affected by the performance or the quality of a product. As we mentioned in the introduction, LINE stickers is well known for the comic-style performance with characters. Therefore, consumers favor LINE stickers.
17
Most of previous studies are focusing on product, such as product price, product quality, and the benefits derived from the product, to define or examine perceived value.
However, to the consumer’s perceptive, past experience is also another way to perceive the value in consumption process. In view of the experience, Holbrook (1994) used three dimensions to explore perceived value. First, ‘extrinsic and intrinsic value’: the former is that in consumption process, consumers use functional or practical instruments to reach their purpose; the latter is stressed on purchase/use experience.
Second, ‘self- and other-oriented value’: self-oriented value is consumers who evaluate the value derived from products or service; other-oriented value is external factors, which have influence on consumers, such as environments, family, and friends. Third,
‘active versus reactive value’: in consumption process, the value is generated as the consumer manipulates the product or service, which refers to active value; conversely, reactive value is created when the product or service does to the consumer. In this study, about perceived value, we combine the above three scholars’ studies to investigate that product value and experiential value have positive effects on desire and attitude, and then on behavioral intention to purchase LINE stickers.
2.5 Social Tie
2.5.1 Definition of Social Tie
Social tie is a kind of links of relationships between people in their social networks. As to the social network, it is composed of personal nodes or organizational nodes. These nodes link together as social networks and have relationships, such as family, friends, associates, company organizations, etc. (Carley, 2002; Contractor &
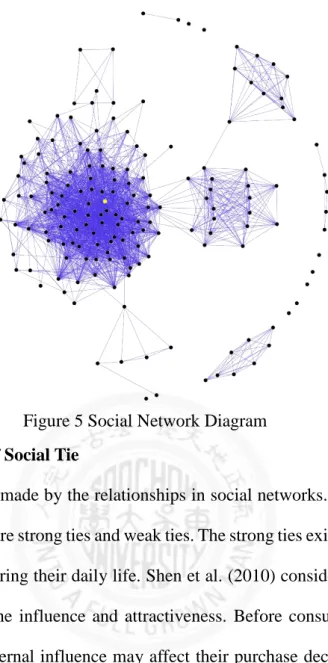
Monge, 2002). Pattison (1993) depicts the social network as a social network diagram (see Figure 5). Each black dot represents a person or an organization. These dots
18
connect with lines, which symbolize their relationships. With different levels of relationships, dots and lines gather to one side, and the other side is scattered. Some people have strong and complicated relationships as the left side in the diagram (see Figure 5). Others (i.e. on the right side) is not so close to them, so it looks dispersive.
According to levels of aggregation of dots and lines, the relationships have different tie strength. Tie strength is a kind of closeness of relationships among people (Granovetter, 1973). If the tie strength is strong, it means that people have closer relationships, such as family and friends. In contrast, if people were not so familiar with or intimate to each other, the tie strength would be weak. However, with weak ties, people are able to get more diversified information from other people they seldom contact, such as people searching for jobs (Rindfleisch & Moorman, 2001). Moreover, Granovetter (1973) has argued that weak ties may also happen in the virtual community.
As members in virtual groups, they are possible to share their daily life, ask some advice, and receive some important information. Although they have frequent interaction in the virtual community, it is weak tie among them in the real world.
To LINE users, they not only have interaction with their close friends in daily life, but also communicate with other LINE users in the virtual community. Therefore, in this study, we discuss the influence from both strong ties in actual daily lives and weak ties in the virtual community on LINE users’ behavior intention to purchase LINE stickers.
19
Figure 5 Social Network Diagram 2.5.2 Measurement of Social Tie
The social tie is made by the relationships in social networks. To display levels of relationships, there are strong ties and weak ties. The strong ties exist among people’s frequent interaction during their daily life. Shen et al. (2010) considered that frequent interaction enhances the influence and attractiveness. Before consumers have actual purchase behavior, external influence may affect their purchase decision, such as the recommendation from immediate family members or close friends (Duhan et al. 1997).
Blackwell, Miniard and Engel (2001) are of the opinion that an individual would take familiar people as his or her reference group in order to help make decision. As LINE users interact with their family and friends in daily life, they generate the interest and the desire of purchasing LINE stickers, which would further lead to the behavioral intention.
The weak ties occur when people are looking for jobs or information that they could not get from people with strong tie (Duhan et al, 1997). However, according to
20
Granovetter’s study (1973), weak ties also appear in the virtual community. Connecting through the Internet and CMC, people can still have the effect of face-to-face conversation. (Shen et al., 2010). This kind of effect is called “social presence.” Social presence, as in face-to-face conversation, is emotional cognition that people get through transferred medium (Tamborini & Skalski, 2006). With various transferred medium sending messages, people may receive different degree of social presence. It depends on what kind of transferred medium to convey the information, such as language, texts, symbols, and non-verbal cues (Short, 1976; Westmyer, 1998). As to LINE users, they are able to use LINE stickers to express their emotions that they do not present in the real world, and through LINE stickers, they are seemed to on the scene (Donath, 2001).
Therefore, in this study, we will investigate LINE paid stickers bring about social presence to LINE users.
2.6 Attitude
According to behavior motivation studies (Babin, 1994; Fishbein & Ajzen, 1975; Kim & Han, 2011), attitude can be used to explain various behaviors generating in daily life and also predict future intention and behavior. Fishbein and Ajzen (1975) defined that an attitude can be seen as the tendency to respond the approval or disapproval with respect to a given object. Attitude is generated by past experience and impacted by current behavior, so they can be considered as a long learning process, but in the meantime, actual behavior will be also consistent with attitude (Lehrer et al., 2011). Attitude is broadly described an analysis as cognitive, affective, and conative.
Based on Wilkie’s study (1994), human behavior is a combination of three components: mental, emotional, and physical dimensions. The mental and emotional
21
components can be classified into cognition, affection, and conation (Rosenberg &
Hovland, 1960). While cognition is related to the individual’s perception about the object including people, products, brands, etc. (Holbrook, 1978), on the other hand, represents the personal feelings toward an object. According to Wilkie (1994), “affect”
can have or exhibit positive or negative feelings about the object. These positive and negative feelings are considered an essential aspect of their attitude. The third component, conation, refers to a tendency to act, which is the potentiality that an individual will show an action or behavior (Wilkie, 1994). Conation is an expression of the consumer’s intention, and the intention represents the possibility of acting in a certain manner. In short, these three components, cognition, affection, and conation, reflect attitude which is a significant explanation as to consumers’ thoughts, feelings, and behaviors.
2.7 Desire
In psychology, desire is featured of urges, cravings, enthusiasm, and so on (Loewenstein, 1996; Rook, 1987; Rook & Fisher, 1995). Perugini and Bagozzi (2004) mentioned that desire is a personal motivation that will lead to take an action or achieve goals, and desire appears when people hope their demands can be satisfied. Desire will bring about motivation, result in intention, and finally cause actual behavior.
Furthermore, influenced by desire, attitude and past experience would work upon intention (Bagozzi, 1992).
According to the prior study (Taylor et al., 2005), desire is a necessary mediator in attitude, anticipated emotions, subjective norms, perceived behavioral control, and behavioral intention. Although attitude, anticipated emotions, subjective norms, and perceived behavioral control would affect actual behavior, they do not directly have
22
influence on motivation then to the consequent behavior (Faulhaber & Luft, 1998;
Bagozzi, 1992; Calder & Ross, 1973). Even though one has positive attitude toward some behavior, he or she needs an essential motivation to cause the behavior. Therefore, positive attitude would stimulate desire, which would result in behavior; however, negative attitude is about to weaken desire to cause behavior.
2.8 Behavioral Intention
Intention is a restrictive declaration of behavior and also an expectation of behavior, which can be used to predict doing some actions (Howard & Sheth, 1969).
Fishbein and Ajzen (1980) posit that behavioral intention is a possibility or a tendency that an individual is going to carry on a clear activity or action to an object. In other words, people would show signs of deciding to do an action before actually doing the action. Therefore, behavioral intention is the antecedent of actual behavior. When the behavioral intention is getting stronger, the possibility of actual behavior would become greater (Venkatesh et al., 2008).
By measuring behavioral intention, one can increase the accuracy of forecasting behavior. Oliver (1980) thinks that behavioral intention is affected by attitude, and attitude is impacted by perception, so consumers’ product evaluation and judgment would have an influence on behavioral intention. Behavioral intention is formed by consumers’ subjective consciousness. When behavioral intention is used to predict consumer behavior, consumers would depend on their past experience to do the process of purchase decision and have expectation on products and service. That is why behavioral intention is based on consumers’ subjective feelings to carry out a tendency of possible behavior and to predict consumer future behavior.
23
III. Research Method
3.1 Research Model and Hypotheses
The main purpose of this study is to find out the effect of perceived value and social tie on attitude, desire and behavioral intention to purchase LINE stickers.
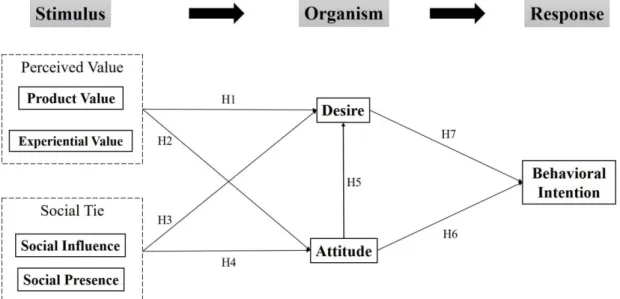
According to the research background, motivation and the literature review, this study proposed the model as shown in Figure 6.
Figure 6 Research Model
In this study, we utilize SOR theory as the theoretical background for constructing the research model (see Figure 6). We assert that desire and attitude are determined by perceived value and social tie, including product value, experiential value, social influence, and social presence. Furthermore, desire was found to mediate the impact of attitude and behavioral intention.
In the consumption process, consumers make purchase decisions depending on their perceived value. Zeithaml (1988) mentioned that perceived value is an overall assessment which a consumer evaluates a product according to price, quality, and
24
purchase experience. The higher value the customer perceived, the stronger desire of purchasing he or she may get, and then it impacts on his or her intention to purchase (Perugini & Bagozzi, 2004). Perceived value is a long-term influence on consumer behavior, and it would turn into a kind of criterion or standard in their mind. In addition, purchase experience is another way to evaluate the value of the product in consumption process. Therefore, we infer that consumers should demonstrate greater behavioral intention to purchase under conditions of higher perceived value that is built via consumers’ strong desire of purchasing the product. Thus we offer the following hypotheses:
H1a. Product value has a positive effect on desire of purchasing LINE paid stickers.
H1b. Experiential value has a positive effect on desire of purchasing LINE paid stickers.
Holbrook (1994) mentioned that an individual’s preference may impact the attitude when making a purchase decision. Also, the appearance and performance of products is possible to impact consumers’ impression on products or service, so that they will have positive or negative attitude to the product or service, leading to the change of purchase decision (Mathwick, Malhotra, & Rigdon, 2002). Combining their own preference and the design of LINE paid stickers, LINE users have good impression on paid stickers and have positive attitude of purchasing paid stickers. Therefore, we propose the following hypotheses:
H2a. Product value has a positive effect on attitude of purchasing LINE paid stickers.
H2b. Experiential value has a positive effect on attitude of purchasing LINE paid stickers.
Members in social networks are linked together because of the ties and the relationships. Tie strength is used to explain the degree of relationships in social
25
networks. Strong ties exist with the relationships among family and friends (Duhan et al. 1997), and weak ties refers to members in the virtual community (Granovetter, 1973).
With social interaction, people in the real world and the virtual community may become an individual’s reference groups and then have some influences on the individual’s desire of purchase (Shen et al., 2010; Blackwell, Miniard, & Engel, 2001). In this study, we posit that the LINE user’s desire to purchase LINE paid stickers will be affected by their social reference groups. Therefore, we propose the following hypotheses:
H3a. Social influence has a positive effect on desire of purchasing LINE paid stickers.
H3b. Social presence has a positive effect on desire of purchasing LINE paid stickers.
According to Tamborini and Skalski (2006)’s research, social interaction is another external factor to influence people’s decision-making. Interacting with other users who have similar preference can help make purchase decisions and evaluate diverse options. Gefen and Straub (2003) have argued that social ties might help user increase the attitude since it is not only a builder of positive attitude toward products but also a promoter of behavioral intention. Thus, social ties have a precedent role in user attitude about recommender systems and affect user intention to purchase and decision making (Gefen & Straub, 2003). According to the tie strength, it can be divided into social influence (i.e. Strong tie) and social presence (i.e. weak tie) to discuss the effects of social tie on user attitude of purchasing LINE paid stickers. Thus we propose the following hypotheses:
H4a. Social Influence has a positive effect on attitude of purchasing LINE paid stickers.
H4b. Social presence has a positive effect on attitude of purchasing LINE paid
26
stickers.
Based on behavior motivation studies (Babin, 1994; Fishbein & Ajzen, 1975;
Kim & Han, 2011), attitude can be used to explain various behaviors generated in daily life and also predict future intention and behavior. Fishbein and Ajzen (1975) defined that an attitude can be seen as the tendency to respond the approval or disapproval with respect to a given object. Attitude is broadly composed of cognition, affection, and conation. These three have a significant connection to user intention, and the intention will bring about actual behavior in a certain manner. Furthermore, Perugini and Bagozzi (2004) mentioned that desire is a kind of motivation and may lead to the generation of behavioral intention and the actual behavior. Thus we propose the following hypotheses:
H5. Attitude has a positive effect on desire of purchasing LINE paid stickers.
H6. Attitude has a positive effect on behavioral intention to purchase LINE paid stickers.
H7. Desire has a positive effect on behavioral intention to purchase LINE paid stickers.
27
3.2 Construct Definition
According to the literature review and research model of this study, we summarize the construct definition for all relevant variables.
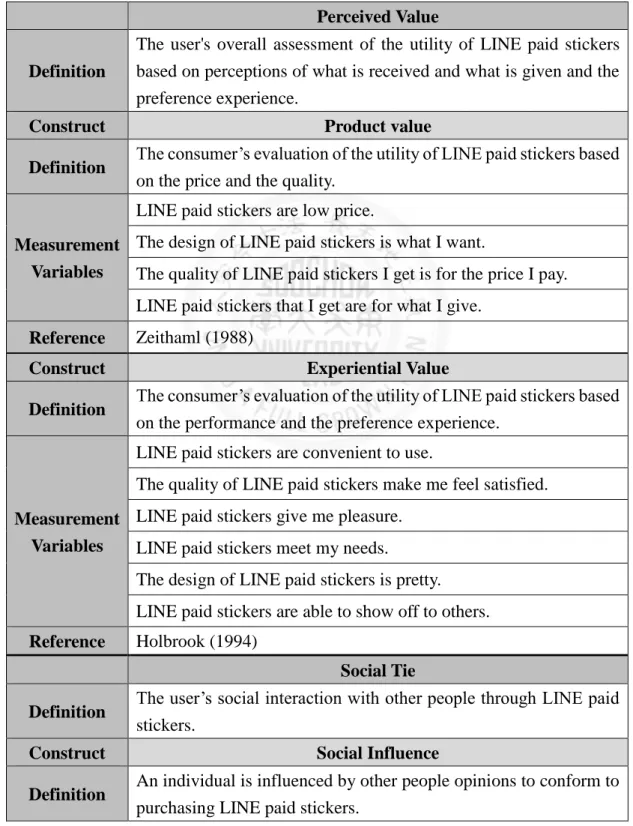
Table 3 Construct Definitions Perceived Value
Definition
The user's overall assessment of the utility of LINE paid stickers based on perceptions of what is received and what is given and the preference experience.
Construct Product value
Definition The consumer’s evaluation of the utility of LINE paid stickers based on the price and the quality.
Measurement Variables
LINE paid stickers are low price.
The design of LINE paid stickers is what I want.
The quality of LINE paid stickers I get is for the price I pay.
LINE paid stickers that I get are for what I give.
Reference Zeithaml (1988)
Construct Experiential Value
Definition The consumer’s evaluation of the utility of LINE paid stickers based on the performance and the preference experience.
Measurement Variables
LINE paid stickers are convenient to use.
The quality of LINE paid stickers make me feel satisfied.
LINE paid stickers give me pleasure.
LINE paid stickers meet my needs.
The design of LINE paid stickers is pretty.
LINE paid stickers are able to show off to others.
Reference Holbrook (1994)
Social Tie
Definition The user’s social interaction with other people through LINE paid stickers.
Construct Social Influence
Definition An individual is influenced by other people opinions to conform to purchasing LINE paid stickers.
28
Measurement Variables
I often consult other people to help choose LINE paid stickers.
It is important what my friends or colleagues think about how I use LINE paid stickers.
The fact I use LINE paid stickers makes a good impression on other people.
I use LINE paid stickers under the expectations of my friends and colleagues.
I achieve a sense of belonging with my friends and colleagues by using LINE paid stickers.
Reference Li (2013)
Construct Social Presence
Definition The degree to which a user perceives that LINE paid stickers convey feelings of human contact, sociability, warmth, and sensitivity.
Measurement Variables
I can imagine how other LINE users may look like by interacting with them through LINE paid stickers.
I can feel a kind of human touch when interacting with LINE users through LINE paid stickers.
Communicating with other LINE users through LINE paid stickers makes me feel warm.
I can feel a kind of relationships with LINE users when interacting with them through LINE paid stickers.
I can feel a kind of human sensitivity when interacting with LINE users through LINE paid stickers.
Reference Lu, Fan & Zhou (2016)
Construct Attitude
Definition A positive state resulting from an evaluation of LINE paid stickers.
Measurement Variables
Using LINE paid stickers is helpful for communication.
I feel comfortable in using LINE paid stickers.
I like to use LINE paid stickers.
I have a positive attitude toward LINE paid stickers.
It is easy to purchase LINE paid stickers.
Using LINE paid stickers is able to enhance the quality of life or work.
29
Using LINE paid stickers make me happy.
Reference Al-Emran, Elsherif & Shaalan (2016); Lien & Cao (2014); Li (2013)
Construct Desire
Definition A strong motivation of purchasing LINE paid stickers.
Measurement Variables
I want to collect some particular LINE paid stickers.
I want to use some particular LINE paid stickers.
I want to give some particular LINE paid stickers to other users.
Reference Kim, Chan & Kankanhalli (2012)
Construct Behavioral Intention
Definition The user would like to purchase LINE paid stickers in the future.
Measurement Variables
I would intend to buy LINE paid stickers.
I would consider buying LINE paid stickers.
I would plan to buy LINE paid stickers.
I predict I would buy LINE paid stickers in the future.
Reference Chen, Teng, Yu & Yu (2016); Wang, Yeh & Liao (2013)
3.3 Data Collection
The research data is collected from an online Internet questionnaire. The subjects are people in Taiwan that had the experiences of downloading free LINE stickers and purchasing LINE paid stickers from the LINE Sticker Shop.
The questionnaire of this study is preliminary designed into four parts. The first part of the questionnaire is perceived value. The second part is about social tie. The third part is designed to measure the questions of attitude, desire, and behavioral intention. The last part is demographic information, including gender, age, education levels, occupation, monthly income, platform of smartphone, experiences in the use of LINE, purchase period for LINE paid stickers, expenditure for LINE paid stickers, and
30
so on. A five-point Likert scale, ranging from 1 to 5 (strongly disagree to strongly agree), is adopted in this study.
3.4 Statistical Analysis Method
In order to detect and verify the SOR model in this study, we used the statistical analysis of Statistical Package for Social Science (SPSS) and the SmartPLS computer programs to test the hypotheses. Therefore, we conducted the descriptive statistics, reliability and validity analyses.
3.4.1 Descriptive analysis
In order to gain a better understanding of the characteristics of each constructs, descriptive statistics was used to illustrate means, standard deviation for all the research constructs in this study.
3.4.2 Reliability & Validity Analyses
Reliability and validity analyses are two technical properties of a test that indicate the quality and usefulness of the measurement. In this study, to detect the reliability of the questionnaire, we used Composite Reliability (CR), Cronbach’s α, and Average Variance Extracted (AVE). When the value of both CR and Cronbach’s α is greater than 0.7, it refers to high reliability. As the value of them is less than 0.35, it means low reliability. If the value of both CR and Cronbach’s α is in the range of 0.35 to 0.7, it would be acceptable (Hair et al., 1992). In addition, the value of AVE is used to states how much variance captured by the latent variable in a structural equation model which is shared among other variables. For each construct, the AVE should be greater than
31
0.5 (Fornell & Larcker, 1981).
As to validity test, we conducted convergent and discriminant validity. These two are commonly regarded as subsets of construct validity, and they are recognized to work together. Convergent validity means that measures of constructs should be related to each other; discriminant validity refers to measures of constructs that should not be related to each other. If the results of the validity test show a correspondence or convergence between similar constructs and discrimination between dissimilar constructs, this indicates that the questionnaire is valid.
32
IV. Results
4.1 Samples
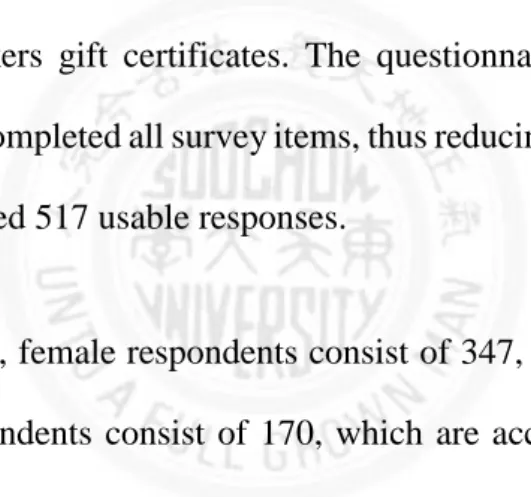
An announcement of the survey goals was posted for 14 days on heavily trafficked web sites such as Facebook (www.facebook.com) and PTT Bulletin Board System (https://www.ptt.cc), along with a hyperlink to the survey. At any time during the two weeks, when this study was being conducted, online participants could respond to the online questionnaire by linking the survey URL provided in the message. Participants who submitted valid questionnaires were entered into a drawing to receive one of 30 NT$60 LINE paid stickers gift certificates. The questionnaire included prompts to ensure the respondents completed all survey items, thus reducing invalid responses. The final online survey yielded 517 usable responses.
Of 517 respondents, female respondents consist of 347, which are accounted for 67.12%, and male respondents consist of 170, which are accounted for 32.88% (see Table 4).
Table 4 Genders
Gender Frequency Percent (%)
Female 347 67.12%
Male 170 32.88%
Total 517 100.00%
In a total of 517 respondents, 108 respondents were under 20 years old (20.89%);
316 respondents were between the age of 21 to 25 (61.12%); 43 respondents were
33
between the age of 26 to 30 (8.32%); 22 respondents were between the age of 31 to 35 (4.26%); 12 respondents were between the age of 36 to 40 (2.32%); 4 respondents were between the age of 41 to 45 (0.77%); another 4 respondents were between the age of 46 to 50 (0.77%), and 8 respondents were over 50 years old (1.55%)(see Table 5).
Table 5 Ages
Age Frequency Percent (%)
Under 20 108 20.89%
21-25 316 61.12%
26-30 43 8.32%
31-35 22 4.26%
36-40 12 2.32%
41-45 4 0.77%
46-50 4 0.77%
Over 50 8 1.55%
Total 517 100.00%
In a total of 517 respondents, 1 respondents’ education levels were in junior high school or less (0.19%); 28 respondents’ education levels were in high school (5.42%);
386 respondents have bachelor’s degree (74.66%), and 102 respondents have graduate degree (19.73%)(see Table 6).
34
Table 6 Education Levels
Education Frequency Percent (%)
Junior high school or less 1 0.19%
High school 28 5.42%
Bachelor’s degree 386 74.66%
Graduate degree 102 19.73%
Total 517 100.00%
In a total of 517 respondents, most were students, 367 respondents (70.99%); the second most were 36 business people (6.96%); 32 respondents work in service industry (6.19%); 24 respondents work for military and government (4.64%); 20 respondents were self-employed builders (3.87%); 16 respondents worked in industrial companies (3.09%), and 22 respondents belonged to other industries (4.26%)(see Table 7).
Table 7 Occupations
Occupation Frequency Percent (%)
Students 367 70.99%
Business 36 6.96%
Service industry 32 6.19%
Military and government 24 4.64%
Self employed 20 3.87%
Industrial 16 3.09%
Others 22 4.26%
Total 517 100.00%
In a total of 517 respondents, there are 202 respondents whose monthly income is
35
under NT$5,000 (39.07%); 136 respondents’ monthly income were between NT$5001 to NT$10,000 (26.31%); 48 respondents’ monthly income were between NT$10,001 to NT$20,000 (9.28%); 50 respondents’ monthly income wee between NT$20.001 to NT$30,000 (9.67%); 40 respondents’ monthly income were between NT$30,001 to NT$40,000 (7.74%), and 41 respondents’ monthly income were over NT$40,001 (7.93%)(see Table 8).
Table 8 Monthly Incomes
Monthly Income Frequency Percent (%)
Under NT$5,000 202 39.07%
NT$5,001~10,000 136 26.31%
NT$10,001~20,000 48 9.28%
NT$20,001~30,000 50 9.67%
NT$30,001~40,000 40 7.74%
Over NT$40,000 41 7.93%
Total 517 100.00%
As to platforms of smartphone, Android users made up 57.83% of a total of 517 respondents; iOS users made up 41.20% of a total of 517 respondents, and only 0.97%
of a total of 517 respondents used Windows Phone (see Table 9).
Table 9 Platforms
Platform Frequency Percent (%)
Android 299 57.83%
iOS 213 41.2%
Windows Phone 5 0.97%
Total 517 100.00%
36
In a total of 517 respondents, most of them had more than three-year experience in using LINE, a total of 343 (66.34%); some respondents had two-to-three-year experience in using LINE, a total of 138 (26.69%); other respondents had one-to-two- year experience in using LINE, a total of 27 (5.22%), and the other respondents had no more than one year experience in using LINE, a total of 9 (1.74%)(see Table 10).
Table 10 Experience in Using LINE
Experience in Using LINE Frequency Percent (%)
Under 1 year 9 1.74%
1-2 years 27 5.22%
2-3 years 138 26.7%
Over 3 years 343 66.34%
Total 517 100.00%
As regard to purchase period for LINE paid stickers, 82 people who bought in a period of one year made up 15.86% of a total of 517 respondents; 98 people buying in a period of 6 month made up 18.96% of a total of 517 respondents; 121 people buying in a period of 3 month made up 23.40% of a total of 517 respondents; 72 people buying in a period of 1 month made up 13.93% of a total of 517 respondents, 15 people buying in a period of 1 to 2 weeks made up 2.90% of a total of 517 respondents, and 129 people never purchasing LINE paid stickers made up 24.95% of a total of 517 respondents (see Table 11).
37
Table 11 Purchase Period for LINE Paid Stickers Purchase Period for
LINE Paid Stickers Frequency Percent (%)
Never 129 24.95%
1-2 weeks 15 2.90%
1 month 72 13.93%
3 months 121 23.40%
6 months 98 18.96%
1 year 82 15.86%
Total 517 100.00%
In a total of 517 respondents, 129 users never buy LINE paid stickers (24.95%);
252 users averagely spent NT$30 to NT$60 to buy LINE paid stickers in each purchase (48.74%); 82 users averagely spent NT$61 to NT$100 to buy LINE paid stickers in each purchase (15.86%); 30 users averagely spent NT$101 to NT$150 to buy LINE paid stickers in each purchase (5.80%), and 24 users averagely spent over NT$151to buy LINE paid stickers in each purchase (4.64%)(see Table 12).
Table 12 Expenditure for LINE Paid Stickers Expenditure for LINE
Paid Stickers Frequency Percent
Never 129 24.95%
NT$30~60 252 48.75%
NT$61~100 82 15.86%
NT$101~150 30 5.80%
Over NT$150 24 4.64%
Total 517 100.00%
38
Before conducting the questionnaire, we mentioned that LINE users who have purchase experience of paid stickers are very few according to the statistics in 2012.
However, the demographic profile shows that more than half of respondents have ever purchased LINE paid stickers, which is inconsistent with the results of the 2012 statistics. About this phenomenon, we implied that student respondents who do not have highly income but spent NT$30 to NT$60 in every three months on paid stickers caused the results.
4.2 Descriptive Statistics
In this study, we used the five point Likert scale to measure people’s agreement of each construct. According to those useable responses, the averages of each item are higher than 3, which means that respondents agreed on all of items of constructs. Table 13 shows the result of the descriptive statistics.
Table 13 Descriptive Statistics Construct Construct
Means S.D. Item Item
Means
Product Value (PV) 3.20 0.76
PV1 3.02
PV3 3.52
PV4 3.06
Experiential Value (EV) 4.15 0.61
EV1 4.07
EV2 3.82
EV3 4.28
EV4 4.42
Social Influence (SI) 3.29 0.85
SI2 3.62
SI3 3.30
SI4 2.99
SI5 3.26
Social Presence (SP) 3.53 0.79 SP1 4.03
39
Construct Construct
Means S.D. Item Item
Means
SP2 3.61
SP3 3.54
SP4 3.45
SP5 3.01
Attitude (AT) 3.46 0.83
AT2 3.53
AT3 3.20
AT4 3.65
Desire (DS) 3.56 0.92
DS1 3.55
DS2 3.82
DS3 3.30
Behavioral intention
(INT) 3.73 0.97
INT1 3.73
INT2 3.88
INT3 3.50
INT4 3.82
4.3 Measurement Model
Before conducting the main survey, we performed both a pre-test and a pilot test to validate. The pre-test involved 7 respondents who were experienced LINE paid stickers users. The respondents were asked to comment on a list of items related to the constructs, including the wording of the scales, the length of the instrument, and the format of the questionnaires. Finally, to reduce possible ambiguity, a pilot test was administered to 115 respondents selected from a population of LINE users. The results of pilot test showed acceptable reliability and validity of the measurements (see Table 14 and 15).
40
Table 14 Reliability Analyses (pilot test)
CR (>0.7) Cronbach's α (>0.7) AVE (>0.5)
PV 0.854 0.774 0.594
EV 0.933 0.919 0.608
SI 0.903 0.855 0.700
SP 0.914 0.881 0.680
AT 0.914 0.888 0.640
DS 0.896 0.824 0.743
INT 0.965 0.952 0.875
(PV: product value; EV: experiential value; SI: social influence; SP: social presence;
AT: attitude; DS: desire; INT: behavioral intention)
Table 15 Discriminant Validity (pilot test)
PV EV SI SP AT DS INT
PV 0.800
EV 0.657 0.862
SI 0.722 0.585 0.780
SP 0.722 0.682 0.569 0.935
AT 0.704 0.503 0.683 0.647 0.771
DS 0.683 0.395 0.580 0.404 0.512 0.837
INT 0.616 0.393 0.728 0.346 0.553 0.663 0.825
(PV: product value; EV: experiential value; SI: social influence; SP: social presence;
AT: attitude; DS: desire; INT: behavioral intention)
4.3.1 Reliability Analysis
To assess the constructs for reliability, we did composite reliability (CR),
41
Cronbach’s α, and Average Variance Extracted (AVE) to detect. The CR and Cronbach’s α for all constructs should exceed than 0.7 (Hair et al., 1992). AVE is the average amount of variance in indicator variables that a construct is managed to explain. Fornell and Larcker (1981) proposed that the AVE for each construct should be greater than 0.5.
Therefore, as shown in Table 16, the results of the test are up to their standards, and the reliability for the constructs was adequate.
Table 16 Reliability Analyses
CR (>0.7) Cronbach's α (>0.7) AVE (>0.5)
PV 0.866 0.767 0.683
EV 0.871 0.803 0.628
SI 0.894 0.842 0.679
SP 0.904 0.866 0.656
AT 0.893 0.820 0.735
DS 0.872 0.777 0.696
INT 0.960 0.944 0.857
(PV: product value; EV: experiential value; SI: social influence; SP: social presence;
AT: attitude; DS: desire; INT: behavioral intention) 4.3.2 Construct Validity
We further assessed the constructs for convergent and discriminant validity.
Convergent validity can be used to estimate correlation coefficients. This correlation is generally referred to as a factor loading, which represents how much a factor explains a construct in factor analysis. Factor loadings are equivalent to correlation between factors and variables when only a single common factor is involved. The value of factor loadings should be greater than 0.45, and 0.55 is better (Tabachnick & Fidell, 2007).
42
As shown in Table 17, the values of factor loadings are greater than 0.55.
Table 17 Factor Loadings
(PV: product value; EV: experiential value; SI: social influence; SP: social presence;
AT: attitude; DS: desire; INT: behavioral intention)
PV EV SI SP AT DS INT
PV1 0.784 PV3 0.834 PV4 0.859
EV1 0.761
EV2 0.820
EV3 0.837
EV4 0.746
SI2 0.786
SI3 0.889
SI4 0.859
SI5 0.757
SP1 0.701
SP2 0.860
SP3 0.880
SP4 0.857
SP5 0.733
AT2 0.806
AT3 0.885
AT4 0.879
DS1 0.880
DS2 0.884
DS3 0.729
INT1 0.939
INT2 0.926
INT3 0.910
INT4 0.928