國 立 交 通 大 學
材 料 科 學 與 工 程 學 系
奈 米 科 技 碩 士 班
碩 士 論 文
利用蛋白質保護之奈米金探針與側流層析技術應用於
視覺辨識之快速可攜式汞離子偵測器
A rapid and portable sensor based on protein protected
gold nanoparticle probes and lateral flow assay for
naked eye detection of mercury ion
研 究 生 : 黃崇志
Chung-Chih Huang
指導教授 : 柯富祥 教授
Prof. Fu-Hsiang Ko
視覺辨識之快速可攜式汞離子偵測器
A rapid and portable sensor based on protein protected
gold nanoparticle probes and lateral flow assay for
naked eye detection of mercury ion
研 究 生:黃崇志
Student:Chung-Chih Huang
指導教授:柯富祥 教授
Advisor:Prof. Fu-Hsiang Ko
國 立 交 通 大 學
材 料 科 學 與 工 程 學 系
奈 米 科 技 碩 士 班
碩 士 論 文
A ThesisSubmitted to Institute of Nanotechnology Department of Materials Science and Engineering
College of Engineering National Chiao Tung University in partial Fulfillment of the Requirements
for the Degree of Master
in
Nanotechnology August 2010
Hsinchu, Taiwan, Republic of China
Acknowledgment
本篇論文得以順利完成,首先感謝柯富祥教授在學生的碩士生涯期間給予最 充份的指導,並提供豐富的實驗環境與資源,讓我們能無後顧之憂地全心專注於 實驗上,此外於學術外與生活上的關心,亦培養我們健全的人格,使我們不至於 在實驗之中迷失了自我,在專業領域及待人處事上都有均衡的發展。另外特別感 謝中書學長在實驗上的引領,讓我學習到思考要大膽創新,實驗小心嚴謹的研究 精神,並且給予許多建議讓本論文得以更加充實。 在碩班兩年生活中,實驗室充滿著歡笑和淚水:每個月都有開不完的生日 PARTY、許下無數個願望,從羽球場上揮灑汗水到游泳池裡的泡水,甚至忙裡偷 閒的小木屋下午茶時間等種種都是難忘的回憶…。感謝家典學長的照顧,平時就 像好朋友一樣有說有笑,但在實驗的嚴格要求,讓我們在進度上不敢馬虎;以及 俊淇、其昌、銘清學長在適時在實驗上給予協助。鄭捷學長是生活知識王,繁舉 新竹的食衣住行育樂有問必答,而且常常在忙的不可開交即時幫助我們,另外還 有京璋、伯軒學長,玟菲、嘉琪學姐們的照顧,讓我體會到實驗室就像家裡一樣 的溫暖。 感謝即將畢業的夥伴們,雖然常常要幫小丁收拾善後,但卻能從中學習如何 通過溝通,以及客觀的想法來解決問題,對於人際關係、作事態度屏除了先入為 主的觀念。妙語如珠的易成,在研究所考試相遇時就註定我們要當兩年的同學, 雖然我們把快樂建築在你的恐慌上,感謝你幫我大大分擔了諧星這種要的位置。 還有丁香以及"對阿!對阿!"的品樺,當初週末我們一起出遊的記憶依舊猶存呢 !感謝夥伴們這兩年的相處。未來碩班的主力將交棒給于菱、波妞、韋伶、狗狗 還有大軒你們啦,還有新血的注入下,相信會繼續延續Ko’ Lab 的活力與拼勁。 最後感謝我的家人,在經濟上、精神上的支持讓崇志能無慮的投入在研究當 中。為不負長輩們的期望,同時也獻給每位新竹的朋友們,僅能以此論文深深表 達的由衷感謝。利用蛋白質保護之奈米金探針與側流層析技術應用於
視覺辨識之快速可攜式汞離子偵測器
研究生:黃崇志 指導教授:柯富祥 教授
國立交通大學材料科學與工程學系 奈米科技碩士班
摘 要
近年來研究報告指出,利用奈米金粒子之獨特光學性質,已發展出具
高靈敏性、快速分析的汞離子偵測器。然而,這些樣品須在無鹽類水
溶液下檢測,以避免奈米金探針受干擾聚集進而失去偵測能力,同時
亦須仰賴紫外光-可見光分光儀及螢光光譜儀等儀器的輔助以達到定
量分析之目的。因此我們開發出一套嶄新且簡易操作的汞離子濃度偵
測技術:藉由包覆羧酸化蛋白質的奈米金探針即使在鹽類水溶液中仍
保有良好分散性之技術,結合側流層析法達到不須仰賴複雜儀器及專
業知識即可操作之系統來偵測水溶液中的汞離子。利用奈米金探針分
別滯留在硝化纖維薄膜上之檢測區所產生帶狀紅色區域作為視覺辨
識的訊號來源。相較於其他方法,此設計之拋棄式感測器兼具有低成
本、方便使用,以及快速、靈敏、污染物定量之工具等優點,在未來
A rapid and portable sensor based on protein protected
gold nanoparticle probes and lateral flow assay for
naked eye detection of mercury ion
Student: Chung-Chih Huang
Advisor: Prof. Fu-Hsiang Ko
Institute of Nanotechnology
National Chiao Tung University
Abstract
Recent progress in the laboratory has been a result of improvements in rapid analytical techniques and detection limits for sensing mercury ions (Hg2+) by using the unique optical property of gold nanoparticles (AuNPs). Unfortunately, the contaminated samples are only treated with aqueous solution in the cuvettes and must contain none of salts that could induce the AuNPs aggregation and losing the sensing abilities. Additionally, those experiment procedures for the analysis of metal ion should be operated by the assist of UV-Vis or fluorescence spectrophotometer. A new and simple method for determining the concentration of Hg2+ was developed. We designed the AuNP probes of carboxylic modified protein that could protect the AuNPs from aggregating even in the salinity solutions and employed the lateral flow assay to detect the Hg2+ without complicated instrumentations and technical expertise. The captured AuNP probes on the test zone and control zone of the sensor produced the characteristic red bands, enabling visual discrimination of Hg2+ concentrations.
The disposable sensor thus provides a low-cost, convenient, rapid, sensitive, and quantitative tool for the detection of contaminated samples. The demand of Hg2+ analysis in environmental applications requires parallel analytical strategies; such a method with simplicity and rapidity will find wide use in the future.
Contents
Acknowledgment
... iAbstract in Chinese
... iiAbstract in English
... ivContents
... viList of Tables
... viiiList of Figures
... ixChapter 1: Introduction
... 11.1 General Introduction ... 1
1.2 Nanomaterials ... 2
1.3 Gold Nanoparticles ... 3
1.4 Lateral Flow Assay ... 7
Chapter 2: Literatures Review
... 102.1 Gold Nanoparticles Background ... 10
2.1.1 Turkevich Method ... 11
2.1.2 Brust-Schiffrin Method ... 13
2.2 Applications of Gold Nanoparticle Probes ... 14
2.2.1 DNA detection ... 15
2.2.2 Small Molecules Detection ... 20
2.2.3 Mercury Ion Detection ... 24
2.3 Application of Lateral Flow Strip ... 27
2.4 Motivation ... 29
Chapter 3: Experiments
... 313.1 General Introduction ... 31
3.1.1 Reagents ... 31
3.1.2 Instrument ... 33
3.2 Gold Nanopaticles and Probes Preparation ... 34
3.2.1 Prepare AuNPs ... 34
3.2.2 Prepare AuNP probes ... 35
3.3 Protein Modification and Quantification ... 35
3.4 Silicon Substrate Modification... 37
Chapter 4: Results and Discussions
... 404.1 Preparation of AuNPs ... 40
4.2 Preparation of AuNPs for Hg2+ sensing ... 43
4.2.1 The sensing model in the solutions ... 43
4.2.2 The sensing model on the substrates ... 49
4.3 The AuNP probes by protein coverage ... 53
4.4 Detection Hg2+ by lateral flow assay ... 62
Chapter 5: Conclusion
... 66List of Tables
Table 2.1 ... 15
Inorganic nanoparticles couple with biomolecules.
Table 4.1 ... 41
Various concentrations of trisodium citrate added to 10 mL HAuCl4 (1 mM) and
the max absorbance related with the size of AuNPs.
List of Figures
Chapter 1: Introduction
Figure 1.1 ... 3
Sizes, shapes, and compositions of metal nanoparticles can be systematically varied to produce materials with distinct light-scattering properties.
Figure 1.2 ... 5
Origin of surface plasmon resonance due to coherent interaction of the electrons in the conduction band with light.
Figure 1.3 ... 6
Different shapes of AuNPs.
Figure 1.4 ... 6
The absorption of AuNPs at various sizes and shapes.
Figure 1.5 ... 9
(A) Typical configuration of lateral flow assay test strip. (B) Competitive assay. (C) Sandwich assay.
Chapter 2: Literatures Review
Figure 2.1 ... 10
The Lycurgus Cup dates from Roman times. The glass appears green in daylight (reflected light), but red when light is transmitted from the inside of the vessel.
Figure 2.2 ... 12
The multi-step mechanism of AuNPs formation. Large aggregation occurs to nano-scale particles once gold atoms forming. The remnant citrate ions absorbed by particle surface provide negative repulsion from further aggregation.
Figure 2.3 ... 13
AuNPs synthetic mechanism show the reaction transfer between water and toluene phase.
Figure 2.4 ... 13
TEM pictures of the thiol derivatised AuNPs at (A) low and (B) high magnification.
Figure 2.5 ... 15
General schematic representation of methods to couple inorganic nanoparticles and biomolecules (FG: functional coupling group). Representative structures of typical linkers are listed beneath (see also Table 2-1).
Figure 2.6 ... 16
The mechanism of DNA modified AuNP probe for sensing.
Figure 2.7 ... 16
Schematic of the concept for aggregation signaling hybridization of AuNPs-oligonucleotide probe conjugates with oligonucleotide target molecules.
Figure 2.8 ... 17
Scanometric detection of nucleic acids in DNA chip analyses. Capture oligonucleotides are immobilized on glass slides and used for the specific binding of target nucleic acids and finally use a silver enhancement step.
Figure 2.9 ... 18
(A) Scheme showing concept behind electrical detection of DNA. (B) Sequences of capture, target, and probe DNA strands. (C) Optical microscope images of the electrodes used in a typical detection experiment. The spot in the electrode gap in the high-magniÞcation image is food dyespotted by a robotic arrayer.
Figure 2.10 ... 18
Resistance of the electrode arrays measured as a function of increasing silver enhancing time (A) without and (B) with washing with 0.01 M PBS at room temperature before silver enhancing.
Figure 2.11 ... 19
Nanoparticles functionalized with oligonucleotides and Raman labels, coupled with surface-enhanced Raman scattering (SERS) spectroscopy, can be used to perform multiplexed detection of oligonucleotide targets.
The Raman spectra of six dye-labeled nanoparticle probes after Ag enhancing on a chip (after background subtraction). Each dye correlates with a different color in our labeling scheme.
Figure 2.13 ... 21
(A) Hydrogen-bonding recognition between melamine and cyanuric acid derivative. (B) Colorimetric detection of melamine using the MTT stabilized gold nanoparticles.
Figure 2.14 ... 22
(A) Concentration-dependent extinction spectra for the MTT-stabilized AuNPs under the optimized conditions. (B) The corresponding plot of A700/A519 versus
melamine concentration.
Figure 2.15 ... 23
(A) D-A interaction between cysteamine and TNT. (B) Assay for direct colorimetric visualization of TNT based on the electron D-A interaction at the Au NP/solution interface.
Figure 2.16 ... 23
(A) Colorimetric visualization of TNT by using AuNP probe. TNT concentrations varied from 5 x 10-13 M (2) to 5 x 10⁻⁹ M (6). (B) UV-Vis spectra of the AuNP probes in the presence of different concentrations of TNT: red, 0 M; dark yellow, 5 x 10-13 M; yellow, 5 x 10-12 M; magenta, 5 x 10-11 M; cyan, 5 x 10⁻¹⁰ M; blue, 5 x 10⁻⁹ M.
Figure 2.17 ... 25
The complex of Hg2+ coordinates with thymidine.
Figure 2.18 ... 25
Colorimetric detection of mercuric ion (Hg2+) using DNA-AuNPs.
Figure 2.19 ... 26
The mechanism of MPA/AuNPs aggregation had been driven by heavy metal ion recognition and binding.
Figure 2.20 ... 26
the MPA/AuNPs in the absence and presence of PDCA (1.0 mM) after the addition of 100 mM metal ions in 50 mM Tris-borate solutions (pH 9.0).
Figure 2.21 ... 27
Schematic representation of (A) MPA/AMP- and (B) MPA-capped AuNPs that are present in the salt solution.
Figure 2.22 ... 27
(A) Effect of AMP concentration on the absorption ratio (A620/520) of
MPA/AMP-capped AuNPs upon the addition of different concentrations of PBS. (B) Plot of the absorption ratio (A620/520) against the incubation time of
MPA/AMP-capped AuNPs with 10 μM Hg2+.
Figure 2.23 ... 28
Schematic illustration of the DNAB.
Figure 2.24 ... 29
Assayed standard toxin concentration range of the strip test. C: control line, T: test line. 1: PBS solution, 2-9: toxin in PBS, the concentrations of the toxin were 1.0, 10, 50, 100, 500, 1000, 2000, 4000 ng/ mL.
Chapter 3: Experiments
Figure 3.1 ... 34
Schematic steps show the preparation of AuNPs.
Figure 3.2 ... 36
The procedure that succinylation of BSA.
Figure 3.3 ... 37
The procedure of protein quantification.
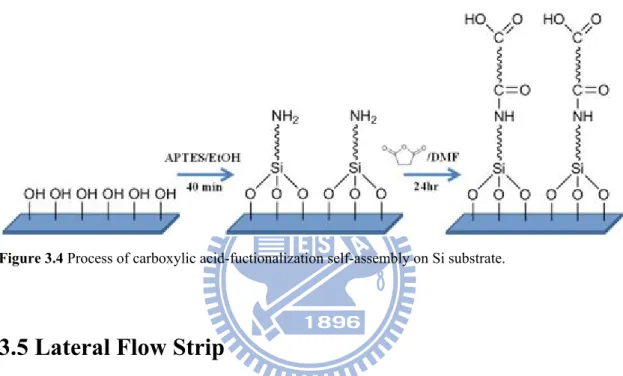
Figure 3.4 ... 38
Process of carboxylic acid-fuctionalization self-assembly on Si substrate.
Figure 3.5 ... 39
Chapter 4: Results and Discussions
Figure 4.1 ... 40
UV-Vis absorption spectrum of aqueous AuNPs. The concentration of AuNPs is 7.5 nM.
Figure 4.2. ... 42
UV-Vis absorption spectrum of aqueous AuNPs in the different size.
Figure 4.3 ... 42
SEM images showed the different size of AuNPs: (A) 13 nm, (B) 25 nm, (C) 37 nm, (D) 50 nm, (E) 70 nm.
Figure 4.4 ... 44
UV-Vis absorbance spectra that (A) the dispersive MPA/AuNPs and (B) aggregated MPA/AuNPs in the presence Hg2+ displayed the red-shift signals from 518 nm to 650 nm. And the picture showed below.
Figure 4.5 ... 44
UV-Vis spectra illustrated the absorbance of vicissitudes MPA/AuNPs aggregated after Hg2+ ions addition with time interval.
Figure 4.6 ... 46
(A) The A650/A518 responses of MPA/AuNPs after addition of various
concentrations of Hg2+ ions (1 μM ~ 10 μM) with various incubation time (10 minutes, 20 minutes, 30 minutes). (B) The samples that changed the colors at the titrating different Hg2+ concentrations.
Figure 4.7 ... 46
The A650/A518 responses of MPA/AuNPs after addition of various concentrations
of Hg2+ ions (1 μM ~ 10 μM) compared with 30 minutes and 24 hours of incubation.
Figure 4.8 ... 47
The A650/A518 responses of MPA/AuNPs after centrifugation with various
incubation time (10 minutes, 20 minutes, 30 minutes).
Figure 4.9 ... 48
in different range of Hg2+.
Figure 4.10 ... 48
Two concentrations of MPA/AuNPs showed A650/A518 responses of MPA/AuNPs
in different range of Hg2+ ions after centrifugation.
Figure 4.11 ... 50
SEM images of silicon substrates with carboxylic acid linkage immersed (A) AuNPs, (B) MPA/AuNPs, (C) Hg2+/ MPA/AuNPs, (D) Hg2+/ MPA/AuNPs with tris-buffer.
Figure 4.12 ... 50
The mechanism of MAP-AuNPs coupling in the presence of Hg2+ ions.
Figure 4.13 ... 52
SEM images of silicon substrates modified carboxylic group treated Hg2+/ MPA/AuNPs mixed tris-buffer with different incubation time: (A) 10 minutes, (B) 20 minutes, (C) 40 minutes, (D) 80 minutes.
Figure 4.14 ... 53
SEM images of silicon substrates modified carboxylic group treated Hg2+/ MPA/AuNPs without tris-buffer with different incubation time: (A) 10 minutes, (B) 20 minutes, (C) 40 minutes, (D) 80 minutes.
Figure 4.15 ... 54
A650/A518 responses of MPA/AuNPs and BSA/AuNPs (7.5 nM) with time
interval after addition of NaClO4 (1 mM).
Figure 4.16 ... 55
The diagram of determining the optimum BSA concentration to cover on the AuNPs surface by monitoring the absorbance of AuNPs.
Figure 4.17 ... 56
(A) Plots of changes in the A650/A518 ratios with time-dependent for AuNPs
combining with variate in the BSA concentration after adding NaClO4 solution: (1)
5.02 x 10⁻⁷ M, (2) 1.26 x 10⁻⁷ M, (3) 9.41 x 10⁻⁸ M, (4) 4.71 x 10⁻⁸ M, (5) 3.13 x 10⁻⁸ M,
(6) 2.35 x 10⁻⁸ M, (7) 1.57 x 10⁻⁸ M. (B) Plot of the absorption ratio (A518/A620) in
Figure 4.18 ... 56
Plot of the absorption ratio (A518/A620) in equilibrium versus the BSA
concentration.
Figure 4.19 ... 57
Plots of changes in the A650/A518 ratios with time-dependent for AuNPs
combining with variate in the BSA-biotin concentration after adding NaClO4 solution:
(A) 1.0 x 10⁻⁵ M, (B) 3.77 x 10⁻⁶ M, (C) 1.26 x 10⁻⁶ M, (D) 4.71 x 10⁻⁷ M, (E) 1.57 x 10⁻⁷ M, (F) 5.88 x 10⁻⁸ M, (G) 1.96 x 10⁻⁸ M.
Figure 4.20 ... 57
Plot of the absorption ratio (A518/A620) in equilibrium versus the BSA-biotin
concentration.
Figure 4.21 ... 58
Scheme of the mechanism for the reaction between TNBSA with amino residues. The final product of trinitrophenylamine contained strong absorbance at 340 nm.
Figure 4.22 ... 59
UV-Vis absorption spectra of lysine-TNBSA derivative that was different concentration of lysine to react TNBSA and exhibited strong absorption at 340 nm: (A) 0 M, (B) 3.42 x 10⁻⁵ M, (C) 6.84 x 10⁻⁵ M, (D) 1.03 x 10⁻⁴ M, (E) 1.37 x 10⁻⁴ M, (F) 1.71 x 10⁻⁴ M, (G) 2.05 x 10⁻⁴ M, (H) 2.39 x 10⁻⁴ M. Inset: Plot of A340 of
lysine-TNBSA derivative as a function of the lysine concentration.
Figure 4.23 ... 60
UV-vis absorption spectra of samples: (A) 2.39 x 10⁻⁴ M lysine, (B) 3.0 x 10⁻⁶ M BSA with A340 = 0.7716, (C) 3.0 x 10⁻⁶ M BSA-biotin with A340 = 0.6681, (D) 3.0 x
10-6 M BSA after succinylation, (E) 3.0 x 10⁻⁶ M BSA-biotin after succinylation.
Figure 4.24 ... 61
The probes were titrated 10% w/w NaClO4 and corresponding to UV-Vis
spectrum.
Figure 4.25 ... 61
The probes were titrated 1 mM Hg2+ standard solution.
The manufacture of lateral flow assay, which indicated all the reagents for necessary on the device.
Figure 4.27 ... 63
The strips only printed (A) streptavidin to describe the conjugation with biotin, and (B) probes to capture Hg2+ (10 mM) and coupling with probes contained carboxylic groups.
Figure 4.28 ... 64
The sensors with (A) probe B without tris-buffer. (50 mM) and (B) in the tris-buffer presenting.
Figure 4.29 ... 65
The mechanism of AuNPs conjugation on the test line and control line.
Figure 4.30. ... 65
The sensors determined the Hg2+ concentration by the color of test line and the related optical intensities from 1 μM to 50 mM (A) without NaClO4 and (B) in the
Chapter 1: Introduction
1.1 General Introduction
The topic of "nano" was touched upon by "There's Plenty of Room at the Bottom," a talk given by physicist Richard Feynman at an American Physical Society meeting at Caltech on December 29, 1959. Over 40 years ago, Feynman imagined a new physical world of ultra-small volumes and highlighted some difficulties that researchers might encounter when visiting it. His talk provided a vision for engineers and scientists to establish a new field, which-with subsequent developments in novel equipment and manufacturing skills-is known as “nanotechnology”.
An atom measures about 1 Ǻ, or 10-10 meters. The study of atoms and molecules is the conventional field of chemistry as was studied in the late 19th and 20th centuries. A nanometer (nm), or 10-9 meters, represent a collection of a few atoms or molecules. Properties of bulk substances of micrometer sizes or larger have been studied for years by solid state physicists and material scientists and are currently well understood. Materials on the 1-100 nm scale were not studied by either group in the past. It was just recently shown that on this size scale the properties of a material become dependent on its size and shape. Thus, the nanometer scale incorporates collections of atoms or molecules, whose properties are neither those of the individual constituents nor those of the bulk. On this scale, many of the atoms are still located on the surface, or one layer removed from the surface, as opposed to the interior. New properties are observed on this scale due to the interface that is not observed in the bulk or individual atoms. Since the properties depend on the size of the structure, instead of the nature of the material, reliable and continual change can be achieved using a single material[1-5].
Nanotechnology has become one of the most important and exciting forefront field in physics, chemistry, engineering and biology which the characteristic dimensions are below ca. 1000 nm[6-9]. It shows great promise for providing us in the near future with many breakthroughs that will change the direction of technological advances in a wide range of applications. This kind of work is often called nanotechnology. With nanotechnology, a large set of materials and improved products rely on a change in the physical properties when the feature sizes are shrunk.
1.2 Nanomaterials
In the last 10 years the field of molecular diagnostics has witnessed an explosion of interest in the use of nanomaterials in assays for gases, metal ions, and DNA and protein markers for many diseases[10]. Intense research has been fueled by the need for practical, robust, and highly sensitive and selective detection agents that can address the deficiencies of conventional technologies. Not all molecular fluorophores make for suitable probes in biodiagnostic assays nor do all nanomaterials offer advantages in biodetection. Certain nanomaterials are attractive probe candidates because of their (1) small size (1-100 nm) and correspondingly large surface-to-volume ratio, (2) chemically tailor-able physical properties, which directly relate to size, composition, and shape (Figure 1.1), (3) unusual target binding properties, and (4) overall structural robustness. The size of a nanomaterial can be an advantage over a bulk structure, simply because a target binding event involving the nanomaterial can have a significant effect on its physical and chemical properties, thereby providing a mode of signal transduction not necessarily available with a bulk structure made of the same material. Indeed, in this regard, nanomaterials and biology have a long history as nanoparticles have been used in bioconjugation and as cellular labeling agents for the past four
decades. However, new synthesis, fabrication, and characterization methods for nanomaterials have evolved to the point that deliberate modulation of their size, shape, and composition is possible, thereby allowing exquisite control of their properties. Additionally, tools and techniques for surface modification and patterning have advanced to a point that now allows generation of nanoscale arrays of biomacromolecules and small molecules on surfaces[11-13]. Along with synthetic advances for varying the size, shape, and composition of nanostructured materials has come the ability to tailor their binding affinities for various biomolecules through surface modification and engineering.
Figure 1.1 Sizes, shapes, and compositions of metal nanoparticles can be systematically varied to
produce materials with distinct light-scattering properties[10].
1.3 Gold Nanoparticles
Cold-hammering was used to in the late Stone Age to produce plates of gold for ornamental purposes, and the bulk gold has always been synonymous with beauty,
power and wealth. In contrast, the scaling-down of bulk gold to nanometer size, i.e. gold nanoparticles (AuNPs), inherently exhibit many desirable characteristics. They are gradually attracting a great deal of attention for their use in technologies, including catalysis, optical material, electronic device, biosensor, drug carrier, and high contrast cell image[14-15]. AuNPs have widely been used in nanotechnology due to size-dependent electrical property, high electrocatalytic activity, and functional compatibility with molecules and polymers. By the surface plasmon resonance and its enhancement of the radiative and nonradiative properties of nanocrystals of different shapes, the quantum size effect is involved when the de Broglie wavelength of the valence electrons is of the same order as the size of the particle itself[16]. Then, the particles behave electronically as zero-dimensional quantum dots (or quantum boxes) relevant to quantum-mechanical rules. Freely mobile electrons are trapped in such metal boxes and show a characteristic collective oscillation frequency of the plasma resonance. The phenomenon is described quantitatively by solving Maxwell’s equations for spherical particles with the appropriate boundary conditions, and Mie theory attributes the plasmon band of spherical particles to the dipole oscillations of the free electrons in the conduction band occupying the energy states immediately above the Fermi energy level[17]. Here, ωp is the frequency of the plasma oscillation of free
electrons expressed in terms of the free electron density N, the electron charge e, and effective mass m:
To introduce size effects, one assumes that as the size of the particle diminishes, The surface scattering rate is expressed in terms of the Fermi velocity (νF = 1.4 x 10⁸
The free electrons in the metal (d electrons in gold) are free to travel through the material. The mean free path in gold is about 50 nm, therefore in particles smaller than this, no scattering is expected from the bulk. Thus, all interactions are expected to be with the surface. When the wavelength of light is much larger than the nanoparticle size it can set up standing resonance conditions as represented in Figure 1.2. Light in resonance with the surface plasmon oscillation causes the free-electrons in the metal to oscillate. As the wave front of the light passes, the electron density in the particle is polarized to one surface and oscillates in resonance with the light’s frequency causing a standing oscillation.
Figure 1.2 Origin of surface plasmon resonance due to coherent interaction of the electrons in the
conduction band with light[14].
The resonance condition is determined from absorption and scattering spectroscopy and is found to depend on the shape, size, and dielectric constants of both the metal and the surrounding material. This is referred to as the surface plasmon resonance, since it is located at the surface. As the shape or size of the nanoparticle changes, the surface geometry changes cause a shift in the electric field density on the surface. This causes a change in the oscillation frequency of the electrons, generating
different cross-sections for the optical properties including absorption and scattering. Many shapes of AuNPs have been synthesized in Figure 1.3, due to the ease of preparation[19-21]. The absorption in the different shapes and sizes of AuNPs are showed in Figure 1.4. The spherical AuNP solutions in water reflects the surface plasmon band, a broad absorption band in the visible region around 520 nm[22].
Figure 1.3 Different shapes of AuNPs[19-21].
Figure 1.4 The absorption of AuNPs at various sizes and shapes[2].
Changing the dielectric constant of the surrounding material will have an effect on the oscillation frequency due to the varying ability of the surface to accommodate electron charge density from the nanoparticles. Changing the solvent will change the dielectric constant, but the capping material is most important in determining the shift of the
plasmon resonance due to the local nature of its effect on the surface of the nanoparticle. Chemically bonded molecules can be detected by the observed change they induce in the electron density on the surface, which results in a shift in the surface plasmon absorption maximum. This is the basis for the use of AuNPs as sensitive sensors.
1.4 Lateral Flow Assay
Immunochromatographic assays also known as Lateral flow assays (LFA)are a simple device intended to detect the presence of a target analyte in sample (Figure 1.5). Most commonly these tests are used for medical diagnostics either for home testing, point of care testing, or laboratory use. Often produced in a dipstick format, LFA are a form of immunoassay in which the test sample flows along a solid substrate via capillary action. After the sample is applied to the test it encounters a colored reagent which mixes with the sample and transits the substrate encountering lines or zones which have been pretreated with an antibody or antigen. Depending upon the analytes present in the sample the colored reagent can become bound at the test line or zone[23-24]. Colored particles can be used colored reagents. The gold particles are red in color due to localized surface plasmon resonance. Fluorescent[25] or magnetic labelled particles can also be used-however these require the use of an electronic reader to assess the test result.
Two kinds of main LFA are competitive and non-competitive. In a competitive assay[26-27], the antigen in the unknown sample competes with labeled antigen to bind with antibodies. The amount of labeled antigen bound to the antibody site is then measured. In this method, the response will be inversely proportional to the concentration of antigen in the unknown. This is because the greater the response, the less antigen in the unknown was available to compete with the labeled antigen. In
noncompetitive assays, also referred to as the "sandwich assay"[28-30] , antigen in the unknown is bound to the antibody site, then labeled antibody is bound to the antigen. The amount of labeled antibody on the site is then measured. Unlike the competitive method, the results of the noncompetitive method will be directly proportional to the concentration of the antigen. This is because labeled antibody will not bind if the antigen is not present in the unknown sample.
The lateral flow assay includes several benefits, such as a user-friendly format, rapid results, long-term stability over a wide range of weather conditions, and relatively low manufacturing costs. These characteristics render it ideally suited for onsite testing by untrained personnel. Recent studies have used monoclonal antibodies based on this assay to detect ricin[31] and sulfonamides[32] and a polyclonal antibody to detect botulinum neurotoxin[33]. LC-MS/MS has proved to be an excellent analytical approach for direct determination of NSP, and recently been proposed as a universal analytical method for marine toxins[34]. However, this approach requires expensive equipment and skilled analysts, and the sample preparation is labor-intensive and time consuming. Other approaches are limited in laboratory scientific research. Therefore, it is necessary to develop a rapid and economical method for the detection of samples.
Figure 1.5 (A) Typical configuration of lateral flow assay test strip. (B) Competitive assay. (C)
Chapter 2: Literatures Review
2.1 Gold Nanoparticles Background
A so-called Elixir of Life, a potion made from gold was discussed, if not actually manufactured, in ancient times. Figure 2.1 shows colloidal gold has been used since Ancient Roman times to color glass intense shades of yellow, red, or mauve, depending on the concentration of gold[36-37], and in Hindu Chemistry, for various potions. In the 16th century, the alchemist Paracelsus claimed to have created a potion called Aurum Potabile (Latin: potable gold). In the 17th century the glass-colouring process was refined by Andreus Cassius and Johann Kunchel. In 1842, John Herschel invented a photographic process called Chrysotype (from the Greek word for gold) that used colloidal gold to record images on paper. Paracelsus' work is known to have inspired Michael Faraday to prepare the first pure sample of colloidal gold, which he called "activated gold", in 1857. He used phosphorus to reduce a solution of gold chloride.
Figure 2.1 The Lycurgus Cup dates from Roman times. The glass appears green in daylight (reflected
Faraday was the first to recognize that the color was due to the minute size of the AuNPs[38]. In 1898 Richard Adolf Zsigmondy prepared the first AuNPs in diluted solution[39]. Apart from Zsigmondy, Sevdberg who invented ultracentrifugation and Mie, who provided the theory for scattering and absorption by spherical particles, were also interested in understanding synthesis and properties of colloidal gold[40].
Generally, AuNPs are produced in a liquid by reduction of tetrachloroauric acid (HAuCl4). After dissolving HAuCl4, the solution is rapidly stirred while a reducing
agent is added. This causes Au3+ to be reduced to neutral gold atoms. The rest of the gold atoms formed stick to the existing particles. To prevent the particles from aggregating, some sort of stabilizing agent that sticks to the nanoparticle surface is usually added. They can be functionalized with various organic ligands to create organic-inorganic hybrids with advanced functionality[41]. It can also be synthesized by laser ablation. The following are two main preparations we will introduce.
2.1.1 Turkevich Method
Among the conventional methods of synthesis of AuNPs by reduction of Au3+ derivatives, the most popular one for a long time has been that using citrate reduction of HAuCl4 in water, which was introduced by Turkevitch in 1951[42]. In an early effort,
reported in 1973 by Frens, to obtain AuNPs of prechosen size (between 16 and 147 nm) via their controlled formation, a method was proposed where the ratio between the trisodium citrate-to gold ratio was varied. This method is very often used even now when a rather loose shell of ligands is required around the gold core in order to prepare a precursor to valuable AuNP-based materials.
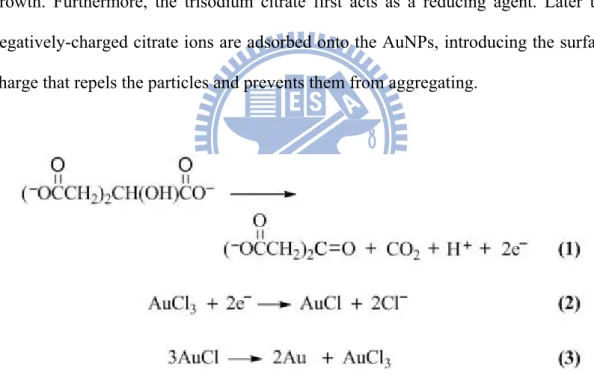
Figure 2.2 points out AuNPs preparation and states how they are modeled in this work. The initial step of this process, with reactions occurring in series and parallel, is
the oxidation of citrate, which yields dicarboxy acetone. The second step is the reduction of auric salt to aurous salt. The next step is the disproportionation of aurous species to gold atoms. The overall mechanism Au3+ is reduced in solution by citrate to Au+, which forms a multi-molecular complex with dicarboxy acetone. The complex disproportionates, and Au atoms are formed. These atoms adsorb Au+ and, by complexation with dicarboxy acetone, form large aggregates. Further disproportionation leads to formation of still larger aggregates of gold atoms. When the size of the aggregate reaches a critical value, a nucleus of gold atoms is formed. The gold atoms produced by disproportionation are absorbed by the particle, resulting in its growth. Furthermore, the trisodium citrate first acts as a reducing agent. Later the negatively-charged citrate ions are adsorbed onto the AuNPs, introducing the surface charge that repels the particles and prevents them from aggregating.
Figure 2.2 The multi-step mechanism of AuNPs formation. Large aggregation occurs to nano-scale
particles once gold atoms forming. The remnant citrate ions absorbed by particle surface provide negative repulsion from further aggregation.
To produce larger particles, Scientists discovered less trisodium citrate should be added. The reduction in the amount of trisodium citrate will reduce the amount of the citrate ions available for stabilizing the particles, and this will cause the small particles to aggregate into bigger ones[43].
2.1.2 Brust-Schiffrin Method
The Brust-Schiffrin method for AuNP synthesis, published in 1994[44-45], has had aconsiderable impact on the overall field in less than a decade, because it allowed the facile synthesis of thermally stable and air-stable AuNPs of reduced dispersity and controlled size for the first time (ranging in diameter between 1.5 and 5.2 nm in Figure 2.4). Indeed, these AuNPs can be repeatedly isolated and redissolved in common organic solvents without irreversible aggregation or decomposition, and they can be easily handled and functionalized just as stable organic and molecular compounds. The technique of synthesis uses the thiol ligands (SH) that strongly bind Au due to the soft character of both Au and S. AuCl4- is transferred to toluene using tetraoctylammonium
bromide as the phase-transfer reagent and reduced by NaBH4 in the presence of
dodecanethiol[46-47] (Figure 2.3).
Figure 2.3 AuNPs synthetic mechanism show the reaction transfer between water and toluene phase.
Figure 2.4 TEM pictures of the thiol derivatised AuNPs at (A) low and (B) high magnification[44].
upon addition of NaBH4. Finally, these new hydrophobic metal clusters are of intrinsic
interest since in some respects, they behave like simple chemical compounds; they can be precipitated, redissolved and chromatographed without any apparent change in properties.
2.2 Applications of Gold Nanoparticle Probes
Not all molecular fluorophores make for suitable probes in biodiagnostic assays nor do all nanomaterials offer advantages in biodetection. Specifically, the sizes, shapes, and compositions of metal nanoparticles and quantum dots can now be systematically varied to produce materials with specific emissive, absorptive, and light-scattering properties, which make these materials ideal for multiplexed analytic detection[48-49]. The tools and techniques for surface modification and patterning have advanced to a point that now allows generation of nanoscale arrays of biomacromolecules and small molecules on surfaces. For example, the coupling and functionalization with biological components has been carried out are summarized in Table 2.1[50].
AuNPs are one of the materials used to detection in the presence of stabilizing agents (often citrate, or thiols) which bind to the atoms exposed at the surface of the AuNPs generate well-organized, self-assembled monolayer[51]. This capping leads to a stabilization and prevents uncontrolled growth and aggregation of the AuNPs. Molecules can be linked directly with the metal particle by exchange reactions with stronger binding ligands (Figure 2.5). From recent years, various ligands were designed to probe targets including DNA, small molecules, and metal ions. Several important examples will be introduced in this chapter.
Table 2.1 Inorganic nanoparticles couple with biomolecules[50].
Figure 2.5 General schematic representation of methods to couple inorganic nanoparticles and
biomolecules (FG: functional coupling group). Representative structures of typical linkers are listed beneath (see also Table 2-1)[50].
2.2.1 DNA detection
DNA-functionalized AuNPs had been introduced over ten years ago by Mirkin, et al.[52-54]. It’s a highly selective detection method based on sequence-specific hybridization of the polynucleotides[55-56]. The reaction is facilitated by freezing and thawing of the solutions. In the first demonstration of DNA detection by AuNP probe, the mercaptoalkyloligonucleotide-modified AuNPs are used as reporter groups. An
olignucleotide probe hybridizes with the target to cause not only in the binding of an oligonucleotide probe to the target sequence, but also in the formation of an extended polymeric network in which the reporter units are interlocked by multiple. The mechanism is displayed Figure 2.6.
Initial studies are carried out with a three-component system, wherein two probes, 1 and 2, were used for one target sequence, 3-7[57]. In Figure 2.7 shows the target 3 is complementary with probes 1 and 2 to hybridize and binds the AuNPs closer to aggregation that accompanies with the color changes from red from purple. The target 4 is half-complementary to binding the probes together insufficiently and the AuNPs remain red color. The analysis of the target DNA with the changed color monitored by naked eye is called selective colorimetric detection.
Figure 2.6 The mechanism of DNA modified AuNP probe for sensing.
Figure 2.7 Schematic of the concept for aggregation signaling hybridization of AuNPs-oligonucleotide
Other techniques are developed to detect DNA by DNA arrays in Figure 2.8 and Figure 2.9[58-59]. The heterogeneous nucleic acid hybridization with capture oligonucleotides attached to solid supports. To combine with the DNA-directed immobilization of AuNPs to form supramolecular surface architecture. The specific nucleic acid mediated immobilization of gold nanoparticles can be utilized for the topographic labeling of surface-bound DNA targets. The latter approach is based on the reduction of silver ions in the presence of gold particles and allows a 100-fold increase in sensitivity over conventional fluorescent DNA detection[60-61].
Figure 2.8 Scanometric detection of nucleic acids in DNA chip analyses. Capture oligonucleotides are
immobilized on glass slides and used for the specific binding of target nucleic acids and finally use a silver enhancement step[58].
Furthermore in the detection scheme (Figure 2.9), the target oligonucleotide has contiguous recognition elements that are complementary to the capture strand on one end and on the other to oligonucleotides attached to AuNPs (Figure 2.9). Therefore, when the device with the pair of electrodes is immersed in a solution containing the
appropriate probe and target, AuNP probes fill the gap. After treatment with silver enhancer solution for several minutes and then stringency wash, the gap resistances decrease with increasing exposure to the silver enhancer solution for all complementary strands but not noncomplementary strands (Figure 2.10). The gaps with the four different oligonucleotide capture strands exhibit different resistances. Using this method, they have detected target DNA at concentrations as low as 500 femtomolar with a point mutation selectivity factor of 100,000:1.
Figure 2.9 (A) Scheme showing concept behind electrical detection of DNA. (B) Sequences of capture,
target, and probe DNA strands. (C) Optical microscope images of the electrodes used in a typical detection experiment. The spot in the electrode gap in the high-magniÞcation image is food dyespotted by a robotic arrayer[59].
Figure 2.10 Resistance of the electrode arrays measured as a function of increasing silver enhancing
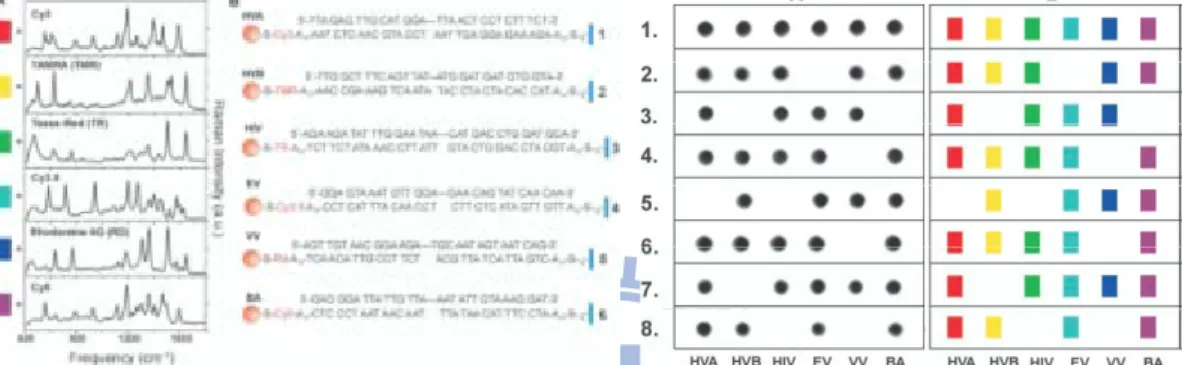
To distinguish different target strands, multiplexed detection of oligonucleotide targets is available by introducing Raman spectroscopy[62-64]. AuNP probes consist of 13-nm-diameter AuNPs functionalized with Raman dye-labeled oligonucleotides. The Raman spectroscopic fingerprint, which can be designed through choice of Raman label[65], can be identified after Ag enhancing by Bcanning Raman spectroscopy (Figure 2.11). Because the SERS-active substrate in this strategy is generated immediately before the detection event, a large and reproducible Raman scattering response can be obtained.
Figure 2.11 Nanoparticles functionalized with oligonucleotides and Raman labels, coupled with
surface-enhanced Raman scattering (SERS) spectroscopy, can be used to perform multiplexed detection of oligonucleotide targets[62].
If the sequences are very dissimilar, the author finds that other than the expected spectroscopic probe signature for each target, there are virtually no other detectable Raman lines, indicating no cross-hybridization between different targets and probes. Eight separate tests are carried out to evaluate the selectivity of the system and ability to determine the number and types of strands in solutions containing mixtures of the different targets. In the first test, all six targets are present, and all showed strong gray-scale values when measured by means of the flatbed scanner as well as the
expected Raman fingerprints. In Figure 2.12 the next seven tests, mixtures were systematically removed one or more of the targets to evaluate the suitability of this method for multiplexing. With the single-color grayscale method one cannot determine if any cross-hybridization has occurred. However, with this “multiple color” scanning Raman method, one can carefully study the SERS spectra of each spot to determine which labels make up each spot.
Figure 2.12 The Raman spectra of six dye-labeled nanoparticle probes after Ag enhancing on a chip
(after background subtraction). Each dye correlates with a different color in our labeling scheme[62].
2.2.2 Small Molecules Detection
It also can modify substituents on AuNPs surface that maintain specific affinity with small molecular target[66-69]. In Figure 2.13, melamine and cyanuric acid or its derivatives forms a stable complex CA·M through the interaction between diaminopyridine and diimide moieties, exhibiting three complementary NH· · ·O and NH· · ·N hydrogen bonds[70-72].
Melamine is a chemical compound used primarily for the production of melamine resins. Lehui Lu and co-workers reason that when combined with MTT, a kind of cyanuric acid derivatives (1-(2-mercaptoethyl)-1,3,5-triazinane-2,4,6-trione), AuNPs interact with melamine by hydrogen-bonding recognition may change in optical properties can be directly reflected by the color change[73-75]. UV-Vis spectroscopic
measurements were performed to determine the optimal detection conditions. The selectivity of the optimized sensor for melamine was evaluated by monitoring the extinction ratio (A700 / A519) response in the presence of other molecules with similar
structures. This sensor exhibits sevaral advantages in Figure 2.14: cheaper, rapid, ultrasensitve detection concentration (2.5 ppb), and excellent selectivity for melamine.
The typical analytical techniques such as a low-temperature plasma probe combined with tandem mass spectrometry (LTP/MS), all require expensive and complicated instruments, making on-site and real-time melamine sensing difficult. The AuNPs own the advantages substantially make this method quite promising for on-site and real-time detection ofmelamine in raw milk, infant formula, and other milk products.
Figure 2.13 (A) Hydrogen-bonding recognition between melamine and cyanuric acid derivative. (B)
Figure 2.14 (A) Concentration-dependent extinction spectra for the MTT-stabilized AuNPs under the
optimized conditions. (B) The corresponding plot of A700 / A519 versus melamine concentration[68].
Another group reported a simple and sensitive method for the colorimetric
visualization of TNT at picomolar levels by using AuNPs. The color change of AuNPs induced by the donor-acceptor (D-A) interaction between TNT and primary amines[76-77]. Initially, the cysteamine-stabilized AuNPs were well dispersed in distilled water and the color of the uniform suspension was wine red. The addition of TNT to the dispersion essentially leads to the aggregation of the cysteamine-stabilized Au NPs as a result of the D-A interaction between TNT and cysteamine (Figure 2.15) and the color of the suspension is accordingly changed to violet blue.
As increasing the concentration of TNT in the AuNPs suspension containing cysteamine also results in a clear increase in the absorbance at 650 nm (A650) and a
decrease in the absorbance at 520 nm (A520). The ratio of A650 to A520 was found to be
linear with the logarithm of TNT concentration within the concentration range from 5 x 10⁻⁹ to 5 x 10-13 M (Figure 2.16). By using AuNPs and by taking advantage of the D-A interaction between TNT and cysteamine, Mao’s group successfully developed simple assay for the direct colorimetric visualization of TNT down to the picomolar level. The method demonstrated herein is relatively simple, without requiring any instrumentation, but possesses the lowest detection limit among allmethods reported so far. The striking
properties substantially make this method quite promising for on-the-spot sensitive detection of TNT.
Figure 2.15 (A) D-A interaction between cysteamine and TNT. (B) Assay for direct colorimetric
visualization of TNT based on the electron D-A interaction at the Au NP/solution interface[66].
Figure 2.16 (A) Colorimetric visualization of TNT by using AuNP probe. TNT concentrations varied
from 5 x 10-13 M (2) to 5x 10⁻⁹ M (6). (B) UV-Vis spectra of the AuNP probes in the presence of different
concentrations of TNT: red, 0 M; dark yellow, 5 x 10-13 M; yellow, 5 x 10-12 M; magenta, 5 x 10-11 M;
2.2.3 Mercury Ion Detection
Several methods for the detection of metal ions, based upon organic fluorophores or chromophores, semiconductor nanocrystals, cyclic voltammetry, polymeric materials, proteins, and microcantilevers, have been developed[78-80]. Merrcury ion (Hg2+) is one of the heavy metal ion maintained in the detection because of its toxicity. Mercurialism is a disease caused by exposure to mercury or its compounds. The toxicity damages the brain, kidney, and lungs, even all the nervous system, and results in diseases including acrodynia, Hunter-Russell syndrome, and Minamata disease[81]. The United States Environmental Protection Agency makes efforts to regulate the drinking water; the maximum allowable concentration of inorganic mercury is about 2 ppb (10 nM). Colorimetric methods for heavy metal ion detection, in particular, are extremely attractive because they can be easily read out with the naked eye, in some cases at the point of use[82-84]. DNA/AuNPs have high extinction coefficients and unique distance dependent optical properties that can be chemically programmed through the use of specific DNA interconnect. Hg2+ relies on thymidine-Hg2+-thymidine coordination chemistry is a highly selective and sensitive colorimetric detection method (Figure 2.17)[85-86]. For colorimetric Hg2+ assay, however, Mirkin’s group prepared two types of AuNPs each functionalized with different thiolated-DNA sequences (Figure 2.18) which are complementary except for a single thymidine-thymidine mismatch Hg2+ will coordinate selectively to the bases that make up a T-T mismatch and Hg2+ would selectively bind to the T-T sites in our aggregates formed from mismatched strands.
Figure 2.17 The complex of Hg2+ coordinates with thymidine.
Figure 2.18 Colorimetric detection of Hg2+ using DNA-AuNPs[78].
Aggregation-induced color changes of 3-mercaptopropionic acid (MPA) - functionalized AuNPs (MPA/AuNPs showed in Figure 2.19) in aqueous solutions also develop a highly selective optical sensor for Hg2+[87]. The AuNPs employ as chromophores were capped with MPA through Au-S bonds. If their aggregation are to be driven by the recognition and binding of heavy-metal ions, the color change will allow visual sensing of the ions. In addition, Some PDCA ligands bind to the MPA/AuNP species through Au-N bonds[88], improving the probes’ selectivity toward Hg2+ ions through a cooperative effect, while the PDCA ligands in the bulk solutions form complexes with the other metal ions, suppressing their interference with the probes. Here performs a series of competitive experiments to test the practical applicability of the MPA-AuNP nanosensor for the selective colorimetric detection of Hg2+. The interfering metal ions like Ca2+, Sr2+, Mn2+, Pb2+, Cd2+ do not cause any
significant interference in the detection of the Hg2+ (Figure 2.20).
Figure 2.19 The mechanism of MPA/AuNPs aggregation had been driven by heavy metal ion
recognition and binding.
Figure 2.20 (Top) Photographic images of the colors and (bottom) Ex650/520 differences of the
MPA/AuNPs in the absence and presence of PDCA (1.0 mM) after the addition of 100 mM metal ions in 50 mM Tris-borate solutions (pH 9.0)[87].
Thiol and DNA modified AuNP probes exhibit high sensitivity and selectivity toward Hg2+ detection. In constrats, these probes lose the sensing ability in salinity solutions due to the ligands on AuNPs surface cannot protect particles from aggregation. Hence a new probe is based on MPA and adenosine monophosphate (AMP) spontaneously attaching the AuNP surface (Figure 2.21)[89-91]. Figure 2.22 indicates MPA/AMP/AuNPs are able to detect Hg2+ in PBS solutions without the addition of a masking agent or a change in the temperature. With the assist of using R6G, the lowest detecting concentration of Hg2+ is improved from 500 nM to 50 nM.
Figure 2.21 Schematic representation of (A) MPA/AMP- and (B) MPA-capped AuNPs that are present
in the salt solution[89].
Figure 2.22 (A) Effect of AMP concentration on the absorption ratio (A620/520) of MPA/AMP-capped
AuNPs upon the addition of different concentrations of PBS. (B) Plot of the absorption ratio (A620/520)
against the incubation time of MPA/AMP-capped AuNPs with 10 μM Hg2+[89].
2.3 Application of Lateral Flow Strip
The work to detect nucleic acid sequences with LFA test strips are based on the formation of hapten-antibody or hapten-protein (e.g., biotin-avidin) complexes. Piepenburg et al. made use of lateral flow immunoassays for the detection of DNA amplification products[92]. Mao et al. reported a dry-reagent strip biosensor based on DNA aptamer functionalized AuNP probes for visual/quantitative detection of protein within minutes[93]. They present a disposable nucleic acid biosensor (DNAB) based on
the oligonucleotide functionalized AuNPs[94]. The lateral flow device illustrates in Figure 2.23. DNA probe 1 and DNA probe 3 were immobilized on the nitrocellulose membrane to form the test zone and control zone. DNA probe 2 was attached to the Au-NPs and dispensed in the conjugate pad. The target DNA hybridizes with DNA probe 2 of the DNA/AuNP conjugates to form the complex and the complex are captured on the test zone by the second hybridization between the target DNA and the immobilized DNA probe 1. The accumulation of AuNPs in the test zone of the nitrocellulose membrane is visualized as a characteristic red band Then the excess of DNA-AuNP probe 2 conjugates are captured by the hybridization events between the DNA probe 2 and the DNA probe 3, thus forming a second red band. Under optimal conditions, the DNAB was capable of detecting minimum 50 pM target DNA. The biosensor has been applied for the detection of human genomic DNA directly with a detection limit of 2.5 μg/mL (1.25 fM).
Figure 2.23 Schematic illustration of the DNAB[92].
marine neurotoxins, the goat anti-mouse IgG and PbTx-BSA are separately stripped onto control region and test region[95]. And the AuNPs conjugate anti-toxin Mab. In this assay, the standard or sample solution containing PbTx, the binding sites on the specific Mabmolecules would be occupied firstly by PbTx, leaving fewer binding sites for PbTx-BSA. Consequently, less colloidal gold-labeled Mab would be remained at the PbTx-BSA location on the NC membrane. Thus, the degree of density of gold-color of the test line was the reverse of the concentration of PbTx and the visual result could be observed (Figure 2.24, strip 2-9). Therefore, the weaker the color density of the test line is, the higher the concentration of toxin tested in the sample is.
Figure 2.24 Assayed standard toxin concentration range of the strip test. C: control line, T: test line. 1:
PBS solution, 2-9: toxin in PBS, the concentrations of the toxin were 1.0, 10, 50, 100, 500, 1000, 2000, 4000 ng/ mL[95].
2.4 Motivation
Designing easy-to-use sensors for trace metal ions in the environment is considerable importance as these metal ions are large in number, small in quantity and high in toxicity. The AuNPs-bsaed colorimetric sensors provide simplicity and excellent detection capability encompassing a variety of targets including Hg2+. While these methods have taken an important step towards real-time sensing as the signal is
detectable by the naked eye, they still require laboratory type operations, such as precise transfer and mixing of multiple solutions. In addition, although the sensitivity is high when the absorbance is recorded using a UV-Vis spectrophotometer, it is often difficult to distinguish the red color of dispersed nanoparticles against a blue background from the aggregates, particularly at low metal-ion concentrations. Furthermore, AuNPs are not very stable in the solution state; they are vulnerable to aggregation under a variety of conditions thereby making it difficult to store the sensors for a long period of time. Therefore, lateral flow devices are an ideal platform for making dipstick type tests to further improve the performance of Hg2+ sensors. In addition to eliminating the complicated transfer operation and allowing signal discrimination of AuNPs according to single color with the red colored zone in few minutes, the reagents can be prepared in a dry or nearly dry state, making the device stable at ambient conditions for a long period of time. This system is portable for the detection of real samples immediately outdoor; moreover, it isn’t necessary for the assistance of any instrumentation. Such a method of low-price and easy-to-use sensor can be used for environmental monitor and drinking water protection in our life.
Chapter 3: Experiments
3.1 General Introduction
All the experiments were preceded in National Chiao Tung University (NCTU). All the equipments were also conducted in our laboratories in NCTU. The reagents were purchased commercially and used by following with the directions unless specially mentioned.
3.1.1 Reagents
All the reagents were listed alphabetically in the form of “Name {abbreviation; chemical formula; purity; manufacturer}”. Some information will be omitted if not available or not necessary. The following text will use the abbreviation of the reagent.
Albumin, biotin labeled bovine {BSA-biotin; 98% purity; Sigma}
BSA-biotin act as another coverage reagent on AuNP surface conjugates
sreptavidin through its extraordinarily strong affinity.
Bovine serum albumin {BSA; 96% purity; Sigma}
A serum albumin protein used for succinic modification, is covered on AuNP surface.
Chloroauric acid trihydrate {HAuCl4‧3H2O; 99.9% purity; Sigma} Chloroauric acid is the main compound to synthesis AuNPs.
Deionized and distilled water {DI water, ddH2O}
The water we used was purified with filters, reverse osmosis, and deionized system until the resistance was more than 18 MΩ‧cm-1. DI water was used to clean, wash, and be a solvent.
3-Mercaptopropoinic acid {MPA; 99.9% purity; Acros}
MPA is modified on the AuNP surface as a probe. Molecules with difunctional groups can form the strong Au-S covalent bond through thiol-end efficiently.
Succinic anhydride {C4H4O3; 99% purity; Acros}
The surface or molecules are introduced carboxylic groups, succinic anhydride contained dicarboxylic anhydride group react and form peptide bond with free amino group shows the free carboxylic group tail. This method is replacement of amino group to carboxylic group.
Streptavidin {99% purity; Acros}
A tetrameric protein purified from the bacterium “Streptomyces avidinii” forms strong non-covalent bond with biotin.
Sulfuric acid {H2SO4; 98% purity; Sigma}
Sulfuric acid was mixed with hydrogen peroxide in a 3:1 ratio to remove impurities on the surface of the SiO2 surface. This material was very corrosive and
dangerous. We must handle it with carefulness and patience.
Trisodium citrate dihydrate {Na3C6H5O7‧2H2O; 98% purity; Showa}
To synthesis AuNPs, trisodium citrate was mixed into HAuCl4 solution as reductive
reagent to reduce Au3+ to Au0.
2, 4, 6-Trinitrobenzenesulfonic acid {TNBSA; 5% w/v; Sigma}
TNBSA is a sensitivity reagent for the determination of free amino groups. Primary amines, upon reaction with TNBSA, form a highly chromogenic derivative.
Hydrogen peroxide {H2O2; ≥30% purity; Sigma}
Hydrogen peroxide was mixed with sulfuric acid to form piranha solution which cleaned the wafer surface.
3.1.2 Instrument
(A) SEM (JEOL, JSM-6700)
SEM is a very useful tool for observing surface morphology of specimen. SEM has secondary electrons or backscattered electrons detectors passing the signal to computer and forming image. In this study, AuNPs absorbed by certain functional groups modified on Si substrate were all characterized by a field-emission SEM operating at 10 kV accelerating voltage.
(B) UV-Vis (HITACHI, U-3310)
UV-vis uses light in the range of near UV, visible and near infrared. The absorption
in the light range is due to the optical properties of the chemicals involved. We determine the size of AuNPs and degree of AuNPs aggregation in the visible range, 400 nm-700 nm. In protein quantification, it is necessary to observe the sulfonic acid derivative in the 300 nm-500 nm by UV-vis spectrometer.
(C) Metal printer (FUJIFILM, DMP-2800)
Metal printer sprays drops composed of biomolecules by a high pressure gas inject into cartridge. We designed double line patterns with the size of 4 mm x 2mm. One is control line which streptavidin contained; the other composed of COOH-BSA.
(D) Centrifuge (Denville, 260D)
This motor is designed for separation of various research samples. We separated modified protein from saintly solution contained several impurities such as succinic acid, sodium dicarbonate by ultra-filter. The speed of centrifugation adjusted 14,000 rmp in purpose of protein purification.
3.2 Gold Nanopaticles and Probes Preparation
3.2.1 Prepare AuNPs
Uniform size and dispersive aqueous AuNPs solution is necessary for making AuNP probes ready. Turkevich method is considered as several benefits because of single phase system and tunable range of size. The reduction of HAuCl4 had been initiated by
sodium citrate. To prepare 10 mL, 1mM HAuCl4 solution, 3.94 mg HAuCl4.3H2O
dissolved in 10 mL DI water. We heated the liquid to boil using the hot plate and vigorously stirred by Teflon-coated magnetic bars to ensure the homogeneous temperature distribution. Then 1mL, 38.8 mM sodium citrate was pre-heated to 60 0C and added to the boiling solution. The color of mixed was changed from yellow to purple, finally became red in the few minutes. Continuously heat and reflux 30min. The AuNPs after cooling to room temperature was operated UV-vis absorption to determine the concentration and size. Finally AuNPs solution diluted to 15 nM stored in 4 0C refrigerator.
3.2.2 Prepare AuNP probes
MPA/AuNPs: we took 0.87 μL MPA and dissolved in 1mL DI water. The 10 μL of
10 mM MPA solution was added to 15 nM, 10 mM AuNPs solution, and stirred 24 hr. BSA/AuNPs: BSA/AuNPs are AuNPs covered by BSA. To prepare 1 mg/mL BSA solution, 1 mg BSA solvated in 1 mL DI water. Dilute the concentration of BSA solution to 50 μg/mL. Mix BSA solution 7.5 mL with 7.5 mL of 15 nM AuNPs and stir 1hr. The final concentration of BSA/AuNPs is 7.5 nM.
BSA-biotin/AuNPs: prepare 1 mg/mL BSA-biotin solution 10 mL contain 10 mg BSA-biotin. A solution contained 7.5 mL BSA-biotin with 7.5 mL, 15 nM AuNPs stirred 1 hr.
COOH-BSA/AuNPs: COOH-BSA is modified carboxylic acid group on BSA. The synthetic method will mention below. Follow the same procedures, the 15 mL, 7.5 nM AuNP probes was consist with equal volume of 1 mg/mL COOH-BSA and 15 nM AuNPs.
COOH-BSA-biotin/AuNPs: After carboxylic modification of BSA-biotin, to mix the purified 1 mg/mL COOH-BSA-biotin 7.5 mL with 7.5 nM AuNPs and to stir 1hr.
3.3 Protein Modification and Quantification
Succinic anhydride reacts with the ε-amino group of lysine and the amino-N-terminal α-amino group of proteins, in their non-protonated forms, converting them from basic to acidic groups[96-97]. The amino group of BSA can be replaced the amino group to carboxylic acid group by succinylation. First 5 mg BSA should be dissolve in 5 mL of 0.2 M, pH 8.5 sodium borate buffer. A pH electrode was placed within the solution to monitor the pH value. As the solution was continuously stirred using magnetic bars, the
solid succinic anhydride was added in 0.5 mg portions over a period of 15 min to 1 hr to give a 50-fold excess. Take care of the pH value should be adjusted back to 7 by NaOH solution with each addition. After the last addition, the reaction was still proceed and stirred at least 30 min. The modified BSA called COOH-BSA was purified by ultra-filtration. Each filtrate tube contains 1.2 mL original solution inserted into a centrifuge. The treatment of centrifugation operated 15 min with speed of centrifugation of 14000 rpm. Appropriate buffers dissolved COOH-BSA to the concentration of 1 mg/mL. In addition, BSA-biotin was succinylated and purified by the same procedures.
Figure 3.2 The procedure that succinylation of BSA.
TNBSA is a rapid and sensitive assay reagent for the determination of free amino groups[98-99]. Primary amines, upon reaction with TNBSA, form a highly chromogenic derivative, which can be measured at 335 nm. Qualitative measurements of amines, and quantitative measurements of e- amino groups of L-lysine have also been obtained using TNBSA. The procedure was to dissolve BSA and COOH-BSA in the reaction
buffer, 0.1 M pH 8.5 of sodium dicarbonate, at a concentration of 200 μg/mL. Add 0.25 ml of the 0.01% (w/v) solution of TNBSA to 0.5 ml of each sample solution. Mix well. Incubate at 37°C for two hours. Add 0.25 ml of 10% SDS and 0.125 ml of 1 N HCl to each sample. Measure the absorbance of the solutions at 335 nm. Following the method above, the 5-35 μg of lysine were dissolved in sodium dicarbonate as the control samples.
Figure 3.3 The procedure of protein quantification.
3.4 Silicon Substrate Modification
200 nm-oxide-capped Si substrate that should be carefully cleaned by the solution of H2SO4 and H2O2 (volume ratio was 3:1). Immediately afterwards, the sample was
immersed in a 5 mM ethanol anhydride solution of a bifunctional aminosilane, APTES for 30 min[100]. After the APTES immersion, the sample was rinsed within DI water bath twice, and then removed moisture with a N2 gun. Bake the samples with 120 0C in
the oven. Furthermore, the APTES modified substrate was reacted with 0.1 M succinic anhydride in DMF solution[101]. After immersion 24hr, the samples had been rinsed
with DMF and water. The schematic procedure of preparing the amino-functionalized and carboxylic acid-functionalized Si substrates is summarized in Figure 3.4.
To prepare the thiol-functionalized substrate, the clean Si substrate was immersed in 5 mM DMSO solution of MPTES 30min. Be rinsed within DI water bath twice. Bake the samples with 120 0C in the oven.
Figure 3.4 Process of carboxylic acid-fuctionalization self-assembly on Si substrate.
3.5 Lateral Flow Strip
The LFA strip is comprised of a sample pad (4 mm x 16 mm ), conjugate pad (4 mm x 7 mm), NC membrane (4 mm x 25 mm), and an absorbent pad (4 mm x 17 mm) as shown in Figure 3.5. NC membrane and conjugate pad treated immersion of 5 % sucrose 24 hr was placed dry box at 37 0C constant temperature 24hr. Each component was cut into fitting pieces.
![Figure 1.1 Sizes, shapes, and compositions of metal nanoparticles can be systematically varied to produce materials with distinct light-scattering properties [10]](https://thumb-ap.123doks.com/thumbv2/9libinfo/8252032.171736/21.892.137.762.520.906/figure-compositions-nanoparticles-systematically-materials-distinct-scattering-properties.webp)
![Figure 1.2 Origin of surface plasmon resonance due to coherent interaction of the electrons in the conduction band with light [14]](https://thumb-ap.123doks.com/thumbv2/9libinfo/8252032.171736/23.892.154.737.523.816/figure-origin-surface-resonance-coherent-interaction-electrons-conduction.webp)

![Table 2.1 Inorganic nanoparticles couple with biomolecules [50] .](https://thumb-ap.123doks.com/thumbv2/9libinfo/8252032.171736/33.892.142.765.111.428/table-inorganic-nanoparticles-couple-biomolecules.webp)
![Figure 2.7 Schematic of the concept for aggregation signaling hybridization of AuNPs-oligonucleotide probe conjugates with oligonucleotide target molecules [52]](https://thumb-ap.123doks.com/thumbv2/9libinfo/8252032.171736/34.892.187.653.733.1038/schematic-aggregation-signaling-hybridization-oligonucleotide-conjugates-oligonucleotide-molecules.webp)
![Figure 2.10 Resistance of the electrode arrays measured as a function of increasing silver enhancing time (A) without and (B) with washing with 0.01 M PBS at room temperature before silver enhancing [59]](https://thumb-ap.123doks.com/thumbv2/9libinfo/8252032.171736/36.892.192.701.826.1034/resistance-electrode-measured-function-increasing-enhancing-temperature-enhancing.webp)
![Figure 2.11 Nanoparticles functionalized with oligonucleotides and Raman labels, coupled with surface-enhanced Raman scattering (SERS) spectroscopy, can be used to perform multiplexed detection of oligonucleotide targets [62]](https://thumb-ap.123doks.com/thumbv2/9libinfo/8252032.171736/37.892.236.655.481.735/nanoparticles-functionalized-oligonucleotides-scattering-spectroscopy-multiplexed-detection-oligonucleotide.webp)