國 立 交 通 大 學
經營管理研究所
博士論文
No. 111
整合財務資訊之績效標竿分析-
國際觀光旅館產業之應用
Benchmarking with Financial Information for International Tourist
Hotel Industry in Taiwan
研 究 生:盧文民
指導教授:楊
千
教授
國 立 交 通 大 學
經營管理研究所
博士論文
No. 111
整合財務資訊之績效標竿分析-
國際觀光旅館產業之應用
Benchmarking with Financial Information for International Tourist
Hotel Industry in Taiwan
研 究 生:盧文民
研究指導委員會:楊
千 教授
丁
承 教授
胡均立 教授
指導教授:楊
千
教授
中華民國九十五年四月
整合財務資訊之績效標竿分析-國際觀光旅館產業之應用
Benchmarking with Financial Information for International
Tourist Hotel Industry in Taiwan
研 究 生:盧文民 Student:Wen-Min Lu
指導教授:楊 千 教授 Advisor:Dr. Chyan Yang
國 立 交 通 大 學
經 營 管 理 研 究 所
博 士 論 文
A Dissertation
Submitted to Institute of Business and Management College of Management
National Chiao Tung University in Partial Fulfillment of the Requirements
for the Degree of Doctor of Philosophy
in
Business and Management
April, 2006
Taipei, Taiwan, Republic of China
整合財務資訊之績效標竿分析-國際觀光旅館產業之應用
Benchmarking with Financial Information for International
Tourist Hotel Industry in Taiwan
研 究 生:盧文民
指導教授:楊
千
教授
國立交通大學經營管理研究所博士班
中文摘要
本篇論文使用財務/非財務指標來勾勒出台灣國際觀光旅館的經營績效。效率評等 應該被視為達成較好經營績效暨較佳市場位置的一種關鍵要素。本論文藉由資料包絡分 析法(DEA)整合財務/非財務指標的績效模型來衡量台灣國際觀光旅館之效率評等。本研 究也進一步整合傳統的資料包絡分析、投入擁擠測度、標竿分享測度及差額變數為基礎 的窗口分析來延伸資料包絡分析在績效標竿的應用。這項研究的結果能為國際觀光旅館 的管理者提供對資源配置的瞭解和探究競爭優勢所在,並且幫助經營者在競爭激烈的環 境下擬定適當的經營策略。首先就橫斷面研究(cross sectional study)而言,本研究探討台灣國際觀光旅館的「整 體管理績效」、「住房部門績效」和「餐飲部門績效」,使用「臺灣地區國際觀光旅館營 運分析報告」中的 2002 年作業資料。數個實證結果說明如下:⑴大部份的國際觀光旅 館呈現規模報酬遞減的情境,此結果意謂台灣國際觀光旅館正面對著競爭激烈的經營環 境;⑵加入國際連鎖的國際觀光旅館,整體而言,經營績效是優於獨立經營的國際觀光 旅館;⑶休閒區域的國際觀光旅館,平均而言,經營績效是優於都會區的國際觀光旅館
;⑷靠近中正機場的國際觀光旅館,平均而言,經營績效是差於遠離中正機場的國際觀 光旅館;⑸擁擠分析 (congestion analysis) 指出無管理績效之國際觀光旅館缺乏資源整 合的能力,尤其在「餐飲部門的面積」及「客房數」此二個投入變項;⑹標竿分享測度 (benchmark-share measure) 呈現出有效率的國際連鎖觀光旅館較容易成為無效率國際觀 光旅館的標竿。此結果可推論出,加入國際連鎖的國際觀光旅館有較佳的競爭優勢。本 研究也進一步使用「住房部門績效」和「餐飲部門績效」來建構管理決策矩陣,以協助 經營者擬訂相關績效改善策略。 次之就跨期研究 (cross-period study) 而言,本研究使用兩階段的方式來分析國際觀 光旅館跨期 (1997-2002) 的管理績效。第一階段將差額變數為基礎的測度 (slack-based measure) 模式和窗口分析 (window analysis) 模式整併,用來衡量國際觀光旅館的跨期 效率。第二階段藉由 Tobit 迴歸模式來找出影響國際觀光旅館經營績效的作業特微。數 個實證結果說明如下:⑴國際觀光旅館整體經營績效逐漸成長,同時國際觀光旅館之間 的績效差異也逐漸趨向穩定;⑵大部份的國際觀光旅館呈現規模報酬遞減的情境,此結 果意謂台灣國際觀光旅館正面對著競爭激烈的經營環境;⑶台灣的921地震、美國911恐 怖攻擊和政府主導的軍公教強迫性休假補助政策,對不同作業特徴下的國際觀光旅館在 短期時間上造成明顯的影響;⑷結果也指出管理形式之差異顯著影響國際觀光旅館跨期 的管理績效。 最後,本研究的發現可以視為處理國際觀光旅館相關議題的指引。我們也希望在本 研究所使用的數量模型暨方法論可廣泛應用到不同產業,探究不同的議題。 關鍵詞:資料包絡分析、績效測度、投入擁擠測度、標竿分享測度、標竿、窗口分析、 國際觀光旅館
Benchmarking with Financial Information for International
Tourist Hotel Industry in Taiwan
Student:Wen-Min Lu Advisor:Dr. Chyan Yang
Institute of Business and Management National Chiao Tung University
Abstract
This dissertation reconciles diverse financial/non-financial measures to characterize the business performances of Taiwan’s International Tourist Hotel (ITHs). Efficiency ratings should be considered as a key element for achieving greater business performance and better market position. The technology of data envelopment analysis (DEA) is employed to determine a multi-factor business performance model which inherently recognizes tradeoffs among various financial/non-financial measures. This study also presents an extension to the DEA, by incorporating the traditional DEA, input congestion measure, benchmark-share measure, and slack-based measure (SBM) DEA window analysis for assessing the performance of ITHs. The results of this study can provide ITHs’operationswith insights into resource allocation and competitive advantage and help with strategic decision-making, especially regarding operational styles under an intense competitive environment through high ITH density.
Firstly, this study evaluates the performance of ITHs in terms of managerial, occupancy and catering efficiencies, using 2002 operating data. Several empirical results are shown: (1) most ITHs operate at decreasing returns to scale, indicating that ITHs are facing a highly competitive environment; (2) the international chain ITHs are generally more efficient than
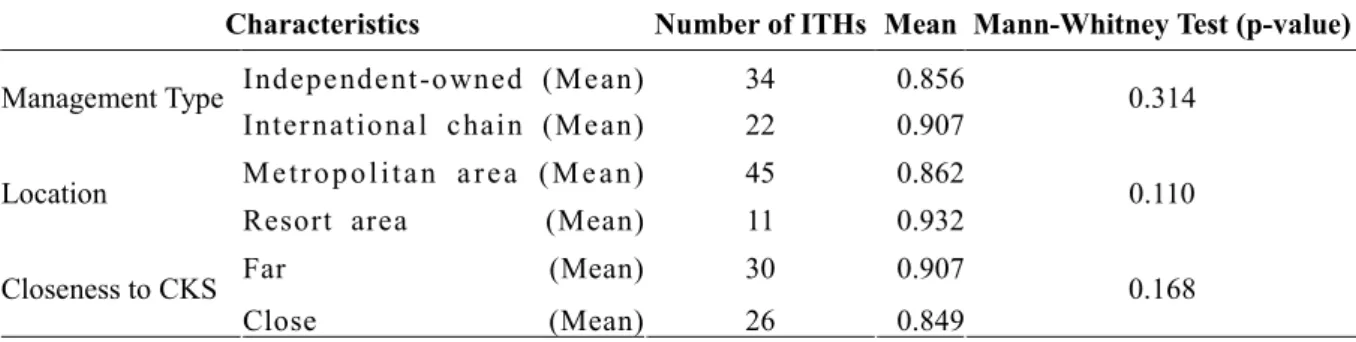
independent-owned ones; (3) ITHs located in resort areas operate slightly better on average than ones located in metropolitan areas; (4) ITHs that are close to CKS international airport operate slightly worse on average than ones far from CKS international airport; (5) congestion analysis reveals that inefficient ITHs lack the ability to integrate their resources, especially in the total area of the catering division and the number of guest rooms; and finally, (6) the benchmark-share measure shows that efficient international chain ITHs are able to more easily become benchmarks. The findings show that efficient international chain ITHs are more competitive and they should provide examples of operating practice.
Secondly, this study examines the managerial performance of ITHs for the period 1997–2002, using a two-stage procedure. In the first-stage analysis, the slack-based measure model and the window analysis are combined in order to sharpen the efficiency estimates over the period (1997-2002) with multiple operating data in both inputs and outputs. In the second stage, a Tobit regression analysis is employed to analyze the operating characteristics for exploring the variation of managerial performance among ITHs. Several empirical results are shown: (1) the trend of mean managerial efficiency is increasing, whereas the variation converges; (2) most ITHs operate at decreasing returns to scale, indicating that ITHs are facing a highly competitive environment; (3) Taiwan’s 921 earthquake in 1999, the 911 incident in 2001, and the compulsory government subsidies all play key roles which affect the ITHs’managerialperformancefor different operating characteristics in the short term; (4) results also indicate that differences in management style do have a very significant influence upon ITHs’performanceovertime(1997-2002).
Finally, our findings can serve as a guideline in the tourism industry for coping with issues relating to ITHs. It is also hoped that the models and methods implemented in this study can bring about other related research to a variety of industry.
Keywords: Data envelopment analysis; Benchmarking; Financial information; Input congestion measure; Benchmark-share measure; Window analysis; International Tourist Hotel
Acknowledgement
First, I would like to express my gratitude and indebtedness to my thesis advisor, Professor Chyan Yang, for his sincere supervision, fruitful guidance and valuable advice thoughtfully throughout my academic work. Words are inadequate to express my thanks to him that I have yet to see the limits of his wisdom, patience, and selfless concern for his students, and especially his pleasant characteristics as a mentor. He is the most erudite and kindest person I have ever met.
Next, I would like to express special thanks to Professor Cherng G. Ding and Professor Jin-Li Hu, for their kindness and helps with my graduate study. After that, I would also like to express my gratitude to Professor Wei-Tzen Yang, Professor Gwo-Hshiung Tzeng, Professor Shean-Bii Chiu, and Professor Tzong-Chen Wu for their valuable comments which have enriched this dissertation for a great extent.
In addition, special thanks should be given to others who accompany me but not being mentioned for their friendship and helps during my Ph.D. study. This work is dedicated to my parents for their love and support. Finally, I would like to share my pleasure of graduation with my wife and two lovely children.
Table of Contents
中文摘要...i Abstract ...iii Acknowledgement...vi Table of Contents...vii List of Tables...xList of Figures ...xi
Chapter 1 Introduction ...1
1.1 Research Motivation...1
1.2 Research Purpose...4
1.3 Organization of the Dissertation...5
Chapter 2 Literature Review...7
2.1 Indicator-Based Studies in the Hotel Industry...7
2.2 DEA Studies of the Hotel Industry ...9
Chapter 3 Research Design...14
3.1 Performance Models...14
3.2 Data Selection and Description ...19
3.3 Data Envelopment Analysis Model ...21
3.3.1 Efficiency Measurement Concepts...21
3.3.2 Multiplier Model of the CCR/BCC Model...23
3.3.3 The Dual Program of the CCR/BCC Model...25
3.3.5 Returns to Scale...28
3.3.6 Input Congestion Measure...29
3.3.7 Benchmark-Share Measure...30
3.3.8 Dynamic Extensions of DEA ...33
3.4 Tobit Regression Model...36
Chapter 4 Empirical Analysis ...37
4.1 Managerial Performance ...37
4.2 Potential Improvement in Efficiency...41
4.3 Measuring Input Congestion ...46
4.4 Identification of Benchmark...49
4.5 Analysis of Occupancy and Catering Performances ...53
4.6 Window Analysis...59
4.6.1 Efficient Frontier, Returns to Scale, and Benchmark ...60
4.6.2 Trend of Managerial Performance...66
4.6.3 Characteristics Affecting Hotel Managerial Performance...70
Chapter 5 Conclusions and Remarks ...71
References...74
Appendix A. The Detailed Information of ITHs in Taiwan ...81
Appendix B. Ranking Extensions to DEA Model ...85
B.1 Super Efficiency (Andersen and Petersen, 1993) ...85
B.2 Cross-Evaluation (Doyle and Green, 1994)...86
B.3 Infeasibility of Super-Efficiency Model (Seiford and Zhu, 1999)...89
B.5 Non-Oriented Super-SBM model (Tone, 2002)...92
B.6 Context-Dependent DEA (Seiford and Zhu, 2003) ...93
B.6.1 Stratification DEA Method ...93
B.6.2 Attractiveness Measure ...94
B.6.3 Progress Measure ...95
B.6.4 Attractiveness/Progress Cross-tabulation ...96
List of Tables
Table 1 Literature Survey of the DEA Model on the Hotel Industry ...13
Table 2 Descriptive Statistics for the 56 ITHs in Taiwan ...20
Table 3 Correlation Coefficients among Input Variables and Output Variables...20
Table 4 Effficiency Scores of the 56 ITHs ...39
Table 5 Non-Parametric Statistical Analysis of Management Style, Location, and Closeness to CKS ...40
Table 6 Potential Improvements Percent for the Thirty Inefficient ITHs...43
Table 7 Input Congestion for Thirty Inefficient ITHs ...48
Table 8 Descriptive and Summary Statistics for Inputs Congestion ...49
Table 9. Benchmark-Share Measure for Efficient ITHs...52
Table 10 Catering Efficiency and Occupancy Efficiency for 56 ITHs...57
Table 11 Efficiencies of ITHs of the Three-Year Windows During 1997-2002 ...62
Table 12 Non-Parametric Statistical Analysis of Management Style, Location, and Closeness to CKS ...68
List of Figures
Figure 1 Tourism 2020 Vision ...1
Figure 2 Average Daily Spending by Each Inbound Traveler, 2004 ...2
Figure 3 Research Flow Chart ...6
Figure 4 Managerial Performance Model...15
Figure 5 Occupancy Performance Model...15
Figure 6 Catering Performance Model ...16
Figure 7 Graphical Illustration of Measuring Technical Efficiency...22
Figure 8 Illustration of DEA Window Analysis...35
Figure 9 Potential Improvements for Grand Hotel Taipei ...45
Figure 10 Summaries of Overall Potential Improvements for Thirty Inefficient ITHs...45
Figure 11 Assessing Separately Occupancy and Catering Efficiencies...56
Figure 12 Managerial Efficiency of ITH Industry, 1997-2002...66
Figure 13 Managerial Efficiency with Management Type of ITHs...68
Figure 14 Managerial Efficiency with Location of ITHs ...69
Chapter 1 Introduction
1.1 Research Motivation
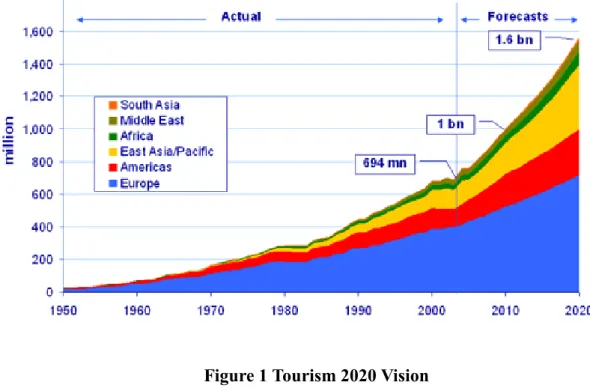
The World Tourism Organization reported that the number of outbound trips reached 760 million in 2004 and the global tourism trips will exceed 1.56 billion by 2020. The World Travel & Tourism Council also presented that global travel and tourism in 2005 produced about US$6.2 trillion in economic activity that has US$1.7 trillion on direct economic impact, i.e., 3.8% of global GDP.
Figure 1 Tourism 2020 Vision Source: World Tourism Organization
According to the annual report on tourism (2004), hotel bill takes 48.5% out of daily spending from the global travel and tourism. Because the hotel spending takes the most part of the spending in the travel and tourism that can produce the direct economic impact, therefore a country’s international tourist hotel industry plays a key role in her economic development and should be further studied.
US$ 180.52 US$ 180.52
Figure 2 Average Daily Spending by Each Inbound Traveler, 2004 Source: Annual Report on Tourism 2004
Taiwan’sinternational tourist hotel (ITH) industry is experiencing competitive pressure due to the rapid growth of new ITHs, deteriorating economic conditions, and inefficient management. The totalnumberofTaiwan’sITHshasincreased from 44 to 62 within the period of 1985 to 2004, while the total number of ordinary tourist hotels has decreased from 79 in 1985 to 25 in 2004. Moreover, as a result of the Asia Financial Crisis in 1997, Taiwan’s921 earthquake in 1999,the911 terrorist act in 2001, the Second Persian Gulf War in 2003, and the SARS epidemic in 2003, the growth rate of foreign tourists visiting Taiwan are decreasing.
Due to the above external reasons and inefficient management, 8 four-star ITHs closed in 1998. The ITHs in Taiwan need to improve their efficiency in management to survive in the serious situation. They have to identify the critical input/output factors to enhance their operating efficiency and managerial performance. In addition, the differences among hotel
operating characteristics, such as closeness to the international airport, location, and management style also may affect the efficiency and performance for ITHs. Hence, an examination of impacts of these factors on hotel performance does have the value for the international hotel industry.
According to the report of Taiwan Tourism Bureau (TTB), the hotel industry in Taiwan can be divided into ITHs and standard tourist hotels. The plum grading system is issued by TTB for hotel grading. This plum-grading system is similar to the star- grading system used by many countries in the world. A hotel with more plums means that it has more quantity of hotel facilities. By 2004, TTB has not used any grading system to measure the quality of hotel services. An ITH is a hotel with five or four plums, which provides many services and facilities to its guests, such as various types of guest rooms and restaurants, recreation (e.g. bars, night clubs, shopping stores), exercise facilities (e.g. swimming pools, gyms), children’s nursery, in-house medical consultation, and valet services, and business-related needs (convention venues, business center, and internet services). A standard tourist hotel is a medium size hotel with two or three plums, which only offers guests services such as accommodation and catering. The focus of this study is on ITHs because the degree of competitiveness in this marketplace is high and the amount of resources those hotels consumed to create outputs of services is considerable.
This operational performance study is conducted from hotel manager’s perspective. Theresultsofthisstudy can provideTaiwan ITHs’operationswith insightsinto resource allocation and competitive advantage and help with strategic decision-making, especially regarding operational styles under an intense competitive environment through high ITH density.
1.2 Research Purpose
Due to the importance of ITH efficiency measurement, the main interest of this study is therefore to address the issues related to the performance benchmarking analysis and the potential applications and strengths of DEA in assessing the ITHs. This study should provide additional managerial insights into hotel industry in Taiwan. The purposes of this study are fivefold:
The first purpose of this study is to provide a benchmarking analysis based on DEA to investigate hotel industry in Taiwan and assist the managers in improving the operational management of these hotels. Furthermore, we also design a decision-making matrix in terms of the occupancy and catering performances to help the manager and/or authorities to improve their operating efficiencies.
The second purpose concerns the different operational characteristics. The various ITHs’ characteristics are evaluated to determine their relationships to the ITH industry’s efficiency. The key ITH operating characteristics (i.e., international chain or independent-owned, metropolitan areas or resort areas, closeness to international airport or not) are needed to be figured out and to provide insight into what factors cause imperfectly competitive conditions for some ITHs. The results will also aid operation managers in improving their ITHs by benchmarking their ITHs against similar ITHs.
The third purpose is related to the so-called input congestion. By definition, input congestion (Cooper et al., 2001) means that there are increments in inputs which, however, result in a decrease in output. An excessive amount of labor or capital input can be a major source of inefficiency. The problem of input congestion thus far is less discussed in the literature regarding the hotel industry. We will use herein a slack-based approach (Cooper et
al., 2001) to measure the input congestion. This method not only detects congestion, but also determines the amount of congestion and simultaneously identifies factors responsible for causing congestion in an inefficient ITH.
The fourth purpose concerns a situation whereby using the DEA model may produce many ITHs with a full efficient status denoted by unity. These efficient ITHs are worthy of further analysis to identify the real benchmark for each input/output. To discriminate these efficient ITHs, this study applies the benchmark-share measure (Zhu, 2000) defining a ranking measure by combining the factor-specific measure and VRS (variable returns-to-scale) / BCC (Banker et al., 1984) model.
The fifth purpose of this study focuses on the dynamic window analysis. Most DEA analysis is cross sectional which compares the performance ofdecision making units (DMUs) in the same time period. One window analysis approach performing the longitudinal design is used to compare cross-sectional running across the number of time periods in this study. This approach introduces variability into the analysis because it treats the performance of DMU in each time period as independent from the previous period. Such an approach would allow a dynamic view of the multidimensional performance of ITHs in Taiwan.
1.3 Organization of the Dissertation
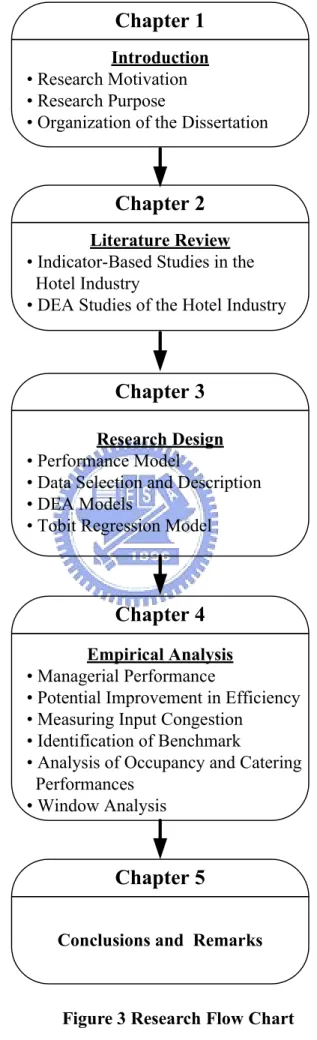
This dissertation is organized in the following manner as Figure 3 shows: Chapter 1 presents the motives and purposes of the study, and briefly introduces the structure of this work. Prior studies which have influenced this study are discussed in Chapter 2. Chapter 3 proposes a research design that includes the criteria for performance evaluation, the data selection and description, and the introduction of DEA methodology. The empirical results and interpretations are provided in Chapter 4. Finally, Chapter 5 concludes this dissertation.
Chapter 1
Introduction •Research Motivation •Research Purpose
•Organization of the Dissertation
Chapter 2
Literature Review •Indicator-Based Studies in the
Hotel Industry
•DEA Studies of the Hotel Industry
Chapter 3
Research Design •Performance Model
•Data Selection and Description •DEA Models
•Tobit Regression Model
Chapter 4
Empirical Analysis •Managerial Performance
•Potential Improvement in Efficiency •Measuring Input Congestion
•Identification of Benchmark
•Analysis of Occupancy and Catering Performances
•Window Analysis
Chapter 5
Conclusions and Remarks
Chapter 2 Literature Review
Many researchers have conducted much of research to measure efficiency and performance in the hotel industry. According the methodology used by researchers, previous studies can be divided into two streams of research: one stream of research using simple performance indicator and the other stream of research using DEA. To provide a detailed review of many works in is beyond the scope of this dissertation. We shall only explore some important research works in the hotel management literature relevant to our study. A survey of literature on performance measurement in the hotel industry follows.
2.1 Indicator-Based Studies in the Hotel Industry
The hotel management literature is rich in studies that attempt to measure efficiency and performance in hotel industry. Most of the limited research on performance measurement in the hotel industry has used a variant of performance indicators. These studies mostly focus on single indicators such as cost-volume-profit (Fay et al., 1971; Jaedicke and Robichek, 1975; Coltman, 1978), the lodging industry’s sales receipt information (Van Doren and Gustke, 1982), the concept of perishable asset revenue management to measure performance (Kimes, 1989), lodging index (Wassenaar and Stafford, 1991), a revenue performance indicator (Baker and Riley, 1994), and an efficiency indicator (Wijeysinghe, 1993).
Cost-volume-profit analysis, or breakeven analysis, is used to compute the volume level at which total revenues are equal to total costs. When total costs and total revenues are equal, the business organization is said to be “breaking even.” The analysis is based on a set of linear equations for a straight line and the separation of variable and fixed costs. It can not only be used to analyze the performance of an individual firm, but it can be applied at a
regional level for the purpose of comparing various types of firms (Fay et al., 1971; Jaedicke and Robichek, 1975; Coltman, 1978). Van Doren and Gustke (1982) use lodging industry sales receipt information to gauge industry performance. This technique does not examine cost efficiency issues and does not provide a method of determining optimal performance.
Kimes (1989) utilizes the basic concept of perishable asset revenue management (PARM) to measure performance in the hotel industry. PARM allows management to determine the optimal trade-off between the average daily rates and the occupancy rates. The basic idea of PARM techniques involves charging the right price in order to select the right customers to fill each room, while achieving the highest possible revenues. The benefits of PARM are generally attributed to three main categories: overbooking, proper allocations among the numerous rate classes, and length of stay.
Wassenaar and Stafford (1991) advocate the use of a lodging index indicator for the hotel/motel industry. The lodging index is defined as the average revenue realized from each room, vacant or occupied, within a region or city during a given time period. They suggest that the index is particularly effective for local travel destinations where average occupancy and room rates are not available. While it combines average occupancy and room rates into a single indicator, this method does not examine how efficiently firms are controlling costs.
Another common indicator is the labor-cost ratio, the ratio of payroll expenses to sales, which is commonly referred to as the labor-cost percentage. However, this index is easily distorted by changes in sales revenue, and it is not necessarily a reflection of efficiency and productivity. In addition, it is of limited value because it is an aggregate, nonspecific figure. In order to illustrate a complete picture of payroll efficiency, total labor hours, sales per labor hour and labor cost per labor hour are needed. Multiple measurements provide an accurate index of labor productivity. When used as a weekly basis to analyze payroll costs, these
measurements offer far better tools for forecasting and adjusting labor costs.
Wijeysinghe (1993) suggests a method for calculating breakeven room occupancy that provides accurate calculations together with a system of effective management. He suggests that general indicator to hotel efficiency can be used to analyze the source of loss and, therefore, give a better control of the business. Other common economic indicators of the lodging industry performance measure revenue (Baker and Riley, 1994) such as revenue/wage cost, gross profit/revenue, and net profit/revenue.
Although these accounting and financial indicators in terms of simple ratios provide importantand usefulinformation forbenchmarking ahotel’sfinancialperformance,thereare in fact many factors relative to hotel performance, and obviously these techniques have not taken into account the mix and nature of services provided. As suggested by Anderson et al. (1999), measuring the relative efficiency of a hotel requires methods that are more sensitive than accounting and ratio measures and that can explicitly consider the mix of service outputs produced.
2.2 DEA Studies of the Hotel Industry
To overcome the drawbacks mentioned above, DEA has been used to measure hotel performance over the last decade. DEA has many desirable features (Charens et al., 1994) which may explain why researchers are interested in using it to investigate the efficiency of converting multiple inputs into multiple outputs. Furthermore, DEA is also a theory-based, transparent, and reproducible computational procedure. In comparison to the traditional approaches such as ratio analysis and regression analysis (Sherman, 1986), DEA has gained several more advantages. These characteristics include (Lewin et al., 1982):
terms of their utilization of input factors to produce desired outputs;
able to handle non-commensurate multiple outputs and multiple input factors; able to adjust for factors outside the control of the unit being evaluated;
not dependent on a set of a priori weights or prices for the inputs or the outputs; able to handle qualitative factors such as consumer satisfaction, quality of
employees, etc.;
able to provide insights on the possibilities for increasing outputs and/or conserving inputs for the inefficient unit to become efficient;
able to maintain equity in performance assessment.
One major advantage is that DEA has emerged as the leading method for efficiency evaluation in terms of both the number of research papers published and the number of applications to real world problems (Seiford, 1997; Gattoufi et al., 2004; Yang et al., 2006; Yang and Lu, 2006). Previous studies that used DEA to investigate the relative efficiency of the hotel industry are now described as follows.
Bell and Morey (1995) employ DEA to measure the relative efficiency of 31 travel departments in the United States. Morey and Dittman (1995) implement DEA to probe the general-manager performances of 54 owner-managed hotels of a nationally known chain, geographically dispersed over the continental United States. This study provides the owners of single properties with the ability to benchmark a manager’s performance. By using the stochastic frontier approach, Anderson et al. (1999) evaluate the managerial efficiency of 48 hotels using operating data in the year 1997. Anderson et al. (2000) employ DEA to re-evaluate the managerial efficiency of 48 hotels using the data in Anderson et al. (1999). This study contradicts previous studies, which find the hotel industry to be nearly perfectly competitive and efficient. The major reason is that they use a more comprehensive
efficiency measure and are able to capture more inefficiency.
Tsaur (2000) uses DEA to measure the operating efficiency of 53 ITHs in Taiwan using operating data from 1996-1998. The study reports that the market for lodging services seems to be operating efficiently in Taiwan. Hwang and Chang (2003) utilize DEA and the Malmquist productivity index (Färe et al., 1992) to measure the managerial performance of 45 Taiwanese hotels in 1998 and the efficiency change of them from 1994 to 1998. This study shows that the entire industry can be partitioned into six clusters based on relative managerial efficiency and efficiency change. Effective management strategies are developed specifically to each of the six clusters of hotels.
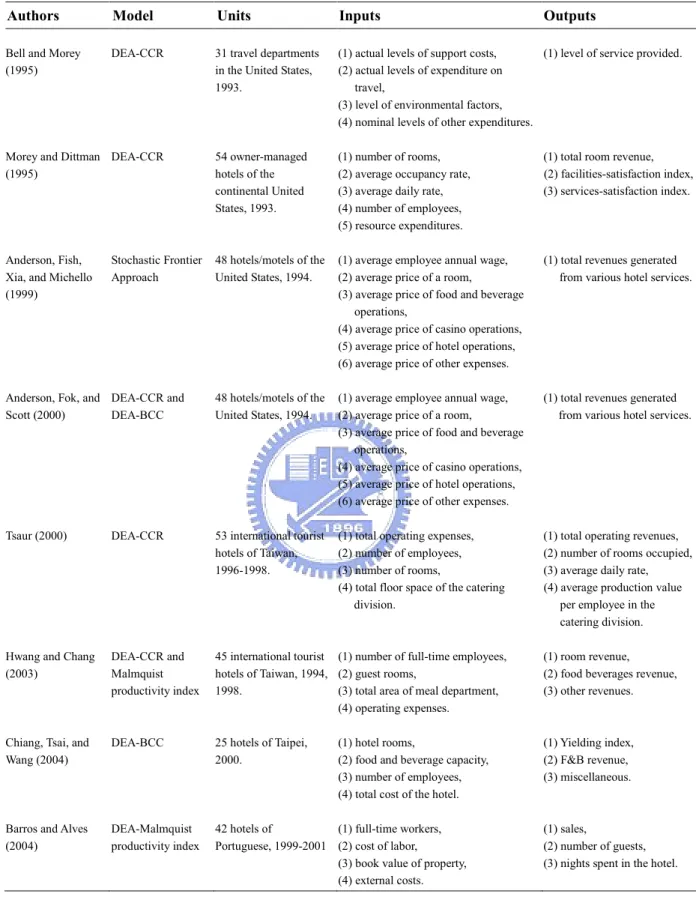
Chiang et al. (2004) implement DEA to measure25 TaipeiITHs’performancesunder three operational styles of ITHs using operating data from 2000. The finding shows that not all of Taipei’s franchised or managed ITHs performed more efficient than the independent-owned ones. Barros and Alves (2004) analyze the efficiency of Portugal’s public-owned hotel chain, Enatur, with the Malmquist productivity index for the period 1999-2001. The study reports that few hotels achieved total productivity improvements in that period. Table 1 presents the characteristics of these main studies using DEA.
This study contributes four extensions to the existing research. Firstly, this study presents a very good review of previous research in this important sector of the economy. Despite the significant work already done in this area, we rightly point to the fact that many elements have not been covered in that previous work. Moreover, we also provide a good discussion of our findings and make concrete recommendations regarding the direction for improvement. Secondly, the problem of input congestion thus far is less discussed in the literature regarding the hotel industry. We will use herein a slack-based approach (Cooper et al., 2001) to measure the input congestion. This method not only detects congestion, but
also determines the amount of congestion and simultaneously identifies factors responsible for causing congestion in an inefficient ITH.
Thirdly, this study concerns a situation whereby using the DEA model may produce many ITHs with a full efficient status denoted by unity. These efficient ITHs are worthy of further analysis to identify the real benchmark for each input/output. To discriminate between these efficient ITHs, this study firstly applies the benchmark-share measure (Zhu, 2000) defining a ranking measure by combining the factor-specific measure and VRS (variable returns-to-scale) / BCC (Banker et al., 1984) model in hotel industry. Lastly, this study is the first research that has combined the discriminant power of SBM model (Tone, 2001) and the dynamic view of window analysis (Charnes et al., 1985) in applying DEA to measure the productivity growth of ITHs in Taiwan over the years of 1997-2002.
Table 1 Literature Survey of the DEA Model on the Hotel Industry
Authors Model Units Inputs Outputs
Bell and Morey (1995)
DEA-CCR 31 travel departments in the United States, 1993.
(1) actual levels of support costs, (2) actual levels of expenditure on
travel,
(3) level of environmental factors, (4) nominal levels of other expenditures.
(1) level of service provided.
Morey and Dittman (1995) DEA-CCR 54 owner-managed hotels of the continental United States, 1993. (1) number of rooms, (2) average occupancy rate, (3) average daily rate, (4) number of employees, (5) resource expenditures.
(1) total room revenue, (2) facilities-satisfaction index, (3) services-satisfaction index.
Anderson, Fish, Xia, and Michello (1999)
Stochastic Frontier Approach
48 hotels/motels of the United States, 1994.
(1) average employee annual wage, (2) average price of a room,
(3) average price of food and beverage operations,
(4) average price of casino operations, (5) average price of hotel operations, (6) average price of other expenses.
(1) total revenues generated from various hotel services.
Anderson, Fok, and Scott (2000)
DEA-CCR and DEA-BCC
48 hotels/motels of the United States, 1994.
(1) average employee annual wage, (2) average price of a room,
(3) average price of food and beverage operations,
(4) average price of casino operations, (5) average price of hotel operations, (6) average price of other expenses.
(1) total revenues generated from various hotel services.
Tsaur (2000) DEA-CCR 53 international tourist hotels of Taiwan, 1996-1998.
(1) total operating expenses, (2) number of employees, (3) number of rooms,
(4) total floor space of the catering division.
(1) total operating revenues, (2) number of rooms occupied, (3) average daily rate, (4) average production value
per employee in the catering division. Hwang and Chang
(2003) DEA-CCR and Malmquist productivity index 45 international tourist hotels of Taiwan, 1994, 1998.
(1) number of full-time employees, (2) guest rooms,
(3) total area of meal department, (4) operating expenses.
(1) room revenue, (2) food beverages revenue, (3) other revenues.
Chiang, Tsai, and Wang (2004)
DEA-BCC 25 hotels of Taipei, 2000.
(1) hotel rooms,
(2) food and beverage capacity, (3) number of employees, (4) total cost of the hotel.
(1) Yielding index, (2) F&B revenue, (3) miscellaneous.
Barros and Alves (2004) DEA-Malmquist productivity index 42 hotels of Portuguese, 1999-2001 (1) full-time workers, (2) cost of labor, (3) book value of property, (4) external costs.
(1) sales,
(2) number of guests, (3) nights spent in the hotel.
Chapter 3 Research Design
Firstly, this study utilizes a production approach to design three performance models, namely, managerial performance, occupancy performance and catering department performance in section 3.1. Data selection and description are given in section 3.2. Section 3.3 presents an extension to the DEA, by incorporating the traditional DEA, input congestion measure, benchmark-share measure, slack-based measure, and window analysis for assessing the relative efficiency in current-period and the efficiency variation in cross-period for ITHs. Finally, the tobit regression analysis is employed to analyze the operating characteristics for exploring the variation of managerial performance among ITHs in section 3.4.
3.1 Performance Models
The hotel industry provides guests such services as accommodation, catering, entertainment, convention venues, social activities, and shopping. Among these services, accommodation and catering have been two main revenue sources for international tourist hotels in Taiwan since 1991. As reported by TTB (2003), these two services contributed more than 84 percent of total revenues of 56 ITHs in 2002; and catering revenues amounting to 45.93% of total revenues, had surpassed that of room revenues (38.89% of total revenues). Therefore, it may be necessary to assess the ITH performance on various dimensions, thus guiding managerial action. In this study, we use a production approach to design three performance models, namely, managerial performance, occupancy performance and catering department performance.
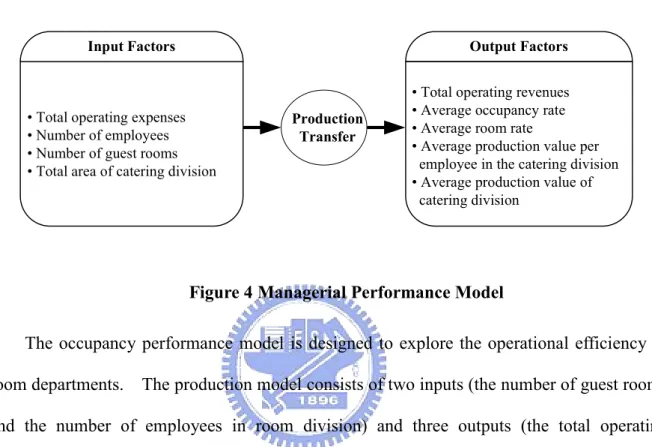
The managerial performance model is to measure the managerial efficiency of hotel operations. The production model consists of four inputs: total operating expenses, the
number of employees, the number of guest rooms, and total area of the catering department; and five outputs: total operating revenues, average occupancy rate, average room rate, average production value per employee in the catering department, and average production value of catering department (See Figure 4).
Input Factors
•Total operating expenses •Number of employees •Number of guest rooms •Total area of catering division
•Total operating revenues •Average occupancy rate •Average room rate
•Average production value per employee in the catering division •Average production value of
catering division Output Factors
Production Transfer
Figure 4 Managerial Performance Model
The occupancy performance model is designed to explore the operational efficiency of room departments. The production model consists of two inputs (the number of guest rooms and the number of employees in room division) and three outputs (the total operating revenues of room division, average occupancy rate, and average room rate) (See Figure 5).
Input Factors
•Number of guest rooms •Number of employees in room
division
•Total operating revenues of room division
•Average occupancy rate •Average room rate
Output Factors
Production Transfer
Figure 5 Occupancy Performance Model
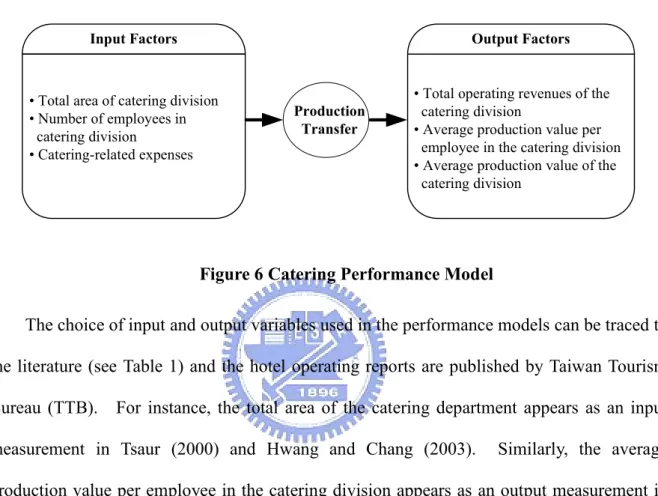
The catering performance model is to measure the operational efficiency of the catering departments. The production model consists of three inputs (total area of catering division,
the number of employees in the carting department and catering-related expenses) and three outputs (total operating revenues of the catering department, average production value per employee in the catering department, and average production value of the catering division) (See Figure 6).
Input Factors
•Total area of catering division •Number of employees in
catering division
•Catering-related expenses
•Total operating revenues of the catering division
•Average production value per employee in the catering division •Average production value of the
catering division Output Factors
Production Transfer
Figure 6 Catering Performance Model
The choice of input and output variables used in the performance models can be traced to the literature (see Table 1) and the hotel operating reports are published by Taiwan Tourism Bureau (TTB). For instance, the total area of the catering department appears as an input measurement in Tsaur (2000) and Hwang and Chang (2003). Similarly, the average production value per employee in the catering division appears as an output measurement in Tsaur (2000). Information on qualitative indices including the physical-facilities-satisfaction index and the service-satisfaction index are not available. Therefore, these input/output factors are excluded from our performance model. The input and output factors used in this study are defined as follows.
Input factors
Total operating expenses (x ): the items of operation expenses of ITHs; as a whole,1 they include salary and relating expenses, catering costs, water and electricity fuel expenses, depreciation expenses, maintenance and repair costs, rent and so forth,
measured in units of thousand NT$.
Number of employees (x ): refers to the number of individual employees who are2 involved in the operation of ITHs, including medium- and high-ranking executives, guest rooms and catering staff, cooks, maintenance crews, and repairmen.
Number of guest rooms (x ): refers to the amount of guest rooms that can be3 provided for rent by an ITH. Accordingly, the unit of measurement is simply ‘room’, without any subsequent adjustment being made for size or quality.
Total area of catering division (x ): refers to the total floor space used by the4 operational units of all the ITH’s catering facilities, measured in square feet.
Number of employees in catering division (x ): refers to the number of individual5 employees that are involved in the operation of ITHs in their catering divisions, such as the medium- and high-ranking executives, catering staff and cooks.
Catering-related expenses (x ): refers to the cost of food and beverages sold,6 measured in NT$.
Number of employees in room division (x ): refers to the number of individual7 employees that are involved in the operation of ITHs in the room division, such as the medium- and high-ranking executives, housekeeper and reservation clerk and front desk clerk.
Output factors
Total operating revenues (y ): the operational revenue of ITHs includes the income1 from guest rooms, catering services, laundry, stores, attached operating income, and service fees, measured in units of thousand NT$.
guestrooms let and those available to be let.
Average room rate (y ): refers to the ratio between the income from guest rooms3 and the actual number of guest rooms, measured in NT$/room.
Average production value per employee in the catering division (y ): refers to the4 ratio between total revenues from the catering division and the number of employees in the catering division, measured in NT$/individual.
Average production value of the catering division (per 36 square feet) (y ): refers to5 the ratio between total revenues from the catering division and the total floor space of catering division, measured in NT$/ (per 36 square feet).
Total operating revenues of the catering division (y ): refers to income from food6 and beverage sales, measured in NT$.
Total operating revenues of room division (y ): refers to the income from room7 rental, measured in NT$.
3.2 Data Selection and Description
This study investigates 56 ITHs in Taiwan based on the ITHs’operation data shown in the period 2002. Each of these ITH is treated as a decision making unit (DMU) in the DEA analysis. The 56 ITHs of various sizes and geographical dispersement are selected since they are officially ranked as being eitherfourorfive‘plums’. Note that in Taiwan the highest rating of an ITH with five‘plums’isequivalentto five‘stars’in theU.S. The performances of the ITHs are accessed based on the data obtained for the year 2002. The data are extracted from the annual report of the TTB. Table 2 presents descriptive statistics for our dataset. Input/output data are reported as the total number throughout the year and can be found in The Operating Report of International Tourist Hotel in Taiwan (2003) published by the TTB, the newest published document. This report is commonly deemed as valid, reliable, and available to the public.
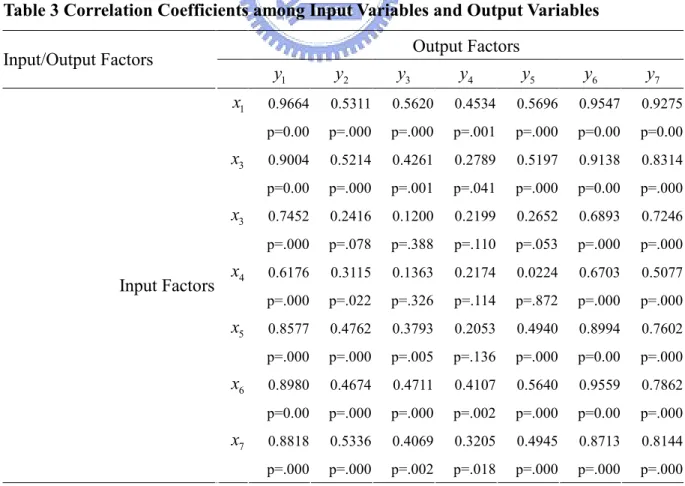
Table 3 shows the correlation matrix of inputs x and outputsi y . Notice that all thei correlation coefficients are positive. Therefore,theseinputsand outputshold ‘isotonicity’ relations, and thus these variables are justified to be included in the model. Cooper et al. (2001) suggested that the number of ITHs should be at least triple the number of inputs and outputs considered. In this study the number of ITHs is fifty-six, at least triple the selected nine factors for the managerial performance model. We hence conclude that the developed DEA model of the managerial performance model holds high construct validity. Following the above rules, the occupancy/catering performance model also achieves high construct validity. In addition, we used panel data covering observations on the outputs and inputs of 46 ITHs, which are marked with a * in Table 4, for 1997-2002 to measure managerial efficiency changes for those ITHs.
Table 2 Descriptive Statistics for the 56 ITHs in Taiwan
Mean Minimum Maximum Std. Dev. Valid N
Input Factors 1 x 491,393,382 24,091,643 2,180,044,201 434,942,789 56 2 x 334 26 989 242 56 3 x 313 50 873 164 56 4 x 1,039 48 3,727 784 56 5 x 152 2 509 127 56 6 x 90,816,114 827,577 315,654,445 80,191,181 56 7 x 91 4 270 63 56 Output Factors 1 y 529,329,810 15,379,118 2,550,224,684 515,597,340 56 2 y 60 11 83 15 56 3 y 2,726 866 5,917 1,105 56 4 y 1,504,250 263,379 3,172,857 537,354 56 5 y 237,197 1,194 572,844 142,569 56 6 y 243,141,430 526,757 985,649,421 236,062,687 56 7 y 205,853,918 7,153,742 1,105,255,609 195,470,617 56
Table 3 Correlation Coefficients among Input Variables and Output Variables Output Factors Input/Output Factors 1 y y2 y3 y4 y5 y6 y7 1 x 0.9664 0.5311 0.5620 0.4534 0.5696 0.9547 0.9275 p=0.00 p=.000 p=.000 p=.001 p=.000 p=0.00 p=0.00 3 x 0.9004 0.5214 0.4261 0.2789 0.5197 0.9138 0.8314 p=0.00 p=.000 p=.001 p=.041 p=.000 p=0.00 p=.000 3 x 0.7452 0.2416 0.1200 0.2199 0.2652 0.6893 0.7246 p=.000 p=.078 p=.388 p=.110 p=.053 p=.000 p=.000 4 x 0.6176 0.3115 0.1363 0.2174 0.0224 0.6703 0.5077 p=.000 p=.022 p=.326 p=.114 p=.872 p=.000 p=.000 5 x 0.8577 0.4762 0.3793 0.2053 0.4940 0.8994 0.7602 p=.000 p=.000 p=.005 p=.136 p=.000 p=0.00 p=.000 6 x 0.8980 0.4674 0.4711 0.4107 0.5640 0.9559 0.7862 p=0.00 p=.000 p=.000 p=.002 p=.000 p=0.00 p=.000 7 x 0.8818 0.5336 0.4069 0.3205 0.4945 0.8713 0.8144 Input Factors p=.000 p=.000 p=.002 p=.018 p=.000 p=.000 p=.000
3.3 Data Envelopment Analysis Model
3.3.1 Efficiency Measurement Concepts
DEA is known as a mathematical programming method for assessing the comparative efficiencies of a DMU. DEA is a non-parametric method that allows for an efficient measurement, without specifying either the production functional form or weights on different inputs and outputs. This methodology defines a non-parametric best practice frontier that can be used as a reference for efficiency measurement which can be found in Cooper et al. (2000).
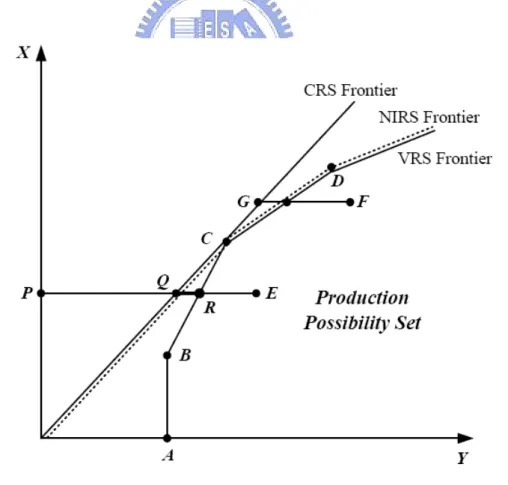
The input-oriented technical efficiency implies “by how much can input quantities be proportionally reduced without changing the output quantities produced?” The efficiency frontier presents that each DMU minimizes its inputs, keeping the output level constant. DMUs on the frontier are efficient, while DMUs inside the frontier are inefficient. Consider the case of a single input x and a single output y. In Figure 7, the constant returns to scale (CRS) frontier is a simple ray (ray 0C) through the origin that envelops the data. The efficient DMU at point C lies on this frontier and its technical efficiency (TE) score equals one. The other four DMUs (B, E, D, F) operating inside the frontier are inefficient. The TE score for the DMU operating at point E is defined by PQ PE. However, the CRS assumption is only appropriate when all DMUs are operating at an optimal scale. Many realistic factors, such as imperfect competition, financial constraints, etc., may cause a DMU not to operate at optimal scale. Thus, there is also a variable returns to scale (VRS) DEA model. In Figure 7, the VRS frontier is the piecewise linear frontier ABCD. This general form envelops the data more closely. The DMUs at B, C, and D lying on this frontier are efficient with a score of one. The relative inefficient DMU E is given by a pure technical
efficiency (PTE) score (PR PE). The TE is decomposed into PTE and scale efficiency (SE). The SE can be estimated by dividing PTE into TE.
To investigate the current operating region to scale inefficient DMUs, this may be determined by running an additional DEA problem with non-increasing returns to scale (NIRS) imposed. This may be determined by running an additional DEA problem with non-increasing returns to scale (NIRS) imposed. The NIRS DEA frontier is also plotted in Figure 7. The nature of the scale inefficiencies (i.e. due to increasing or decreasing returns to scale) for a particular DMU can be determined by seeing whether the NIRS TE score is equal to the VRS TE score. If they are unequal (as will be the case for the point E in Figure 7), then increasing returns to scale (IRS) exist for the DMU. If they are equal (as is the case for point F in Figure 7), then decreasing returns to scale (DRS) apply.
Figure 7 Graphical Illustration of Measuring Technical Efficiency (Input-Oriented DEA Using a Single Input to Produce a Single Output)
3.3.2 Multiplier Model of the CCR/BCC Model
DEA is a mathematical model that measures the relative efficiency of decision-making units with multiple inputs and outputs but with no obvious production function to aggregate the data in its entirety. Relative efficiency is defined as the ratio of total weighted output to total weighted input. By comparing n units with s outputs denoted by y ,ro r 1, ,s, and m inputs denoted by x ,io i, ,m, the efficiency measure for the target DMUo (o 1, ,n) is 1 1 s r ro r o m i io i u y h Max v x
,where the weights, u andr v , are non-negative. A second set of constraints requires thati the same weights, when applied to all DMUs, do not provide any unit with efficiency greater than one. This condition appears in the following set of constraints:
1 1 1 s r rj r m i ij i u y v x
, for j 1, ,n.The efficiency ratio ranges from zero to one, with the target DMU being consideredo relatively efficient if it receives a score of one. Thus, each unit will choose weights so as to maximize self-efficiency, given the constraints. The result of the DEA is the determination of the hyperplanes that define an envelope surface or Pareto frontier. DMUs that lie on the surface determine the envelope and are deemed efficient, whilst those that do not are deemed inefficient. The formulation described above can be translated into a linear program, which can be solved relatively easily and a complete DEA solves n linear programs, one for each
DMU. 1 1 1 1 . . 1, 0, 1, , , , 0; 1, , ; 1, , s o r ro r m i io i s m r rj i ij r i r i h Max u y s t v x u y v x j n u v i m r s
(1)Eq. (1), often referred to as the CCR model (Charnes et al., 1978), assumes that the production function exhibits constant returns to scale. The BCC model (Banker et al., 1984) adds an additional constant variable, u , in order to permit variable returns to scale:o
1 1 1 1 . . 1, 0, 1, , , free in sign, , 0; 1, , ; 1, . s o r ro o r m i io i s m r rj i ij o r i o r i h Max u y u s t v x u y v x u j n u u v i m r s
(2)It should be noted that the results of the CCR input-minimized or output-maximized formulations are the same, which is not the case in the BCC model. Thus, in the output-oriented BCC model, the formulation maximizes the outputs given the inputs and vice versa.
3.3.3 The Dual Program of the CCR/BCC Model
If a DMU proves to be inefficient, a combination of other efficient units can produce either greater outputs for the same composite of inputs, use fewer inputs to produce the same composite of outputs or some combination of the two. A hypothetical decision making unit can be composed as an aggregate of the efficient units, referred to as the efficient reference set for inefficient DMU . The solution to the dual problem of the linear program directlyo computes the multipliers required to compile efficient units. The pure technical efficiency (PTE) of the target DMU (o o 1, ,n) in the BCC model can be computed as a solution to the following linear programming (LP) problem.
1 1 1 . . , 1, , , , 1, , , 1, 1, , , , 0; . o n j ij o io j n j rj ro j n j j o j Min s t x x i m y y r s j n i and r
(3)In the case of an efficient DMU, all dual variables will equal zero except for ando
o
, which reflect the DMU ’o s efficiency, both of which will equal one. If DMU iso
inefficient, will equal the ratio solution of the primal problem. The remaining variables,o
j
, if positive, represent the multiples by which DMU ’o s inputs and outputs should be
multiplied in order to compute the composite efficient DMU. If
nj1j 1 is dropped from Eq.(3), then the technology is said to exhibit constant returns to scale (CRS). The technical efficiency (TE) of the target DMUo is defined as TE = under theo input-oriented CRS model (Charnes et al., 1978).3.3.4 The Slack-Adjusted CCR/BCC Model
In the slack-adjusted DEA models, see for example model (3), a weakly efficient DMU will now be evaluated as inefficient, due to the presence of input and output oriented slacks
i
s and sr, respectively. The pure technical efficiency (PTE) of the target DMUo (o 1, ,n) in the BCC model can be computed as a solution to the following linear programming (LP) problem. 1 1 1 1 1 . . , 1, , , , 1, , , 1, , , , 0; 0; . m s o i r i r n j ij i o io j n j rj r ro j n j j o j i r Min s s s t x s x i m y s y r s s s i and r
(4)The PTE of the target DMU is defined as PTEo . By varying the indexo ' 'o over all DMUs, we arrive at the PTE in each DMU. If PTE 1 and all input and output slacks, s and s, are equal to zero, then the DMU is technically efficient. If PTE iso smaller than one, then DMUo is technically inefficient. The solution value of j
indicates whether DMUj serves as a role model or peer for DMU . Ifo j 0, then j
DMU is not a peer. However, if j 0, say j 0.4, then DMUj is a peer DMU with a 40 percent weight placed on deriving the target efficient output and input levels for DMU .o For an inefficient DMU , we have the expression in Eq. (5).o
1 1 , 1, , , , r 1, , , n o io ij j i j n ro rj j r j x x s i m y y s s
(5)where jo, si ,sr and j are optimal slacks and weights obtained from Eq. (4). The
,
o io ro
DMU x y can be improved and become efficient by deleting its excess input and augmenting the shortfall output as follows:
1 1 ˆ , 1, , , ˆ = , r 1, , . n io o io i ij j j n ro ro r rj j j x x s x i m y y s y s
(6)This operation is called BCC-projection.
If
1 1
n j
j
is dropped from Eq.(4), then the technology is said to exhibit constant returns to scale (CRS). The technical efficiency (TE) of the target DMU is defined asoTE= under the input-oriented CRS model (Charnes et al., 1978). The scale efficiencyo (SE) for the target DMU is then obtained as.o
/ .
SE TE PTE (7)
The SE represents the proportion of inputs that can be further reduced after pure technical inefficiency is eliminated if scale adjustments are possible. It has a value of less than or equal to one. If the target DMU has a value equal to one, then it is operating ato the constant returns to scale size. If SE is less than one, then the target DMU is scaleo inefficient and there is potential input savings through the adjustment of its operational scale. Whether the scale inefficient DMU should be either downsizing or expanding depends ono its current operating scale.
3.3.5 Returns to Scale
There are at least three different basic methods of testing a DMU's returns to scale (RTS) nature which have appeared in the DEA literature. Banker (1984) shows that the CCR model can be employed to test for DMUs' RTS using the concept of most productive scale size (MPSS), i.e. the sum of the CCR optimal lambda values can determine the RTS classification. This method is called the CCR RTS method. Banker et al. (1984) report that a new free BCC dual variable (u ) estimates RTS by allowing variable returns to scale (VRS)o for the CCR model, i.e. the sign of u determines the RTS. We call this method the BCCo RTS method. Finally, Färe et al. (1985) provide the scale efficiency index method for the determination of RTS using DEA. These three RTS methods, in fact, are equivalent but different presentations (Banker et al., 1996; Färe et al., 1994; Zhu et al., 1995).
The three basic RTS methods have been widely employed in real world situations (Byrnes et al., 1984; Charnes et al., 1989; Zhu, 1996a). However, it has been noted that the CCR and BCC RTS methods may fail when DEA models have alternate optima, i.e. the original CCR and BCC RTS methods assume unique optimal solutions to the DEA formulations. In contrast to the CCR and BCC RTS methods, the scale efficiency index method does not require information on the primal and dual variables and, in particular, is robust even when there exist multiple optima. Since it may be impossible or at least unreasonable to generate all possible multiple optima in many real world applications, a number of modifications or extensions of the original CCR and BCC methods have been developed to deal with multiple optima.
Banker and Thrall (1992) generalize the BCC RTS method by exploring all alternate optima in the BCC dual model, i.e. RTS in their extended technique is measured by intervals for u . Banker et al. (1995) further modified the technique to avoid the need for examiningo
all alternate optima. Using the same technique, Banker et al. (1996) introduce a modification to the CCR RTS method by determining the maximum and minimum values of
1
n j j
in the CCR model in order to reach a decision. On the other hand, by the scale efficiency index method, Zhu and Shen (1995) suggest a remedy for the CCR RTS method under possible multiple optima.According to the recent result of Zhu and Shen (1995), one can easily estimate the returns to scale (RTS) by the CCR and BCC scores and
nj1j in any optimal solution to the CCR model without exploring all possible multiple optimal solutions. That is, if CCR score is equal to the BCC score, then CRS (constant return to scale) prevails; otherwise, if the CCR and BCC scores are not equal, then
nj1j 1 indicates IRS (increasing returns to scale) and1 1
n j
j
indicates DRS (decreasing returns to scale). 3.3.6 Input Congestion MeasureThe input congestion is next measured. ‘Input congestion’was first defined in Cooper et al. (2001) as “increasing in one or more inputs associated with decreasing in one or more outputs.” A slack-based approach (Cooper et al., 2001) is defined as a congestion measure to capture input congestion and identifies its sources and amounts by the BCC model in Eq. (1). This method not only detects congestion, but also determines the amount of congestion and simultaneously identifies factors responsible for congestion. This study measures the congestion of operating expenses, employees, guest rooms, and the area of the catering division for the managerial performance model.
Input congestion for the target DMU can be computed as a solution to the followingo linear programming (LP) problem (Cooper et al., 2001).
1 * * 1 * 1 1 * . . ˆ, 1, , , ˆ, 1, , , 1, 0, , m i i n j ij i o io i io j n j rj ro r ro j n j j j i i Max s t x x s x i m y y s y r s s
(8) where * o , * i s, and * rs are obtained from Eq. (4) and all variables are constrained to be non-negative. Notice that the inequality in Eq. (8) for the inputs implied in the first
1, ,
i m constraints is reversed from the usual form exhibited in Eq. (4). The objective in Eq. (8) is to maximize the sum of the input slacks with the additional constraint *
i i
s
limiting each slack to the maximum value obtained in the preceding solution to Eq. (4). The amount of congestion in each input for DMU can then be determined by the differenceo between each pair of *
i
s and *
i
, where *
i
are optimal values in Eq. (8). That is,
* * 0, 1, , , c i i i s s i m (9) where c i
s in Eq. (9) are then called input congestion slacks. These c i
s values, when positive, represent the congesting amounts in each of the i 1, ,m inputs, while * 0
i
represent the corresponding technical inefficiency components.
3.3.7 Benchmark-Share Measure
For an inefficient decision making unit, what is even more important is to find out a benchmark peer to improve the technical inefficient. There are numerous studies devoted to developing methods to identify a benchmark in the DEA models (see Andersen and Petersen,
1993; Seiford and Zhu, 1999; Li and Reeves, 1999; Tone, 2002). However, a difficulty occurs pervasively in those studies in that the contribution which an efficient DMU makes to the potential input (output) improvement in inefficient DMUs cannot be measured.
To identify the inputs/outputs that are most important or to distinguish those efficient ITHs which can be treated as benchmarks, the benchmark-share measure (Zhu, 2000) is defined as a ranking measure by combining the factor-specific measure in Eqs. (5) and (6) and the BCC model in Eq. (1). Lewin et al. (1982) and Torgersen et al. (1996) report the application for output-specific efficiency measures which are derived from the radial component and non-zero slacks. Here, for a particular inefficient ITH , the factor-specificd (kth input-specific and qth output-specific) measure comes via the following two linear programming problemsand theexisting BCC model’sbestpracticefrontier.
The kth input-specific DEA model can be written as follows.
* , , , , . . 1, , , , , 1, , , 1, , 0, . k k d d d k j ij d kd j E d j ij id j E j rj rd j E d j j E k d d j Min d N s t x x k m x x i k y y r s j E
(10)
* , , , , . . 1, , , , , 1, , , 1, , 0, . q q d d d q j qj d qd j E d j rj rd j E d j ij id j E d j j E q d d j Max d N s t y y q s y y r q x x i m j E
(11)Here, E and N respectively represent the index sets for the efficient and inefficient ITHs identified by Eq. (1). The factor-specific measures in Eq. (10) and Eq. (11) determine the maximum potential decrease of an input and increase of an output while keeping other inputs and outputs at current levels. These factor-specific measures are still multi-factor performance measures, since all related factors are considered in a single model.
On the basis of Eq. (10), the kth input-specific, benchmark-share measure for each efficient ITH , j E , is
* 1 * 1 * , k d k k j d N j d xkd d N d xkd
(12) where d* j and k* d are optimal values in Eq. (10). On the basis of Eq. (11), the qth output-specific benchmark-share measure for each efficient ITH, j E , is