國
立
交
通
大
學
資訊科學與工程研究所
博
士
論
文
網路導向式計算流行病學:
整合疾病動態與人類社會網路的多層次
傳染病模型架構
Network-based Computational Epidemiology:
A Multilayer Framework Integrating Social Networks with Epidemic Dynamics
研 究 生:蔡宇軒
指導教授:孫春在 教授
網路導向式計算流行病學:
整合疾病動態與人類社會網路的多層次傳染病模型架構
Network-based Computational Epidemiology:
A Multilayer Framework Integrating Social Networks with Epidemic Dynamics
研 究 生:蔡宇軒 Student:Yu-Shiuan Tsai
指導教授:孫春在 Advisor:Chuen-Tsai Sun
國 立 交 通 大 學
資 訊 科 學 與 工 程 研 究 所
博 士 論 文
A Dissertation Submitted toInstitute of Computer Science and Engineering College of Computer Science
National Chiao Tung University in partial Fulfillment of the Requirements
for the Degree of Doctor of Philosophy
in
Computer Science January 2011
Hsinchu, Taiwan, Republic of China
網路導向式計算流行病學:
整合疾病動態與人類社會網路的多層次傳染病模型架構
學生:蔡宇軒
指導教授:孫春在博士
國立交通大學資訊科學與工程研究所博士班
摘
摘
摘
摘
要
要
要
要
網路導向式計算流行病學利用電腦與理論或真實網路拓樸結構研究
人類疾病動態和社會趨勢。本論文的主旨在於探討網路導向式計算流
行病的重要性、研究現況、優勢與建模過程,並詳述三項原創研究。
首先,第一項研究以理論探討無尺度網路下個體資源和疾病傳播成本
對於疾病傳播關鍵門檻值的影響,並於流行病模型的基礎上提出解析
方程式來解釋關鍵門檻值在無尺度網路下的存在性。該研究指出個體
資源和疾病傳播成本的控管對於在無尺度網路下疫情擴散防治的可
行性。其次,第二項研究提出整合真實社會網路、個體觀點、國家觀
點的多層流行病學架構-多層流病動態模擬器(MEDSim),並以該
架構模擬 2009 年 A 型 H1N1 流感疫情在台灣爆發的情形,測試該架
構對於不同爆發地點和傳染阻絕方案的靈活性,希望藉此釐清複雜的
個體接觸行為對於疾病傳播動態的影響。最後,在第三項研究中分析
網路導向式計算流行病學的潛在優勢,並針對網路導向式計算流行病
學初學者給予建立網路導向式流行病模型的方法。該研究的目標在於
協助擁有較低電腦技能者建立流行病學模型、決定合適的模擬參數與
建立操作流程。本論文期望透過上述三項研究,利用電腦模擬來分析
多層次的個體互動行為,進而協助傳染阻絕政策的制定。
Network-based Computational Epidemiology:
A Multilayer Framework Integrating Social Networks with
Epidemic Dynamics
Student:Yu-Shiuan Tsai
Advisor:Dr. Chuen-Tsai Sun
Institute of Computer Science and Engineering
National Chiao Tung University
ABSTRACT
Network-based computational epidemiologists use computers and
either theoretical or actual network topologies to study the transmission
dynamics of human diseases and social trends. In this dissertation I
discuss the importance, current status, advantages, and modeling
procedures of network-based computational epidemiology, specifically
presenting three original studies in detail. The first study is an
investigation of how resources and transmission costs influence diffusion
dynamics and tipping points in scale-free networks. An epidemic model
based on an analytic equation is proposed to explain the existence of
epidemic critical thresholds in scale-free networks. Study results suggest
the possibility of controlling the spread of epidemics in scale-free
networks by manipulating resources and costs associated with an
infection event. In the second study, a proposal for a multilayer
epidemiological framework that integrates realistic social networks,
called the Multilayer Epidemic Dynamics Simulator (MEDSim), is
described from individual and national perspectives. Model flexibility
and generalizability are tested using outbreak locations and intervention
scenarios for the 2009 A/H1N1 influenza epidemic in Taiwan. The results
coincide with the dynamic processes of epidemics under different
intervention scenarios, thus clarifying the effects of complex contact
structures on disease transmission dynamics. In the third study, the
potential benefits of epidemic simulations and instructions for building
network-based epidemic models by novices learning network-based
computational epidemiology approaches is investigated. The goal is to
help individuals with less advanced computing skills build
epidemiological models, determine appropriate simulation parameters,
and construct operational procedures. It is my hope that the studies
presented in this dissertation can assist in efforts by public health
organizations to correctly implement intervention strategies by using
simulations to analyze multilayer interactions.
Acknowledgements
I am greatly thankful to my advisor, Professor Chuen-Tsai Sun,
whose encouragement, suggestions and support from the proposal to the
concluding level enabled me to develop an understanding of the
dissertation. I am deeply indebted to my admirable friends, Dr.
Chung-Yuan Huang and Dr. Tzai-Hung Wen, for their continuous
support and intellectual suggestions. I would like to thank my family, and
my lovely girlfriend, Pin-Han Wang. For their love and encouragement,
I can express only an inadequate acknowledgement of my appreciation. I
dedicate this dissertation to them. I also dedicate this dissertation to my
many friends who have supported me throughout the process.
Contents
Abstract (in Chinese)
i
Abstract (in English)
iii
Acknowledgments
v
Contents
vi
List of Tables
ix
List of Figures
x
Chapter 1. Introduction... 1
1.1.
Computational and Network-based Computational
Epidemiology ... 2
1.2.
Computational Epidemiology History ... 4
1.3.
Current Status of Computational Epidemiology ... 8
1.4.
Trends in Social Network Integration in Computational
Epidemiology ... 11
1.5.
Advantages of Network-based Computational Epidemiology 14
1.6.
Dissertation Overview ... 17
Chapter 2. Preliminaries ... 19
2.1.
Epidemiological Approaches Overview ... 20
2.2.
Compartmental Models ... 23
2.3.
Social Network Models and Network-based Epidemiology ... 27
Chapter 3. Analysis of Epidemiological Transmission in Theoretical
Complex Networks ... 34
Limitations and Transmission Cost Considerations ... 38
3.3.
Epidemic Effect of Limited Resources/Transmission Cost
Ratio ... 43
Chapter 4. Effects of Individual Diversity on Epidemic Modeling in
Realistic Social Networks ... 46
4.1
Motivation... 48
4.2
A Multilayer Epidemiological Model Integrating Human
Commuting Networks ... 51
Layer 1: Within an age group ... 53
Layer 2: Among age groups ... 56
Layer 3: Commuting ... 58
Layer 4: Nationwide interactions ... 62
Technological Framework ... 65
Statistical Analysis for Model Validation ... 67
4.3
Simulating the 2009 Novel H1N1 Influenza ... 69
Parameterization ... 69
Intervention Policy Evaluation ... 72
Chapter 5. Simulation Architecture for Studying Network-based
Computational Epidemiology Issues and for Public Health Education
Purposes ... 85
5.1
Motivation... 87
5.2
Potential Benefits in Learning Through Epidemic Simulations ..
... 90
5.3
Teaching Computational Modeling and Simulation ... 97
Chapter 6. Conclusions... 101
List of Tables
T
ABLE2.1.
T
WOC
OMPLEXN
ETWORKSC
ATEGORIES... 28
T
ABLE4.1.
MEDS
IMP
ARAMETERS... 64
T
ABLE4.2.
MEDS
IM PARAMETERS USED FOR FITTING SIMULATION CURVESWITH ACTUAL SEASONAL INFLUENZA
A
CURVES INT
AIWAN BETWEENS
EPTEMBER2008
ANDA
PRIL2009 ... 71
T
ABLE4.3.
MEDS
IM PARAMETERS USED FOR FITTING SIMULATION CURVESTO ACTUAL SWINE
-
ORIGIN INFLUENZAA
(H1N1)
CURVES INT
AIWANFROM WEEK
25
TO WEEK52 ... 71
T
ABLE4.4
O
BSERVATION INDEX VALUES ACCORDING TO DIFFERENTTRANSMISSION RATES
. ... 78
T
ABLE4.5.
O
BSERVATION INDEX VALUES ACCORDING TO DIFFERENT POLICYACTIVATION SCENARIOS DURING SWINE
-
ORIGIN INFLUENZAA
(H1N1)
OUTBREAK IN
T
AIPEI. ... 81
T
ABLE4.6.
O
BSERVATION INDEX VALUES ACCORDING TO DIFFERENT POLICYACTIVATION SCENARIOS DURING SWINE
-
ORIGIN INFLUENZAA
(H1N1)
List of Figures
F
IGURE2.1.
F
LOWCHART OF THESIR
EPIDEMIOLOGIC MODEL. ... 23
F
IGURE2.2.
T
HE COMPARTMENT STATES,
S,
I,
ANDR,
AS A FUNCTION OF T. 24
F
IGURE2.3.
P
HASE TRANSITION DIAGRAM FOR EPIDEMIC SIMULATIONS INHOMOGENEOUS NETWORKS
. ... 26
F
IGURE2.4.
T
HREE TYPES OF COMPLEX NETWORKS. ... 27
F
IGURE2.5.
(
A)
O
NE-
DIMENSIONAL ORDERED NETWORK WITH EACH NODECONNECTED TO FOUR ADJACENT NODES
.
(
B)
W
ATTS ANDS
TROGATZ’
S(D
UNCANJ.
W
ATTS&
S
TROGATZ,
1998)
SMALL WORLD NETWORK WITHFOUR REWIRED SHORTCUTS
.
(
C)
N
EWMAN ANDW
ATTS’
(M.
E.
J.
N
EWMAN&
D.
J.
W
ATTS,
1999)
IMPROVED SMALL WORLD NETWORKWITH FIVE ADDITIONAL SHORTCUTS
.
(
D)
E
XAMPLE OF A BROKENNETWORK IN
W
ATTS ANDS
TROGATZ’
S(D
UNCANJ.
W
ATTS&
S
TROGATZ,
1998)
SMALL WORLD NETWORK. ... 29
F
IGURE2.6.
C
OMPARISON OF NODE DEGREE DISTRIBUTIONS AND NETWORKSTRUCTURES BETWEEN
D
AVIDSEN ET AL.’
S TWO-
RULE MODEL(
A AND B)
AND OUR PROPOSED THREE
-
RULE MODEL(
C AND D). ... 31
F
IGURE3.1.
C
RITICALT
HRESHOLDλ
c IS A FUNCTION OF THE RATIO OFTRANSMISSION COSTS TO INDIVIDUAL RESOURCES
(
c R
/
)
IN SCALE-
FREENETWORKS
.
W
E USED IT TO ANALYZE RESULTS FROM OUR SIMULATIONEXPERIMENTS AND THREE MATHEMATICAL ANALYSES
. ... 41
F
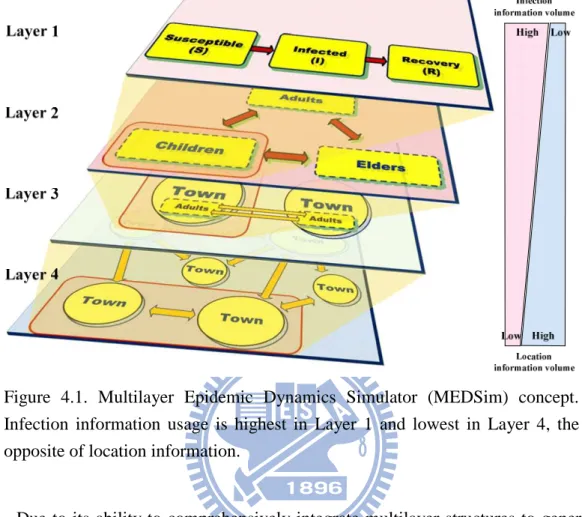
IGURE4.1.
M
ULTILAYERE
PIDEMICD
YNAMICSS
IMULATOR(MEDS
IM)
F
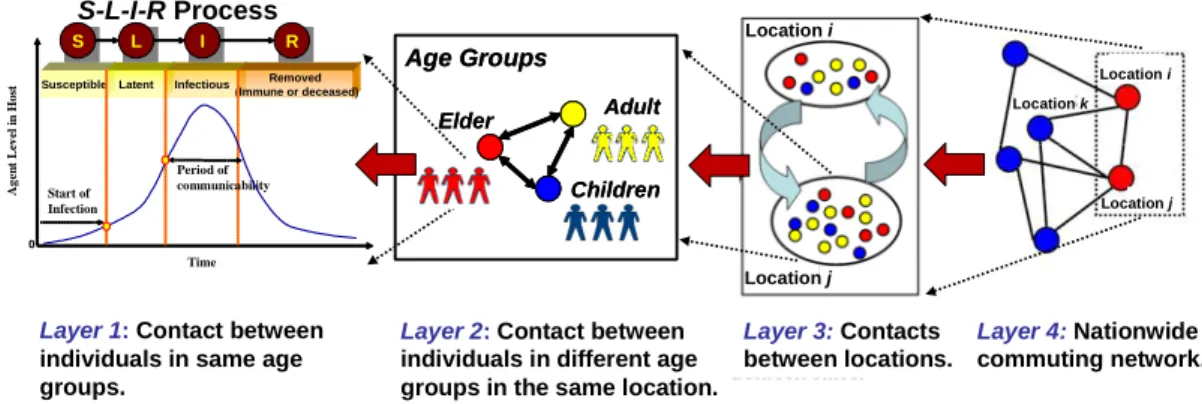
IGURE4.2.
MEDS
IM FRAMEWORK. ... 53
F
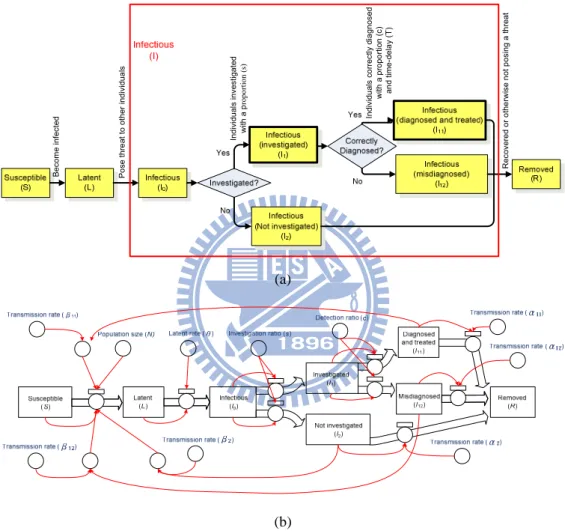
IGURE4.3.
(
A)
M
ODIFIEDSLIR
MODEL LAYER1
CONCEPT.
(
B)
M
ODIFIEDSLIR
MODEL LAYER1
FLOWCHART. ... 55
F
IGURE4.4.
MEDS
IM LAYER2
ARCHITECTURE FLOWCHART.
T
HICK SOLID LINES INDICATE PARAMETERS FOR OTHER(
NON-
P AND NON-
Q)
AGE GROUPS.
T
HICK DASHED CURVES INDICATE RELATIVE PERCENTAGES OF EACH AGE GROUP WITHIN THE TOTAL POPULATION OF EACH LOCATION. 58
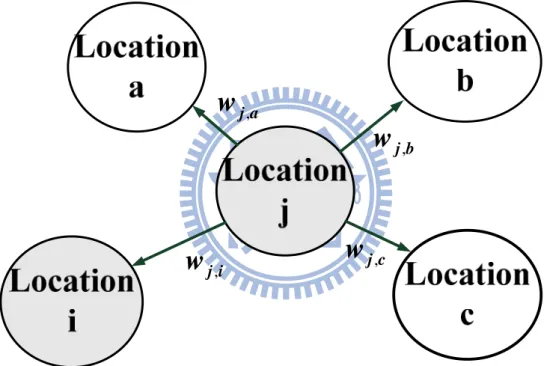
F
IGURE4.5.
P
OTENTIAL MOVEMENT OF INFECTIVITY BETWEEN LOCATIONSi
ANDj
. ... 60
F
IGURE4.6.
MEDS
IM LAYER3
ARCHITECTURE FLOWCHART.
P
ROPERTIES ASSOCIATED WITH COMMUTING BETWEEN TWO LOCATIONS ARE INDICATED BY THICK SOLID LINES.
A
DDITIONAL LOCATION PROPERTIES ARE INDICATED BY THICK DASHED LINES. ... 61
F
IGURE4.7.
T
AIWAN’
S NATIONWIDE COMMUTING NETWORK. ... 63
F
IGURE4.8.
MEDS
IM SIMULATION TOOL FRAMEWORK. ... 66
F
IGURE4.9.
MEDS
IM IMPLEMENTATIONGUI. ... 67
F
IGURE4.10.
C
OMPARISON OF WEEKLY NEW INFECTED CASES BETWEEN ACTUAL AND SIMULATED RESULTS NORMALIZED FOR(
A)
SEASONAL INFLUENZAA
AND(
B)
SWINE-
ORIGINH1N1
INFLUENZAA. ... 72
F
IGURE4.11.
N
EW INFECTED CASES PER WEEK AT DIFFERENT TRANSMISSION RATES. ... 74
F
IGURE4.12.
C
UMULATIVE NEW INFECTED CASES AT DIFFERENT TRANSMISSION RATES. ... 74
F
IGURE4.13.
B
ASIC EPIDEMIC CURVE ATA
0%
REDUCED TRANSMISSION RATE EXPRESSED ACCORDING TO TWO OBSERVATION INDEXES. ... 75
F
IGURE4.14.
C
OMPARISON OF NEW INFECTED CASES AT EPIDEMIC CURVEPEAK AT DIFFERENT TRANSMISSION RATES
. ... 75
F
IGURE4.15.
W
EEKLY NEW CASES AT CURVE PEAK AT DIFFERENTTRANSMISSION RATES
. ... 76
F
IGURE4.16.
N
EW INFECTED CASES AT EPIDEMIC CURVE PEAK ACCORDINGTO VARIOUS INTERVENTION POLICY SCENARIOS
. ... 76
F
IGURE4.17.
N
UMBERS OF INFECTED CASES ACCORDING TO VARIOUSINTERVENTION POLICY SCENARIOS
. ... 77
F
IGURE4.18.
W
EEK NUMBERS OF EPIDEMIC CURVE PEAKS ACCORDING TOVARIOUS INTERVENTION POLICY SCENARIOS
. ... 77
F
IGURE4.19.
E
PIDEMIC PEAK WEEK NUMBERS FOR URBAN AND RURALChapter 1.
Introduction
Network-based computational epidemiologists use computers and either
theoretical or realistic network topologies to study the reasons, conditions, and
transmission dynamics of human diseases and social trends. In this chapter I will
summarize several network-based computational epidemiological issues, and
introduce some of the details of both computational and network-based computational
epidemiology. After reviewing the history, current status, and importance of the
1.1.
Computational and Network-based
Computational Epidemiology
Epidemiologists study the distribution of individuals who are healthy or infected
during a contagious disease outbreak, as well as conditions and factors supporting the
spread of a disease (Lloyd & May, 2001). The two most common research approaches
are observation and experimentation. In the first, epidemic diseases are analyzed
using empirical data collected from clinical cases, epidemic monitoring surveys, and
other investigation tools to determine contagious patterns or disease properties. In the
second, subjects are randomly divided into two groups, members of one group are
treated with the experimental variable, and a comparison of the two groups
determines the positive, negative, or null effects of the variable.
Computational epidemiologists construct mathematical models and use
computing techniques to obtain epidemic results. Researchers validate results by
comparing them with observable empirical data, or use their results to explain
experimental variable characteristics. The most commonly used mathematical tool for
computational epidemiology studies is differential equations, in which individuals in a
population are divided into finite states representing different health statuses.
symbols. A major advantage of a differential equation system is that the number of
each state can be easily computed; a disadvantage is that they are weak in terms of
describing social properties such as social distance.
To compensate for the lack of social properties, epidemiologists are
incorporating social networks into their mathematical models, reflecting the idea that
there is no distance between individuals with the same health status—that is, there are
no restrictions on any two individuals being in contact with each other. Social network
structures consist of nodes (objects) and links (social relations). For example, in a
friendship network, nodes represent individuals and links represent whether or not
two nodes are friends. Due to its ability to represent social relations, network-based
computational epidemiology has grown in popularity. However, since individual
characteristics and their corresponding integrated mathematical models are so
complex, powerful computers are required to solve equation systems. As the size and
detail of a social network increases, so does the need for increased computation time
1.2.
Computational Epidemiology History
The first approaches used in computational epidemiology were based on
differential equation systems. One of the first contagious epidemiology models,
proposed by Kermack and McKendrick (1927), is known as the compartmental SIR
model. In this model, all individuals in a population are classified as Susceptible
(vulnerable to infection but not yet infected), Infected (and capable of infecting others),
or Removed (recovered, dead, or otherwise not posing any further threat). Differential
equations mark the progress of each state. In the past 80 years, numerous
compartmental models have been created and improved for research purposes (for
examples, see Bailey, 1950; Bartlett, 1956; Diekmann, Heesterbeek & Metz, 1990;
Hyman & Stanley, 1988; Rollett, 1945). Major progress was made in the 1990s, with
the addition of other states and model revisions to emphasize cyclic characteristics
(Ahmed & Agiza, 1998; Anderson & May, 1991; Wang, 2006).
Describing epidemic dynamics using compartmental models based on
differential equation systems is an easy method for representing the time dimension,
but such approaches lack a spatial dimension. Individuals in the same compartment
are modeled as one group, implying that any two group members are directly
differences among individuals. To overcome this flaw, Von Neumann (1966)
introduced his cellular automata model (which considers spatial differences and the
movement of individuals) to epidemic propagation research (Fuentes & Kuperman,
1999; Sirakoulis, Karafyllidis & Thanailakis, 2000). Other researchers focused on
integrating compartmental and cellular automata models to support epidemiological
models (Liu & Jin, 2005; Mikler, Venkatachalam & Abbas, 2005; White, del Rey &
Sánchez, 2007).
In addition to using the cellular automata model to consider spatial effects, social
network models are increasingly being used by mathematical epidemiologists. Watts
and Strogatz (1998) have proposed the concept of a “small-world” phenomenon to
explain why any two individuals in the world can be contacted via a small number of
connecting individuals. Barabasi and Albert (1999) then proposed a “scale-free
network” algorithm to explain the phenomenon of “the rich becoming richer.” Unlike
theoretical random networks (Erdos & Renyi, 1960), social networks are much closer
to the real world situation, and hence can be used to depict individual contacts in
network-based epidemic model studies (Dezső & Barabási, 2002; Grais, Hugh Ellis &
Glass, 2003; Meyers, Newman, Martin & Schrag, 2003; Newman, 2002; Pourbohloul
et al., 2005; Parham & Ferguson, 2006; Handcock & Jones, 2006). Other researchers
(Barthelemy, Barrat, Pastor-Satorras & Vespignani, 2004, 2005; Draief, 2006;
Pastor-Satorras & Vespignani, 2001b; Shirley & Rushton, 2005; Silva, Ferreira &
Martins, 2007; Wang, 2002; Yang et al., 2007; Zhou, Yan & Wang, 2005;).
Agent-based differential equation system approaches emphasize heterogeneity
and interactions among individuals. In these approaches, individuals are represented
as agents whose interactions can be modeled in the form of rules (Boguñá &
Pastor-Satorras, 2002; Huang, Sun, Hsieh & Lin, 2004). The advantage of such an
approach is that it supports simulations of the movement of individuals, which in turn
supports an understanding of epidemic contagion routes. Using this kind of approach,
Barrett et al. (2005) constructed a society of 1.6 million agents to simulate the daily
behaviors of individuals in Portland, Oregon, and Epstein (2009) studied the 2009
influenza A (H1N1) epidemic by constructing a model containing 6.5 billion agents to
simulate international human contact and daily movement. Unlike compartmental
models that focus on the behaviors of whole populations, agent-based models focus
on individual behaviors.
A geometric structure has recently been integrated into epidemic models. Due to
the limitations of standard cellular automata, in this study geographical cellular
automata are used to simulate an environment (Liu, Xia, Yeh, Qiang & Jia, 2007; Zhou,
dynamics in social and geometric transformations (Flache & Hegselmann, 2001;
Menard, 2008). Other kinds of cellular automata have been tied to epidemic
contagious behaviors via network-based compartmental models (Zhong, Huang &
Song, 2009). To visualize the dynamics of a regional epidemic, at least two research
teams have integrated a geometric information system (GIS) into a mathematical
1.3.
Current Status of Computational
Epidemiology
Epidemiologists are currently emphasizing temporal and spatial depictions of
infectious disease occurrences and pathogenic mechanisms. Regarding the temporal
aspect, researchers have focused on understanding spreading trends and dynamic
changes in infectious diseases. The most common approach is to construct analytically
systematic epidemiological models with differential equations, and then derive stable
solutions (Feng, Huang & Castillo-Chavez, 2005; Inaba, 2007; Langlais & Naulin,
2003; Li & Jin, 2005; Shim, Feng, Martcheva & Castillo-Chavez, 2006; Supriatna,
Soewono & Van Gils, 2008; Wang & Zhao, 2005). Populations can be broken down
into infection stages such as Susceptible, Latent, Infectious and Recovered, and changes
in subpopulations over time can be modeled using system dynamic differential
equations (Feng et al., 2005; Inaba, 2007; Langlais & Naulin, 2003; Li & Jin, 2005;
Shim et al., 2006; Supriatna et al., 2008; Wang & Zhao, 2005). Using suitable
parameter values (e.g., transmission rate, recovery rate), infectious dynamics and
transmission thresholds that become endemic above and vanish below those values can
be derived to acquire analytic solutions from equations (Huang, Tsai & Sun, 2009;
Tsai, Sun & Huang, 2008). According to the different transmission capabilities of
epidemic diseases, basic reproduction numbers can be derived to estimate how many
individuals will be infected from the first infected individual (Hethcote, 2000; Keeling
& Grenfell, 2000).
Regarding the spatial aspect, researchers have focused on understanding the
distribution of infected individuals (which can be determined from medical case reports)
to help in monitoring and immunization efforts. Because of the advantages of computer
technology, GIS data on absolute distance and the properties of geographical regions
are now commonly applied in research (Rae, 2009; Wylie, Shah & Jolly, 2007). Many
researchers are also integrating GIS into epidemic disease monitoring and prevention
efforts (Edwards & Clarke, 2009; Jeger, Pautasso, Holdenrieder & Shaw, 2007; Mao &
Bian, 2010; Thakur & Sharma, 2009). By analyzing medical cases and collecting data
on environmental factors, geographic spatial distribution information can be
determined, and epidemic pathogenic mechanisms can be analyzed. For example, using
spatial clustering analysis, it is possible to analyze abnormal clusters that exceed an
expected number of infected cases, thus supporting efforts to understand the extent of
disease clustering relative to increases in disease vectors (Kan et al., 2008). Kan et al.
have used this approach to explain the smaller number of cases of dengue hemorrhagic
take advantage of both temporal and spatial aspects when analyzing infectious disease
propagation, therefore many researchers are trying to integrate both temporal and
spatial factors into their epidemiological models (Barrett, Eubank & Marathe, 2006;
1.4.
Trends in Social Network Integration in
Computational Epidemiology
The past decade has witnessed significant advancements in social network
research, ever since Watts and Strogatz (1998) first described small-world networks
characterized by highly clustered connections and short paths between node pairs.
Their work represents a fundamental change in our knowledge of human relationships,
which has influenced research avenues in a wide range of disciplines such as
epidemiology. (Diosan & Dumitrescu, 2007; Montoya & Solé, 2002; Vázquez,
Flammini, Maritan & Vespignani, 2003).
Complex networks can be used to model real-world complexity. A complex
network is a structure containing numerous nodes and edges. Nodes can represent
objects such as individuals, locations, organisms, or World Wide Web pages.
Depending on node type, edges can represent relationships such as human friendships,
food chains for non-human organisms, or links between web pages. Several network
indexes have been developed to measure relationships (Boccaletti, Latora, Moreno,
Chavez & Hwang, 2006). For example, degree of clustering has been used to determine
why our friend’s friend is often also our friend, degree of separation has been used to
has been used to explain the existence of super nodes(Huang, Tsai & Sun, 2010). Such
topological characteristics have also been used as epidemiological indexes to measure
the spreading speed of an epidemic disease (Edmunds, O'Callaghan & Nokes, 1997;
Estrada & Hatano, 2008; Hwang, Kim, Ramanathan & Zhang, 2008).
Infectious diseases spread through individual contact, and many epidemiologists
are using social networks to model individual contact behavior. Social networks, one
type of complex network that is also considered a social structure model, emphasize
individual heterogeneity, individual interaction, and network topological structure
(Boguñá & Pastor-Satorras, 2002; Huang et al., 2004). They are often used to model
populations, with nodes representing individuals and links representing contacts. Social
network topological structures have been used in many epidemic studies over the past
decade. Based on human epidemic disease or computer virus features, different social
network structures have been proposed to analyze epidemic spreading dynamics and
transmission rate thresholds (see, for example, Huang, Sun, Hsieh, Chen & Lin, 2005;
Langlais & Naulin, 2003; May & Lloyd, 2001; Pastor-Satorras & Vespignani, 2001b).
In addition, traffic networks such as daily commuting routes have been used to analyze
the spread of diseases via human transportation networks (Barrett et al., 2005, 2006).
Social network studies comparing the efficiencies of various public health policies have
and Vespignani (2001b, 2002).
New epidemiological models integrate spatial and social network factors. The
most commonly used approach adds various network topologies (e.g., small-world
network, scale-free network) to determine different epidemic spatial distributions
(Huang et al., 2004; Pastor-Satorras & Vespignani, 2001b, 2002). After building social
network models, parameters such as initial infected agent, and epidemic attributes such
as transmission and recovery rates, are manipulated to calculate disease propagation
within the defined network (Huang et al., 2004; Wang & Ruan, 2004). According to
epidemic properties, different simulation scenarios (e.g., network topologies, contact
patterns, agent attributes such as age or gender) can be studied using simulations in
order to develop effective public health policies. For example, HIV research entails
looking at how heterosexual sexual contact, homosexual sexual contact, or illegal drug
use affects virus transmission and propagation in a social network (Morris, 1997;
1.5.
Advantages of Network-based
Computational Epidemiology
Understanding the spreading dynamics of infectious diseases and the spatial
distribution of infected individuals is the primary concern of agencies involved in
infectious disease control and prevention (Hethcote, 2000; Moore & Newman, 2000;
Pastor-Satorras & Vespignani, 2002). Efforts to understand social network
associations among geographical characteristics such as coordinates, population size,
and census data represent a current trend in computation epidemiology. The
advantages of understanding these associations are as follows:
1. Epidemic disease properties such as the transmission capability of a virus and
recovery days among individuals are connected to geographical location (Barrett et al.,
2005; Larsen, Axhausen & Urry, 2006). For example, the transmission capability of
influenza in urban areas is greater than in rural areas because of population density
differences, therefore when setting epidemic parameters, transmission rate should be
higher in urban areas. Network integration into compartmental models can be used to
represent individual heterogeneity. Associating social networks with geographical
characteristics has the advantage of accurately describing the topology of individual
2. Public transportation systems such as aircraft, subways, commuter trains, and
buses support the spreading of a virus (Colizza, Barrat, Barthélemy & Vespignani,
2006; Grais et al., 2003; Kaza, Xu, Marshall & Chen, 2009). Modern public
transportation systems make it easy to move between distant locations, and pathogens
can be carried long distance within a matter of hours or days. In 2009, the
swine-origin H1N1 virus emerged in Mexico and rapidly spread throughout South
America, Europe, and Asia within a few weeks; by mid-November of that year, 6,770
deaths were reported in 206 geographic locations (Smith et al., 2009). This
underscores the importance of considering such factors as the location of public
transportation systems in epidemiological studies.
3. During a contagious disease outbreak, medical officials and/or public health
experts must consider balances among many factors when determining how to best
use medical resources and enact prevention policies (Riley et al., 2003; Molinari et al.,
2007). In addition, differences in resources and population densities among
administrative and geographical divisions must be considered (Sypsa, Pavlopoulou &
Hatzakis, 2009; Wylie et al., 2007). From the perspective of medical system utility, a
suitable mix of intervention policies is required to efficiently control a disease
outbreak according to limitations of medical resources (Tsai & Huang, 2010; Huang
division must be considered when planning the timing of interventions across
administrative divisions.
4. GIS is a suitable tool for graphically representing epidemics. By using
visualization tools, large bodies of complex data can be analyzed spatially. Based on
experience with newly emerging viruses such as SARS, avian influenza (H5N1), and
swine-adapted influenza (H1N1), public health officials must deal with the potential
of one such virus becoming pandemic (Fraser et al., 2009; Kuiken, Rimmelzwaan, Van
Amerongen & Osterhaus, 2003; Tomlinson & Cockram, 2003). However, traditional
epidemic models cannot adequately work with geographic information due to
limitations associated with equation size, therefore geographic network-based
computation epidemiology with GIS has value in terms of studying virus spreading
1.6.
Dissertation Overview
The rest of this dissertation is organized as follows: in Chapter 2 I will present a
brief overview of a preliminary study involving network-based computational
epidemiology, especially a network topology proposal from an original study
conducted by Huang, Tsai and Sun (2010).
In Chapter 3 I will present details from an original research project conducted by
Huang et al. (2010), Tsai & Huang (2010), and Tsai, Sun & Huang (2010) that used
network-based computational epidemiology with a theoretically complex network
topology. Based on considerations of resource limitations and transmission costs, I
will propose an epidemic model that uses analytic equations to identify critical
epidemic thresholds in scale-free networks.
In Chapter 4 I will discuss the details of an original research project by Tsai et al.
(2010) to integrate realistic social networks with standard epidemiological models,
and then describe a multilayer epidemiological framework—Multilayer Epidemic
Dynamics Simulator, or MEDSim—from national and individual perspectives. The
framework was used to compute outbreak locations and intervention scenarios for the
2009 A/H1N1 influenza epidemic as a means of testing model flexibility and
In Chapter 5 I will present details of an original research project on the potential
benefits of epidemic simulations, and describe the building of a network-based
epidemic model for epidemiology students with little computing experience who are
interested in studying computational epidemiology and public health education (Hsieh,
Huang, Sun & Tsai, 2009; Huang, Tsai & Wen, 2010a, 2010b). In Chapter 6 I will
Chapter 2.
Preliminaries
In this chapter, I will first introduce the most commonly used epidemiological
models for network-based computational epidemiological studies, and then briefly
2.1.
Epidemiological Approaches Overview
The two most commonly used approaches to modeling epidemic spreading
dynamics are population-based and network-oriented. In population-based approaches,
hosts that share the same symptoms are modeled or grouped in terms of a limited
numbers of classes (also known as compartments); the main task of researchers is to
study and compare their various dynamics (Feng et al., 2005; Inaba, 2007; Langlais &
Naulin, 2003; Shim et al., 2006; Supriatna et al., 2008; Wang & Zhao, 2005).
Combinations of classes are used to model and analyze population dynamics. For
example, the SLIR model puts individuals into one of four infection
statuses—Susceptible, Latent, Infectious, or Recovered (Li & Jin, 2005)—and
differential equations are used to determine transitions between epidemiological phases.
Depending on whether removed individuals can become susceptible a second time,
diseases can be modeled as SLIR or SLIRS cycles.
Population-based and network-oriented approaches respectively emphasize
large-scale population-level and individual-level perspectives. Population-based
approaches are suitable for discussing dynamic variation across individuals in the same
compartment, but they are weak in terms of modeling individual heterogeneity and
individuals are modeled as groups, any two members of the same group are assumed as
having a direct connection, which is not true in the real world. Furthermore, individual
movement and activity are location-dependent, therefore phenomena cannot be
simulated by a population-based approach that assumes a homogeneous population
distribution. In contrast, network-oriented approaches may be appropriate for
introducing individual heterogeneity, but they are computation-intensive and
time-consuming when simulating the behaviors of individuals with multiple attributes
in large-scale social environments (Barrett et al., 2005; Epstein, 2009). Many efforts
have been made to match individual and population behaviors with heterogeneity and
computation requirements when studying epidemic dynamics (Davis et al., 2003; Levin
& Durrett, 1996; Sawyer, 2003).
In contrast, network-oriented approaches emphasize individual heterogeneity,
interactions among individuals, and network structure (Boguñá & Pastor-Satorras,
2002; Huang et al., 2004). Individuals in a network are represented as nodes, and
interactions between them as links. Network nodes can be used to represent the
characteristics of individuals, locations, neighborhoods, or cities, and models can
incorporate the temporal dynamics of these features. Time frames for links between two
nodes can be preferentially defined (Ortiz-Pelaez, Pfeiffer, Soares-Magalhães &
individuals exhibiting interaction or relationship patterns (Barabási & Albert, 1999;
Erdos & Renyi, 1960; Newman, 2003; Watts & Strogatz, 1998). Network-oriented
approaches are suitable for capturing complex contact patterns among individuals,
exploring epidemic dynamics, and assessing the efficacies of public health policies
(Pastor-Satorras & Vespignani, 2001b, 2002; Huang et al., 2004, 2005). Lattice
networks have been used to determine distance relationships between individuals. In
contrast, random networks support features associated with casual contacts among
mobile individuals and the low degree of separation commonly observed in social
networks (Barrett et al., 2005). These approaches are viewed as reliable for
investigating epidemics, with the transmission dynamics of specific network models
being manipulated to investigate the spread of emerging infectious diseases (Liu, Lai &
Ye, 2003; May & Lloyd, 2001). The topological features of social networks have
recently been found to exert considerable influence on the transmission dynamics and
critical thresholds of infectious diseases, thus supporting subtle analyses that
network-oriented models are incapable of (Draief, Ganesh & Massoulié, 2008; Huang
2.2.
Compartmental Models
In standard epidemiological models, all individuals (nodes) in a population
(complex network) can be roughly classified into a limited number of states, including
Susceptible, Infected and Removed, as defined in Chapter 1. Epidemiologists use
combinations of these states to represent orders of transition between different
epidemiological phases, giving names such as “SIR” and “SIS” to their models. The
most commonly used model is the SIR (Susceptible→Infected→Recovery) (Figure 2.1),
which can be formulated using ordinary differential equations as follows:
-dS SI dt = β -dI SI I dt = β α dR I dt = α
β, a constant transmission rate, represents the speed at which Susceptible individuals become infected, and α is a constant recovery rate used to determine transformation speed from Infected to Recovered.
0% 10% 20% 30% 40% 50% 60% 70% 80% 90% 100% N um b e r ( % ) Time Susceptible Infected Recovery
Figure 2.2. The compartment states, S, I, and R, as a function of t.
When simulating epidemic dynamics in complex networks, epidemiologists
usually assume that nodes run stochastically through an SIS cycle, which does not take
into account the possibility of an individual’s removal due to death or acquired
immunization. The SIS model has been widely adopted to study contagious diseases
leading to endemic states with a stationary average density of infected individuals. It is
worth noting that for many contagious diseases, analyses derived from the SIS model
can be readily extended to the SIR and SIRS models (Pastor-Satorras & Vespignani,
2002). During each time step, each susceptible node is subject to a ν probability contagion rate if it is connected to one or more infected nodes. Infected nodes recover at
λ
is defined as λ ν δ= . Recovery rate δ can be assigned a value of 1, since it only affects the definition of the time scale of contagious disease propagation(Pastor-Satorras & Vespignani, 2003). Pastor-Satorras and Vespignani (2002) define
( )
ρ t as the density of infected nodes at time step t. When time step t becomes
infinitely large, ρ can be represented as a steady-state density of infected nodes. Using these definitions, they applied mean-field theory to a SIS epidemiological model,
and used Anderson and May’s (1991) homogeneous mixing hypothesis according to the
topological features of homogeneous networks to obtain (a) a steady-state density ρ
of infected nodes during long time periods (Eq. 2.1), and (b) the critical threshold λc
(Eq. 2.2): 0 λ λ ρ λ λ λ λ λ < = − ≥ c c c (2.1) 1 λ = < > c k (2.2)
where k =
∑
kkp is the average vertex degree of the network, and k p the fraction kof nodes that have vertex degree k in the network. According to Eqs. 2.1 and 2.2, a
positive and nonzero critical threshold λc exists in a homogeneous network based on
the SIS epidemiological model. The contagion spreads and becomes epidemic if the
effective spreading rate exceeds the critical threshold (λ ≥λc); otherwise, the contagion
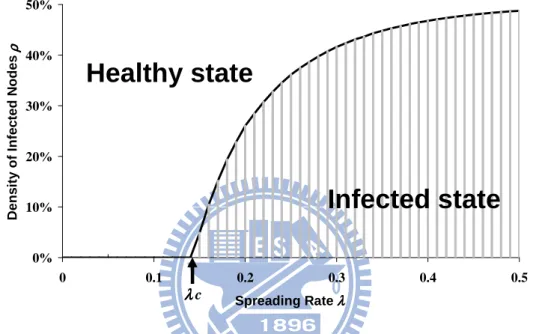
dies out. As shown in Figure 2.3, the SIS epidemiological model separates an infected
an SIS epidemiological model in a homogeneous network is the presence of a positive
critical threshold, proportional to the inverse of the average number of neighbors of
each node, below which epidemics die and endemic states are impossible.
0% 10% 20% 30% 40% 50% 0 0.1 0.2 0.3 0.4 0.5 Spreading Rate λ λ λ λ D e n s it y o f In fe c te d N o d e sρρρρ
Healthy state
Infected state
λλλλc2.3.
Social Network Models and
Network-based Epidemiology
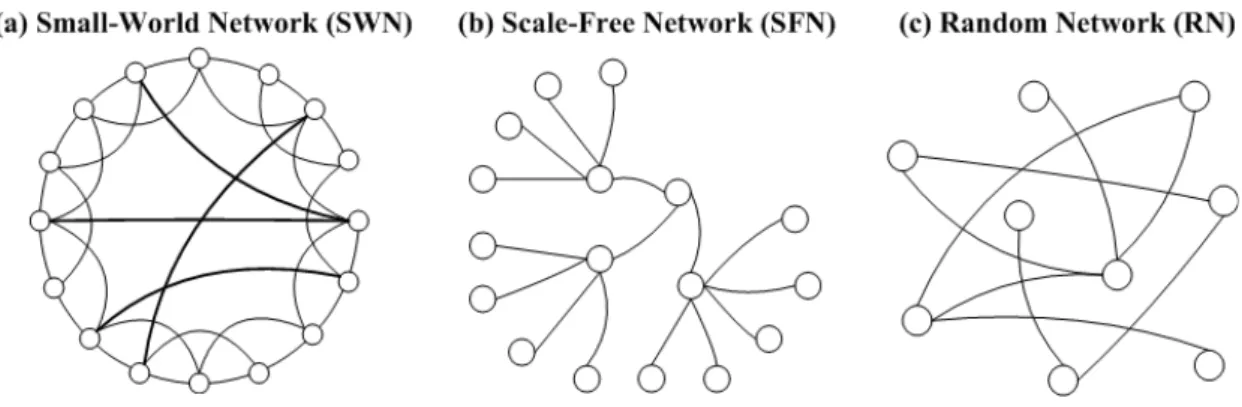
Complex networks are commonly used to represent structures for groups of
individuals who exhibit interaction or relationship patterns (Barabási & Albert, 1999;
Erdos & Renyi, 1960; Newman, 2003; Watts, 2003; Watts & Strogatz, 1998). As
shown in Figure 2.4 and Table 2.1, complex networks can be categorized as small
world, scale-free, or random according to basic statistical properties such as local
clustering, the small world phenomenon, or power-law connectivity distribution. They
are popular among researchers who construct computational simulations of virtual
societies, contagious diseases, Internet viruses, and the spread of cultural beliefs and
influences—all of which are affected by transmission routes.
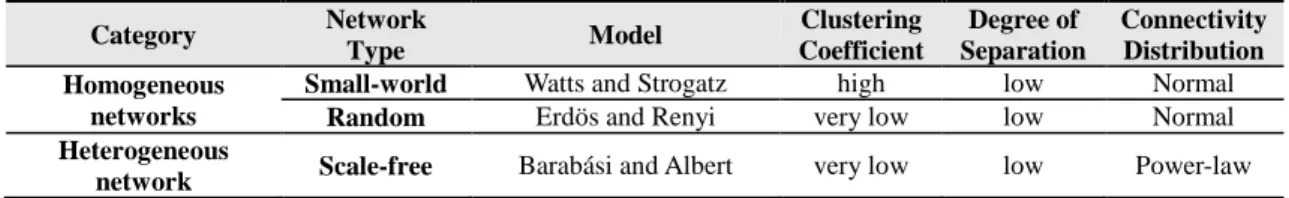
Table 2.1. Two Complex Networks Categories Category Network Type Model Clustering Coefficient Degree of Separation Connectivity Distribution Homogeneous networks
Small-world Watts and Strogatz high low Normal
Random Erdös and Renyi very low low Normal
Heterogeneous
network Scale-free Barabási and Albert very low low Power-law
Generating a Watts and Strogatz (1998) small-world network begins with an
n-dimension ordered network with periodic boundary conditions, in which each node is
connected to a z quantity of neighbors, usually z≥2n (Figure 2.5a) (Watts &
Strogatz, 1998; Newman, 2003). Each link is randomly rewired to a new node with
probability p (Figure 2.5b). Under adverse circumstances, this construction method
can break the original ordered network into several isolated subgraphs (Figure 2.5d).
Newman and Watts (1999) introduced a variation of the original construction method
that emphasizes the insertion of long-range shortcuts instead of rewiring links. In their
version, two previously unconnected nodes are randomly selected and connected via a
newly added link, with users determining the number of links to be added (Figure 2.5c).
Newman and Watts’ small-world network thus avoids the problem of network breakage,
while preserving the positive characteristic of connecting each node in an
n-dimensional ordered network with 2n neighboring nodes. Since both the original
and new versions (Newman, 2003) exhibit small world and local clustering properties,
Figure 2.5. (a) One-dimensional ordered network with each node connected to
four adjacent nodes. (b) Watts and Strogatz’s (Duncan J. Watts & Strogatz, 1998)
small world network with four rewired shortcuts. (c) Newman and Watts’ (M. E.
J. Newman & D. J. Watts, 1999) improved small world network with five
additional shortcuts. (d) Example of a broken network in Watts and Strogatz’s
(Duncan J. Watts & Strogatz, 1998) small world network.
Generating a Barabási and Albert (1999) scale-free network begins with a small
number of nodes designated as z0 (Newman, 2003). During each iteration, a new node
is introduced and connected to z≤z0 pre-existing nodes according to a probability
based on each node’s vertex degree. New nodes are preferentially attached to existing
nodes that have large numbers of connections. This type of network exhibits
small-world and power-law connectivity distribution properties, implying the existence
of a small number of nodes with very large vertex degrees—similar to World Wide Web
hyperlinks and human sexual contact webs.
Erdös and Renyi’s (1960; Newman, 2003) random networks are generated by
are capable of exhibiting small-world properties if sufficient numbers of links are added,
but with little or no local clustering—an unusual situation in the real world.
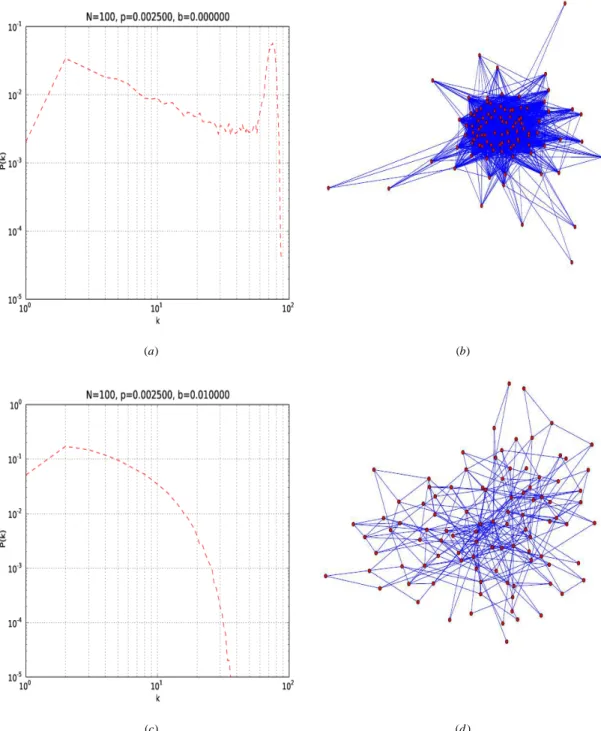
Huang, Tsai and Sun (2010) used three rules to generate friend-making
networks—friend making, joining and leaving, and friendship updates—until each
network reached a statistically stationary state. Taking a bottom-up, network-oriented
simulation approach to modeling reflects the evolutionary mechanism of real-world
social networks. They built on insights from previous studies (e.g., Davidsen, Ebel &
Bornholdt, 2002) to apply local and interactive rules to acquaintance network
evolution. Findings from this approach can be used to explore human activity in
specific social networks—for example, rumor propagation and disease outbreaks
( )a ( )b
( )c ( )d
Figure 2.6. Comparison of node degree distributions and network
structures between Davidsen et al.’s two-rule model (a and b) and our proposed
three-rule model (c and d).
Communities, cities, and countries—even the entire planet—can be defined in
represents one individual with status-determining attributes (often referred to as
node-related local information) such as epidemiological progress, contagiousness, and
immunization (Huang et al., 2005; Xu et al., 2007). Connections between individuals
are referred to as links, with different links representing different interpersonal
relationships (Pastor-Satorras & Vespignani, 2001b). In HIV/AIDS epidemic
simulations they represent sexual relationships, and in SARS epidemic simulations
they represent close physical proximity (Huang et al., 2004, 2005). The states of all
network nodes change simultaneously during each time step. The state of an individual
node is determined by its original state, its linked neighbor’s state, and a set of
interaction rules.
Past epidemiological research has focused on the transmission dynamics and
spreading situations of biologically contagious diseases. A growing number of research
efforts are focusing on non-biological and intangible concepts such as computer viruses,
cultural influences, rumors, ideas, and beliefs that exist in social networks and on the
Internet. In these kinds of spreading scenarios, cultural influences move ideas and
beliefs between transmitters and receivers, eventually making the majority of receivers
behave in the same manner as transmitters (Huang et al., 2005; Lynch, 1996; Rogers,
2003). Researchers have recently looked at epidemic dynamics and critical thresholds
Chapter 3.
Analysis of Epidemiological
Transmission in Theoretical Complex
Networks
Avian influenza, a flu that originally spread only among birds but is now found
among birds and humans, is a likely candidate to become an epidemic or pandemic
disease. Another epidemic, the 1918 influenza outbreak in North America, is one of the
most studied by epidemiologists. Nine decades later, Watts (1998) described his
proposed small-world property in complex networks, which has strongly influenced
research involving human networks. Later, Pastor-Satorras and Vespignani (2001a)
combined epidemic dynamics and complex networks to propose an epidemic model
indicating that according to a scale-free network created by Barabási and Albert (1999),
an epidemic threshold tends toward 0 as long as the network is sufficiently large. Based
on their model (which I will refer to as the P-V model in this dissertation), Huang and
Tsai proposed a modified model containing resource limitations and transmission costs
for analyzing epidemic thresholds (Huang et al., 2010; Tsai and Huang, 2010). We
used computer simulations to verify the model, as well as to show its practical
3.1.
Motivation
Researchers who take network-oriented approaches to analyzing contagious
disease diffusion processes note that the topological features of social networks exert
considerable influence on transmission dynamics and spreading situations associated
with epidemics (Newman, 2003; Newman & Watts, 1999). Unlike non-network
approaches, they support subtle analyses of epidemic dynamics (Pastor-Satorras &
Vespignani, 2001a, 2001b, 2002, 2003; Huang et al., 2004, 2005). Researchers of
epidemic dynamics and critical thresholds in scale-free networks consistently conclude
that regardless of transmission capability, all contagious diseases have high
probabilities of stable spreading and survival in scale-free networks(Xu et al., 2007).
According to Pastor-Satorras and Vespignani (2001b), a positive critical
transmission threshold does not exist for the spreading of contagious diseases in
scale-free social networks. In other words, even contagious diseases with tiny
transmission capabilities survive in such networks. Pastor-Satorras and Vespignani’s
proposed spreading dynamic is expressed as follows:
[
]
{
}
( ) ( ) 1 ( ) ( ) k k k k d t t k t t dt ρ = −ρ +λ −ρ θ ρ (3.1)where ρk( )t is the density of infected nodes with k connections, λ a constant
linked to an infected individual, with θ assumed to be a function of the partial densities of infected individuals
{
ρk( )t}
. Eq. (3.1) states that during each time step, infected individuals who have k connections will recover, yet continue to infect otherindividuals according to four parameters: infection rate, connectivity, number of
healthy individuals, and probability θ ρ
[
{ k( )}t]
. Pastor-Satorras and Vespignani defined ρk as the steady state of ρk( )t , and observed that ρk is a function of λ ina steady state, therefore θ is a function of λ, such that ( ) 1 ( ) k
k
kP k k
θ λ =
∑
ρ , with ( )P k representing connectivity distribution. Furthermore, when considering the
stationary condition dρk( )t dt=0 within a scale-free network in which
2 3
( ) 2
P k = m k− with minimum degree m, the critical epidemic threshold λc has the
property 2
0
c k k
λ = → as k→ ∞. Accordingly, for infinite size networks, either
no epidemic threshold exists, or the threshold approaches 0.
New contagious diseases are constantly emerging in different parts of the world,
but very few reach epidemic proportions or even survive in social networks; the
majority of diseases die almost immediately following their appearance. This
observation serves as our motivation to take a more detailed look at limitations in
transmission and interaction processes rather than the topological features of social
networks—the focus of many epidemiological studies published in the past decade.
been understudied: resource limitations and transmission costs. The term resource in
this situation is defined as what is consumed by individuals during the spreading
process of a contagious disease. There are five properties associated with resources: (a)
they can be visible (e.g., seminal fluid, physical power) or invisible (e.g., time, energy);
(b) individual resources are finite and can be temporarily exhausted; (c) the use of one
type of resource entails the consumption of smaller quantities of other types of
resources, thereby reducing the total available resource amount; (d) individual
resources can recover or regenerate after a period of time; and (e) they are
non-reproducible. Contagious carriers who apply resources to specific recipients
cannot reuse the same resources on other recipients; conversely, recipients cannot reuse
resources spent on individual carriers. We acknowledge the importance of
Pastor-Satorras and Vespignani’s (2001a) work on the topological power-law features
of scale-free social networks, especially since their ideas have inspired numerous
studies on critical thresholds and immunization strategies. However, such assumptions
may be unrealistic and inaccurate when applied to biologically contagious diseases
spread via face-to-face interactions and daily contacts. A closer inspection of their
mathematical analyses and numerical simulations reveal what we believe to be
incorrect assumptions that daily interaction processes are cost-free, and that the impacts
3.2.
A Contagious Epidemiological Model
under Resource Limitations and
Transmission Cost Considerations
Our mathematical model is based on the epidemic simulation model shown in Eq.
(3.1) as proposed by Pastor-Satorras and Vespignani (2001b). However, this model
neglects individual access to energy, time, and other finite resources. Therefore, we
propose a model under different infection rate-to-link degree assumptions.
To incorporate individual access to energy, time, and other finite resources, we
modified the model to consider resource limitations and transmission costs using two
different approaches, as shown in Eq. (3.2).
[
]
{
}
( ) ( ) 1 ( ) ( ) , where min( , ). k k k k k k d t R t S t t S k dt c ρ = −ρ +λ −ρ θ ρ = (3.2)According to the term S (with k R representing average resources and c
transmission costs), the spreading of each infection is proportional to the minimum
value of each active node’s available resources (R/c) and number of links.
Using the mean field method, we let the stationary condition dρk( )t dt=0,
obtaining ( ) 1 ( ) k k k S S λ θ λ ρ λ θ λ = + (3.3)
1 ( ) 1 k k k S kP k k S λ θ θ λ θ = +
∑
(3.4)Note that the right side of Eq. (3.4) is concave at about θ (i.e., the second derivative is no larger than zero), and that θ =0 is considered a trivial solution. Since
it is possible for θ to have a non-singular solution, we derived the inequality
0 1 ( ) 1. 1 k k k S d kP k d k S θ λ θ θ λ θ = ≥ +
∑
(3.5)Differentiating Eq. (3.5) and substituting 0 for θ we get 1 ( ) 1 or . ( ) k k k k k kP k S k
∑
λ ≥ λ≤∑
kP k S (3.6)Accordingly, critical threshold λc is defined as the maximal λ, resulting in
( ) c k k k kP k S λ =
∑
(3.7)Since Sk =min(R c k, ), the denominator can be divided into two parts, obtaining
2 . ( ) ( ) c R R k k c c k R k P k kP k c λ ≤ > = +
∑
∑
(3.8)According to the first term in the Eq. (3.8) denominator, k is smaller than R/c,
therefore substituting R/c for k makes the first term larger. Similarly, according to the
second term, the summation is smaller than the entire scope of k, therefore substituting
2 ( ) ( ) c R k k c k R R P k kP k c c λ ≤ ≥ +
∑
∑
(3.9)Using the same method, another substitution on the left side of the Eq. (3.9)
denominator results in 2 . ( ) ( ) c k k k R R P k kP k c c λ ≥ +
∑
∑
(3.10) Since ( ) 1 k P k =∑
, we arrive at 2 2 1 . c k R R R k c c c R k c λ ≥ = + + (3.11)and observe that as k → ∞, λc is at minimum equal to c R. 0 0.1 0.2 0.3 0.4 0.5 0% 5% 10% 15% 20% 25% % = (Transmission Costs / Individual Usable Resources)
E p id em ic T h re sh o ld λλλλc
Figure 3.1. Critical Threshold λc is a function of the ratio of transmission costs to individual resources (c R/ ) in scale-free networks. We used it to analyze results from
our simulation experiments and three mathematical analyses.
As shown in Figure 3.1, the mathematical results are consistent with the
simulation result. The results indicate that when resources and transmission costs are
taken into consideration, a significant critical threshold (above which a contagious
disease exceeds control and becomes epidemic, and below which a contagious disease
disappears) exists when a contagion event occurs in a scale-free network—in short, a
non-zero critical threshold exists in scale-free networks. Our results also indicate that
the appearance of a critical threshold is tied to a ratio of transmission costs to available
resources. In summary, the lower bound of λc becomes larger whether transmission cost c increases or the average resource R decreases. Accordingly, an individual’s
available resources expand when c/R is large, thereby decreasing that individual’s
ability to contact almost all other personal network nodes. Since λc represents the
threshold at which a contagious disease exceeds control and become epidemic,
managing the value of λc is the primary concern of epidemiologists and public health
officials. The result supports what we know about immunization: appropriately
restricting one’s resources increases the critical threshold. Neglecting one’s resources
that the critical threshold λc will approach 0 as long as the size of the average number of links is large enough. The model thus becomes identical to Pastor-Satorras and
Vespignani’s model (Eq. 3.1), in which a disease has the potential to become epidemic
3.3.
Epidemic Effect of Limited
Resources/Transmission Cost Ratio
One scenario to which Eq. (3.11) can be applied is a network attack spread via the
Internet—an example of a scale-free network (Barabási et al., 2002). Although
spreading time is short, affected areas can be very large, with disastrous results in terms
of lost data, work time, and money. One suggested strategy for controlling computer
network attacks is placing restrictions on downloads from web services (e.g., a
maximum of one gigabyte per day)—in other words, a time resource limitation to raise
the outbreak critical threshold λc. Another potential strategy is charging downloading fees—that is, raising transmission costs to increase outbreak critical thresholds. The
algorithm Barabási and Albert (1999) introduced to build their model (which I will
refer to as the BA model in this dissertation) is based on a concept common to networks
such as the Internet, the World Wide Web, and social networks—that is, for each node
there is a large probability of connecting to other nodes that are already linked to still
other nodes. According to the algorithm, we take m0
disconnected nodes, steadily add new nodes, and connect the new nodes to existing m nodes at a probability of
( ) i i j j k P k k =